Square
Following
Hot
News
Notifications
Profile
Share your thoughts
placeholder
Article
$SOL ‌ — 1H

The $64.87 dip might have been the reset SOL needed. Now all eyes are on $73.

What I like about this recovery is how buyers stepped in and gradually brought SOL back above the $67.94 Super trend. Price is now holding around $70.80, with higher lows giving the structure a healthier look.

Levels worth watching:

Resistance: $71.12 → $73.20 → $75

Support: $70 → $68.82 → $67.94

Potential long setup:

Entry: $69.80–$70.20

SL: $67.60

Targets: $71.12 / $73.20 / $75

Buyers currently hold a slight order-book advantage at 53.90%. A solid 1H close above $71.12 could bring the next l
SOL-0.77%
NVDA-13.84%
  • 1
$PIPPIN 's moving averages are clearly defined: the 100-day MA is at 0.01872, and the 200-day MA is at 0.03959. The close on the 21st was around 0.017, failing to get above even the 100-day MA.

The resistance levels above are 0.0187 at the 100-day MA, around 0.0202 near the previous high, then 0.0234 further up, with 0.0543 much farther away. Below, 0.0148 is where the move kicked off on the 18th, and below that is the all-time low of 0.011.

One analysis put it plainly: to break above 0.0202, spot buying needs to come in first; derivatives alone won't get it there.

The project itself can't
post-image
PIPPIN-2.21%
ETH-1.23%
  • 1
Trenches
IDOL
I
bade
b
IDOL
0x3b...ab07
Market Cap
$.
Change
.
24h Vol
$.
Holders
.
PIEVERSE
P
bade
b
PIEVERSE
0x0e...25a9
Market Cap
$
Change
.
24h Vol
$.
Holders
.
FIONA
F
bade
b
FIONA
B34n...pump
Market Cap
$.
Change
.
24h Vol
$.
Holders
.
Singularity
S
bade
b
Singularity
7R4M...pump
Market Cap
$.
Change
.
24h Vol
$.
Holders
.
CLAUDIA
C
bade
b
CLAUDIA
2j5S...W2ZM
Market Cap
$.
Change
.
24h Vol
$.
Holders
.
Live trading - Analysis crypto coin
live-cover
LIVE1,960
ETH-1.26%
BTC-0.67%
GT-2.41%
$NVDA This stretch of the move was “leaking” down, not “getting dumped”: it opened a notch lower and closed another notch lower, with not a single bearish candle worth screenshotting for over ten hours. A dump comes with emotion and rebounds; a leak has no emotion and just inches down one tick at a time. Three rebounds, each lower than the last; the second was only half the first. The layer of sell orders overhead went from a wall to a sheet of paper. The bands are tightening. But for individual stock tokens, tightening is an after-hours effect, not structure—so the only real evidence is that
NVDA-13.84%
  • 1
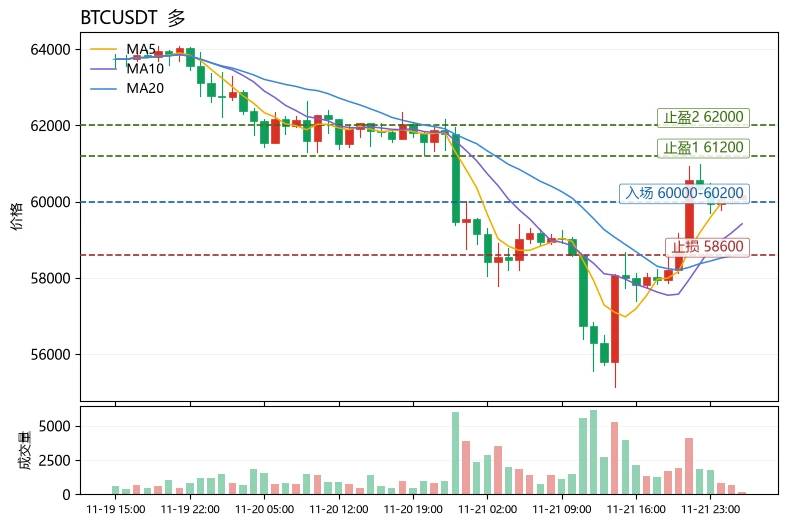
$BTC Bottom line: Short-term outlook is bullish, but only buy on pullbacks—don’t chase highs. The moving averages remain in a bullish alignment (MA5=60121.2 above MA20=58625.5), and the MACD histogram at +387 remains positive, so the trend is intact. However, RSI at 57.1 is merely neutral-to-strong, not overbought, while the upper Bollinger Band at 61266.7 is immediate resistance. With the current price of 60190 leaving limited room to the upper band, chasing longs offers an unfavorable risk-reward ratio.
Structurally, the price is trading between the middle and upper Bollinger Bands, placing
post-image
ZEC+1.16%
GRAM-0.97%
#CryptoMarket
Crypto Market at a Critical Turning Point: Massive Sell-Off, Extreme Fear, and What Comes Next?
The cryptocurrency market is experiencing one of its most challenging periods, with Bitcoin, Ethereum, and major altcoins facing significant selling pressure. November 2026 has brought renewed uncertainty, heavy liquidations, declining investor confidence, and concerns about the global economic outlook. However, the latest recovery in Bitcoin suggests that buyers are still attempting to defend important market levels.
1. Current Crypto Market Situation
Bitcoin (BTC), the world's larges
BTC-0.65%
ETH-1.26%
XRP-1.15%
SOL-0.77%
DOGE-0.22%
$BR has already met all my expectations for this setup. That's it for today. Taking profits. Looking at $VVV and $XRP .
post-image
BR+6.00%
VVV+0.37%
XRP-1.15%
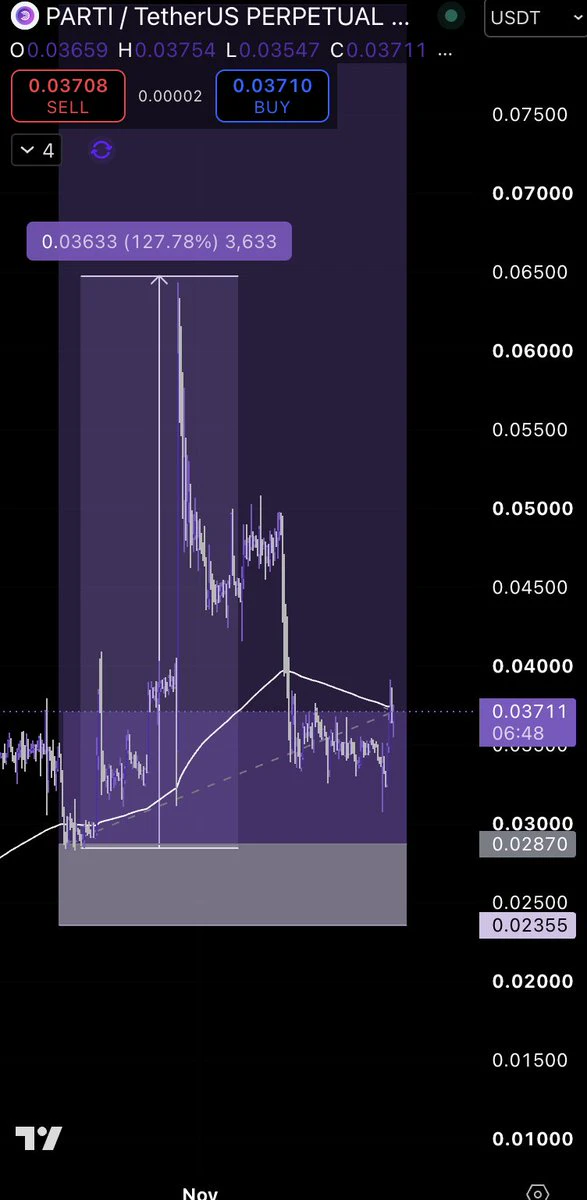
particle-network:native — ANOTHER BOUNCE COULD BE COMING 👀
PARTI is showing signs of recovery after the sharp sell-off from its highs.
Price has been consolidating around $0.033–$0.036, with buyers continuing to defend the local support zone. Now we're seeing another push toward $0.037–$0.040, where the key resistance and moving average are sitting.
If buyers manage to reclaim this area, I expect another bounce attempt toward $0.045–$0.048.
The setup is getting interesting again. Watching for confirmation and a strong daily close. 🔥
post-image
PARTI-1.06%
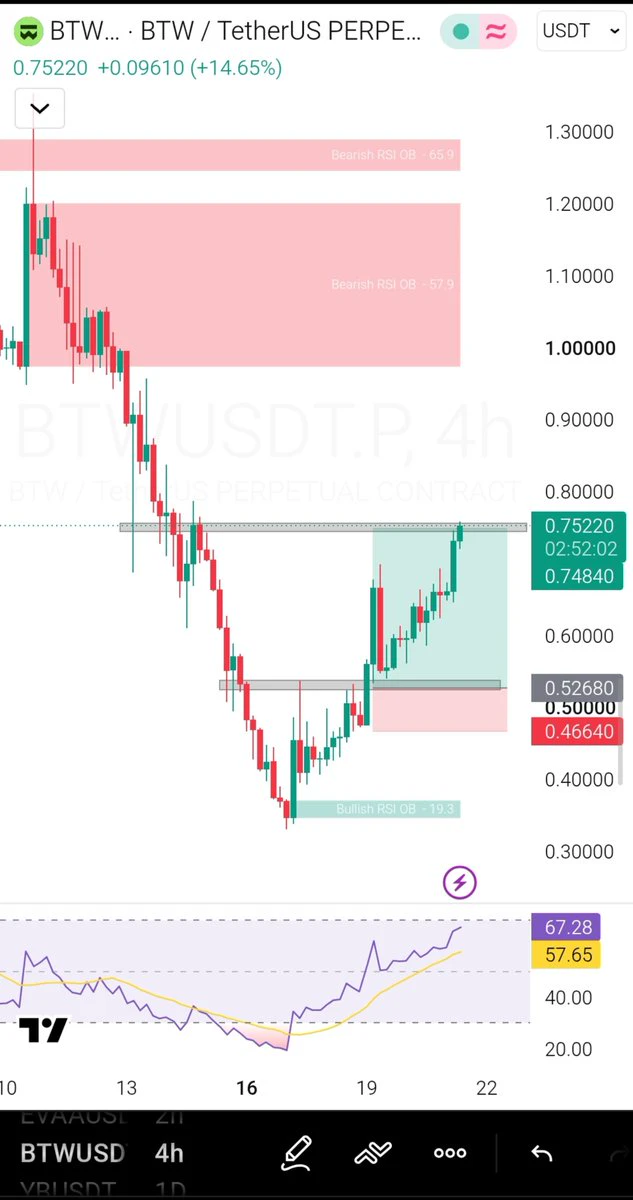
$VVV I think this is a bullish timeframe. Buy at 23.25 and 22.15. Targets: 24.07, 24.70, 25.30. Stop loss: 21.20
post-image
VVV+0.37%
$IDOL : 10/10 signals agree. It's the trade I'd skip.

Not because I'm bearish. Because of three numbers in the same report:

1. Entry 0.0321. Daily resistance 0.0323. That's 0.6%.
Stop is 4.92% away.
0.6% of clear room for 4.92% of risk = 0.12R to the first wall.

2. RSI 83 on 1h, 85 on 4h.
The report's own line: "overbought readings often pull back first, do not chase longs into them."
Ten out of ten signals say long. The report then tells you not to enter. Both are in the same document.

3. Three consecutive bull traps — and every one led to gains.
21 Nov: wicked past 0.03065, closed 0.0305
IDOL-7.01%
BTC-0.65%
ZEC+1.29%
Day two of copy trading—how’s the performance looking, guys? 🥳
Nvidia intetim ceo colltte kres faces a ......
live-cover
LIVE18
ETH-1.26%
BTC-0.67%
SOL-0.77%
USDC+0.01%
I use these indicators
- RSI.
- 12/26 or 25 EMA
- OBV
post-image
First time leading trades, please offer guidance
Conservative trader
Here are the hard rules I’ve set for leading trades
Let’s keep me accountable together
Starting with 1000u
$BTC Currently bullish, targeting around 66000
post-image
BTC-0.65%
ETH Wealth Code
11/22
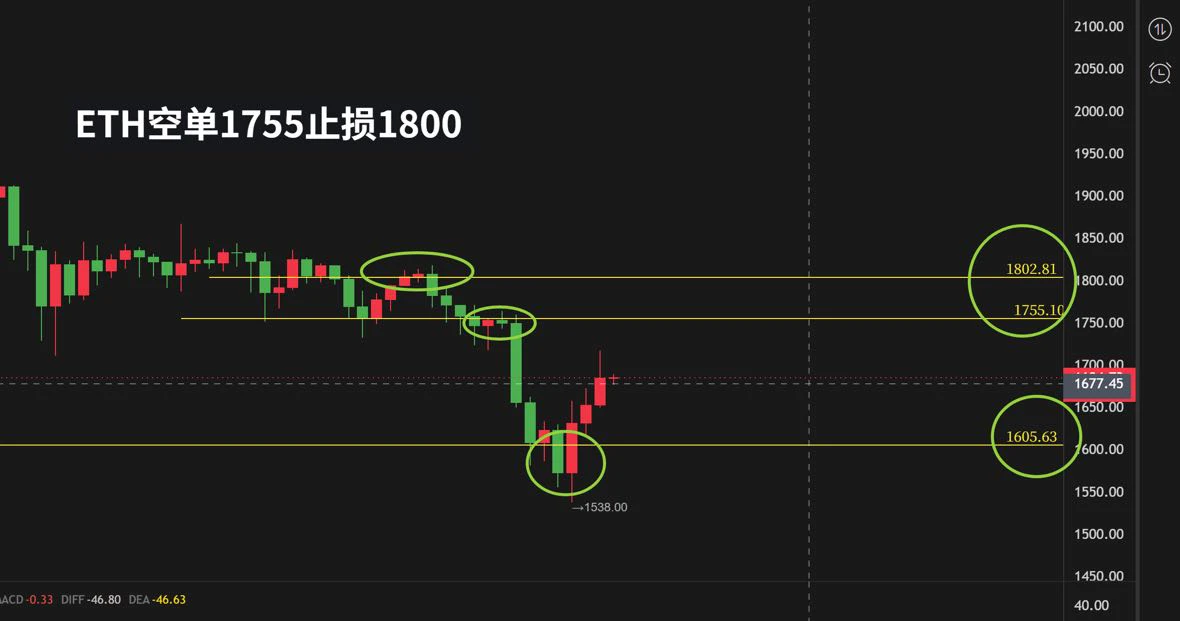
Yesterday, all the long trades from the strategy on the 21st were profitable. Next up: the short strategy
$ETH Short setup, for short trades before noon tomorrow only
post-image
ETH-1.23%
  • 1
The 0.0% Pullback
📍 What if $SKYAI ‌ entry is already inside the demand zone?
Price: 0.03651. Demand zone: 0.03642–0.03657.
“Wait for a pullback” to where you’re standing.
Entry or déjà vu? 👇
$SKYAI ‌$ETH ‌
$MU ‌
SKYAI-7.69%
ETH-1.26%
MU-13.88%
$USELESS Entered USELESS at 0.07001; wick low at 0.0695, 2% from liquidation, with only 0.35 body lengths to spare. Same gesture as BTC at 55,806 (300 points from the wick tip) and ZEC at 696 (nine bucks above 687): no waiting for it to hold, no waiting for confirmation—just pressing the button in the last mouthful of blood.

Seventeen trades ago, I thought I was making money because I could read the market. Now I understand: I make money because I’m willing to press the button during those ten minutes when it feels worst physically. My hand doesn’t shake when I hit sell at the top; it shakes
USELESS-14.66%
BTC-0.65%
ETH-1.23%
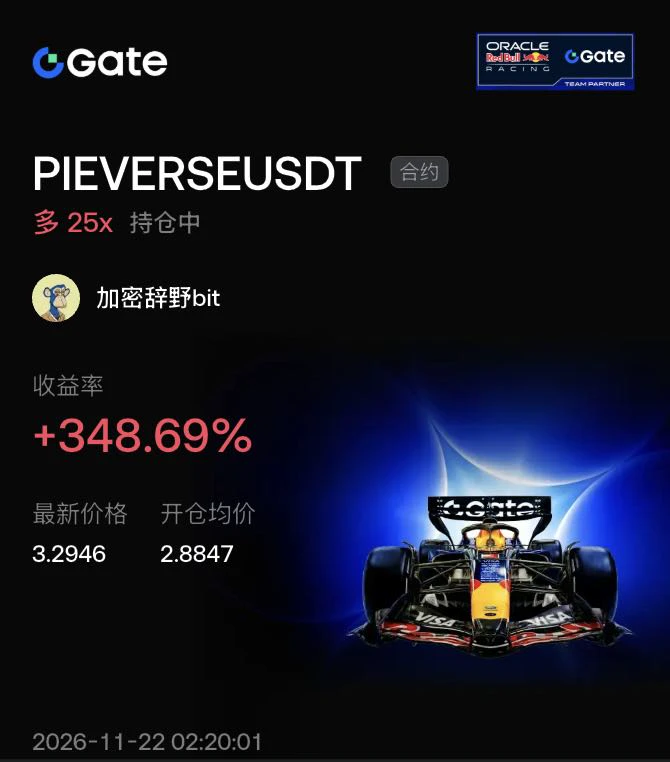
$PIEVERSE When trading, you have to learn to read resistance levels. Just below the previous high is where human nature is put to the test.

PIEVERSE has now reached around 3.29, with a solid ceiling at 3.63 above. Looking at the chart, the bulls are still pushing, but you can clearly feel their upward momentum fading. At a level like this, a double top or a false breakout can easily form.

I opened a long position around 2.88 earlier and rode it up to here. Facing this key resistance level, my strategy is simple: take profits in batches. I’ve already locked in 348% profit, and even if it brea
post-image
PIEVERSE+0.58%
BTC-0.65%
  • 2
Go long at 4-hour support $QNT . Hold 141, next target 150. If it breaks below 136, I’ll abandon this idea. Rationale: - On the 4-hour timeframe, price is at 142; buyers need to defend this level to push the price higher. - The daily chart is above EMA200 (124), strengthening confidence in this trade setup. Long 141.3–142.0 Take profit 144.8 / 147.0 / 150.2 Stop loss 136.3 This is not investment advice; manage your position size yourself.
post-image
QNT+4.79%
Load More

Join 40 M users in our growing community

⚡️ Join 40 M users in the crypto craze discussion

💬 Engage with your favorite top creators

👍 See what interests you

Trending Topics

BTCBreaksBelow60K

2.1M Views29.9K Discussing

BTC fell below $60,000 on November 20 for the first time since July, alongside a tech stock selloff and broader pressure on risk assets. Will $60K become resistance, or can BTC quickly reclaim it? What price or volume signals would convince you that selling pressure is easing?

GateDirectIPOPhase3ANTAllocates92100Shares

786K Views4.9K Discussing

NvidiaDropsNearly14Percent

329.2K Views7.6K Discussing

View More