Share crypto content and earn up to 60% commissions through content mining.
placeholder
gatefun
Most traders spend years searching for the "perfect indicator."
The truth?
Profitable trading rarely comes from a single indicator.
It comes from combining trend, momentum, volume, and risk management into one repeatable system.
This is the exact framework many professional traders use when analyzing $BTC and other crypto markets.
🔹️ Step 1: Trend Identification
Before entering any trade, determine the market direction.
I use:
▫️ MA7 = Short-term momentum
▫️ MA25 = Active trend
▫️ MA99 = Mid-term structure
▫️ MA200 = Macro direction
For a bullish market, I want to see:
🟢 MA7 above MA25
🟢 M
post-image
CryptoSat
One of the biggest mistakes traders make is chasing green candles.
By the time they enter, the move is already extended.
Professional traders often do the opposite.
They wait for the pullback.
And one of the simplest ways to identify pullbacks is by using Moving Averages.
🔹️ What Is an MA Pullback Entry?
An MA pullback entry occurs when price retraces back into a key Moving Average during an existing trend.
Instead of buying the breakout, traders wait for price to return to areas such as:
▫️ MA7 during strong momentum
▫️ MA25 during healthy trends
▫️ MA99 during deeper corrections
The goal is simple:
Join the trend at a better price.
📊 Trend Continuation First
MA pullbacks work best when the trend is already established.
For example:
If $BTC is making:
▪️ Higher highs
▪️ Higher lows
▪️ Trading above MA25 and MA99
Then a pullback into MA25 is often a sign of trend continuation rather than weakness.
The market is simply taking a pause before the next move.
⚠️ Don't Buy the Touch
A common beginner mistake is entering the moment price touches an MA.
Professional traders wait for confirmation.
Look for:
▫️ Bullish engulfing candles
▫️ Strong rejection wicks
▫️ Higher low formations
▫️ Increased buying volume
The Moving Average identifies the zone.
The candle confirms the entry.
🎯 Practical BTC Example
Imagine #BTC rallies from 100K to 105K.
Instead of chasing the breakout, you wait.
Price pulls back into MA25.
A bullish candle forms and buyers defend the level.
That confirmation provides a much cleaner entry than buying the top of the move.
🛡️ Risk Management Matters
Every setup can fail.
That's why experienced traders always define risk.
▪️ Place stop-loss below the invalidation level
▪️ Avoid oversized positions
▪️ Never assume support will hold
A good entry means nothing without proper risk management.
📌 The best traders don't chase momentum.
They wait for the market to come back to them.
That's the power of MA pullback entries.
repost-content-media
  • Reward
  • Comment
  • Repost
  • Share
【$T Signal】Long + negative funding rate squeeze + 1H buy-side impulse
$T Funding rate -0.199%. Shorts are continuously paying. In the last 1H candle, the bullish surge breaks out with heavy volume, and the buy ratio spikes to 0.53. The Bollinger Bands widen, and price holds above the midline. On 4H, the MACD histogram shrinks, but the fast line remains above the zero axis; the multi-timeframe structure has not reversed. Buy depth is 1.09, with clear resting orders underneath. After momentum briefly exhausts, it re-accumulates; in this structure, short covering often accelerates.
🎯 Direction
LAB-28.52%
BTC-0.05%
ETH0.99%
SOL0.20%
View Original
post-image
  • Reward
  • Comment
  • Repost
  • Share
btc prediction
gate liveLIVE
1,856
  • Reward
  • Comment
  • Repost
  • Share
JUST IN: Robinhood L2 sparks ETH optimism as even skeptics see potential upside for ETH. $ETH
HOOD-2.70%
ETH0.95%
post-image
  • Reward
  • Comment
  • Repost
  • Share
$SLX /USDT 4-hour RSI hits the bottom at 29, has a reversal signal already appeared?

$SLX /USDT - LONG

Trading plan:
Entry: 0.14747 – 0.14895
SL: 0.13900
TP1: 0.15512
TP2: 0.15972
TP3: 0.16662

Why focus on this setup?
- 15-minute RSI is only 29.37, oversold zone rebounds have high probability.
- The 1-day trend is range-bound, and the 4-hour long signal has been confirmed.
- Current price is 0.14821, close to the entry low of 0.14747, with a good risk-reward ratio.
- TP1: 0.15512 (+4.6%), TP2: 0.15972 (+7.8%), stop loss only 0.13900 (-6.2%).

Discussion:
Do you think this move will reac
SLX-6.15%
View Original
post-image
post-image
  • Reward
  • Comment
  • Repost
  • Share
Which coin is anchoring your portfolio for this run?
Drop your top high-conviction picks below and let’s catch these gains together! 👇
#Crypto #Altseason #BullRun #100xGems #CryptoTrading
post-image
  • Reward
  • Comment
  • Repost
  • Share
This kind of market action is really exhausting. $SOL spent a long time grinding; during the day it dipped a few times, and a lot of people probably got shaken so badly they didn’t want to watch anymore. What I was watching at the time was around 74.15. I didn’t rush to chase it—I waited for it to wash out the emotions it needed to shake out.
After that, SOL started pushing higher, moving from 74.15 to 76.71. Only then did long-position feedback come in little by little. That +321.15% profit wasn’t white waiting for. Honestly, holding your position is harder than just being right.
For me, it’s
SOL0.20%
BTC-0.05%
ETH0.99%
View Original
post-image
  • Reward
  • Comment
  • Repost
  • Share
$XAG /USDT’s 15-minute RSI dropped to 12.19—has the dip-buying opportunity arrived?
$XAG /USDT - Go LONG
Trading plan:
Entry: 58.69 – 58.75
SL: 58.31
TP1: 59.03
TP2: 59.24
TP3: 59.55
Why focus on this setup?
- Daily consolidation, but the 4-hour signals are clearly bullish, with a confidence of 77.4%.
- Current price 58.72, RSI is extremely oversold; historical data shows a high rebound probability after such extreme values.
- Entry zone 58.69–58.75, TP1 59.03, TP2 59.24, stop-loss 58.31, risk-reward ratio of 2:1 or higher.
- Why now? After oversold conditions, short-term reversal momentum is
XAG-1.52%
View Original
post-image
post-image
  • Reward
  • Comment
  • Repost
  • Share
In crypto, the hardest part isn’t actually choosing a direction—it’s holding back your hand. Back when $AVAX was moving sideways at a high level, many people around me thought it should keep pushing higher, but watching that exhausting back-and-forth made me more vigilant instead.

I don’t consider myself some kind of expert; I’ve been trapped in similar positions before. When AVAX approached 6.582, the order book tried several times to push up but couldn’t break through. That’s when I opened a small long position, light size, to test the waters—if it was wrong, I’d admit it.

Later it moved
AVAX-2.35%
BTC-0.05%
ETH0.99%
View Original
post-image
  • Reward
  • Comment
  • Repost
  • Share
This sell-off just now provided the answer. The pressure near the highs before wasn’t just intimidation—it was real selling/offloading by someone.
$PROS is holding sideways in that band above. I’ve always felt something was off: the price didn’t look like it dropped, but the rebound strength has been weaker every time. A lot of people are still hesitating about whether to chase more longs—this is the key point: the market has started moving against expectations. After going short around 0.7292, I was waiting for this leg to confirm it.
It’s now around 0.4084. The unrealized position profit sho
PROS-0.77%
BTC-0.05%
ETH0.99%
View Original
post-image
  • Reward
  • Comment
  • Repost
  • Share
This DOGE rebound is a trap—the shorts are aiming at 0.07261.
$DOGE /USDT - SHORT sell
Trading plan:
Entry: 0.07250 – 0.07272
SL: 0.07366
TP1: 0.07182
TP2: 0.07130
TP3: 0.07051
Why focus on this setup?
- The 1-day trend is clearly bearish, and the 4-hour short signals have been activated.
- The 15-minute RSI is only 27.92: oversold, but not reversed—bearish momentum is still there.
- Entry reference is 0.07261; targets: TP1 0.07182, TP2 0.07130; stop-loss 0.07366.
- Why now? A low RSI low doesn’t mean a bottom—trend continuation has a higher probability, and the short timing is right.
Discussi
DOGE-0.64%
View Original
post-image
post-image
  • Reward
  • Comment
  • Repost
  • Share
This round of price changes came fairly decisively. When the earlier rebound failed to hold, I shifted my focus to the continuity after selling pressure at the top.
My new position entry for $BNB was at 601.85. It wasn’t because of a single bearish candle that I judged the direction; rather, after the structure repeatedly weakened, the price began to lose key levels. When it was pulled up to around 573.6, the market feedback was already quite clear.
The most critical thing during holding isn’t excitement, but whether the pace of the move continues to play out. With the return rate at +333.64%,
BNB-0.11%
BTC-0.05%
ETH0.99%
View Original
post-image
  • Reward
  • Comment
  • Repost
  • Share
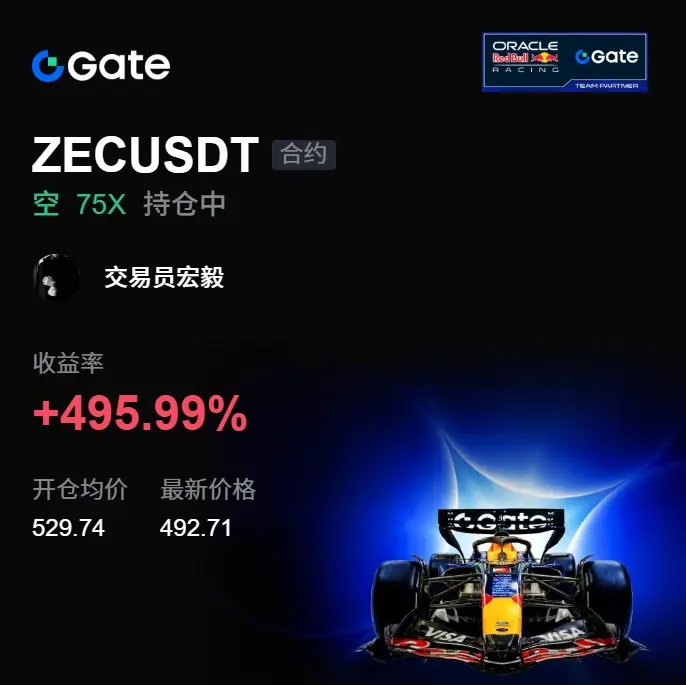
Woke up feeling great—📢📉! A few days ago, in my last glance before bed, $WLFI was still pretending to be strong. I pulled it up, but there wasn’t any volume. Every time it tried to surge, it was short by one breath. Back then, I reminded myself not to get lured into longs and follow the crowd. Being in a short position is more comfortable than chasing a breakout.
Bought from 0.05841, and now at 0.05762—🔥✅ the chart finally stopped pretending: +95.96% realized. This “profit” was eaten comfortably; everyone on the car should’ve woken up laughing 😎.
When it’s time to take the profit, don’t p
WLFI-1.12%
BTC-0.05%
ETH0.99%
View Original
post-image
  • Reward
  • Comment
  • Repost
  • Share
fifa would cup 2026
gate liveLIVE
87
  • Reward
  • Comment
  • Repost
  • Share
$ARC ’s breakout here is clearly not just a random spike—the funding flow rhythm has changed.
I went long at 0.06650; the current price is already 0.07873, up +362.38%. I’ve already taken profit. The prior range-bound consolidation looked painful, but that’s exactly where accumulation and hand-changing were happening.

What really caught my attention is that after the sell walls above were consumed, the pullback has been getting smaller and smaller. A lot of people only watch short-term fluctuations and can’t see the order-book rhythm underneath. To put it simply, someone is slowly pushing the
ARC-0.81%
BTC-0.05%
ETH0.99%
View Original
post-image
  • Reward
  • Comment
  • Repost
  • Share
$S better ‌1% every day..........
S-2.12%
post-image
  • Reward
  • Comment
  • Repost
  • Share
We locked into the trenches everyday and never had to work again
post-image
  • Reward
  • Comment
  • Repost
  • Share
ETH shorts have been locked in—do you dare to follow with a 95% win rate?
$ETH /USDT - SHORT sell
Trading plan:
Entry: 1796.04 – 1801.12
SL: 1822.92
TP1: 1780.33
TP2: 1768.16
TP3: 1749.91
Why focus on this structure?
- 4-hour level confirms the bearish setup; on the 15-minute RSI is only 27.04—oversold but hasn’t bounced.
- Entry point 1798.58, targeting TP1 1780.33, TP2 1768.16, TP3 1749.91.
- Stop-loss at 1822.92, risk is controllable; the 1-day trend is bearish—why now? Because the bearish momentum hasn’t faded.
Discussion:
Will this wave hit TP2 first, or will it directly “insert a needle”
ETH0.99%
View Original
post-image
post-image
  • Reward
  • Comment
  • Repost
  • Share
After seeing TermMaxFi’s update today, my first impression is that this move is kind of interesting.
They now support using assets like Royco: on the platform you can borrow fixed-rate USDC, with a maximum limit of one million.
Your borrowing cost can be locked in, so you don’t have to worry about it getting more expensive later.
In DeFi, the word “fixed” is becoming increasingly valuable.
This time, TermMaxFi effectively adds a bit more certainty for users.
Someone like me who doesn’t want to calculate interest rates every day finds it pretty comfortable.
The points system is stil
USDC-0.01%
View Original
post-image
  • Reward
  • Comment
  • Repost
  • Share
No matter where you go in the world.
You will always find a Starbucks.
SBUX-0.37%
post-image
  • Reward
  • Comment
  • Repost
  • Share
Load More

Join 40 M users in our growing community

⚡️ Join 40 M users in the crypto craze discussion
💬 Engage with your favorite top creators
👍 See what interests you
  • Pinned