
Share crypto content and earn up to 60% commissions through content mining.
placeholder
gatefun
I met Movement’s founder last year. He was a man, wearing a pair of gold-wire glasses. When he went on stage to give a speech, I almost fell asleep. Back then I thought: With skills this low, how could he still set up such a big operation?
View Original
post-image
  • Reward
  • Comment
  • Repost
  • Share
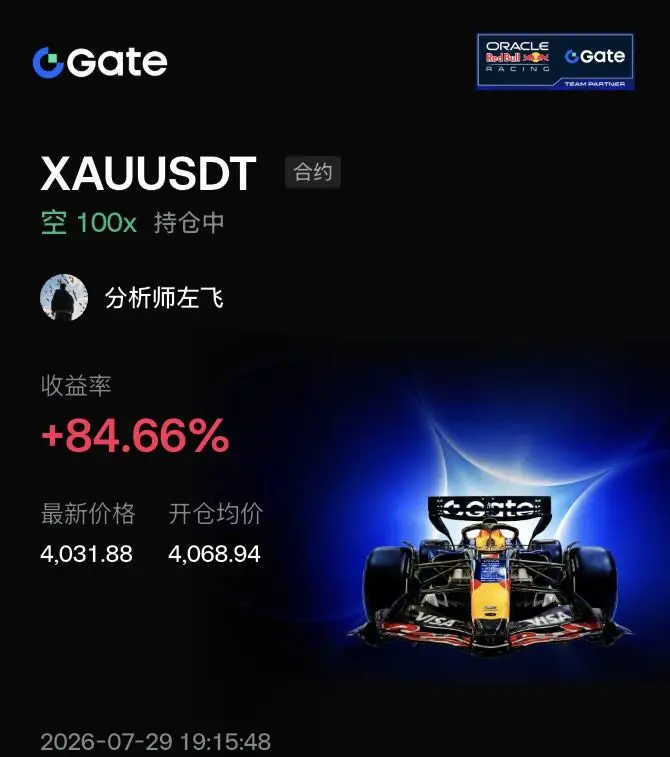
#xauusd gold asia session 2RR
XAUUSD1.50%
post-image
  • Reward
  • Comment
  • Repost
  • Share
$PLAY For the short-term direction, I’m bearish. For this kind of strong-market-maker coin, the risk-reward ratio at the current level is pretty good, so you can look into a short opportunity. Place the defense at 38; if it goes lower, it may come into the 32 area. However, strong-market-maker coin price action is usually pretty erratic, so if you participate, make sure to mind the risks—don’t overcommit or chase too much.
PLAY8.79%
View Original
post-image
  • Reward
  • Comment
  • Repost
  • Share
South Korea’s equity relief seems underway: KOSPI breaks 7,100, up ~5.6% as leveraged long positions and retail risk tilt shrink, with deleveraging ~75% done. $KS11 / $KOSPI
post-image
  • Reward
  • Comment
  • Repost
  • Share
BTC OVERVIEW
gate liveLIVE
1,875
  • Reward
  • Comment
  • Repost
  • Share
Yesterday, the Ethereum spot ETF with the highest net inflow in a single day was Blackrock’s ETF ETHA, with a net inflow of $34.31M; currently, ETHA’s historical total net inflows have reached $11.35B.
ETH0.51%
BLK-1.49%
View Original
post-image
熊猫二号
0/50
30D Return %
-4.60%
-46.15 USDT
30D P/L Ratio
0.59
AUM
$0
30D Win Rate
68.57%
  • Reward
  • Comment
  • Repost
  • Share
u姐7.22$SOL Morning Strategy
The market: On the 15-minute timeframe, the trend continues upward, touching the prior high around 78.87 and facing pressure. Overhead resistance is clear. In the short term, upward momentum is gradually slowing, and there is a pullback as traders face pressure at high levels.
Wait for a rebound at 78.60–78.85. For the stalled area, place staggered short entries; don’t short at the current price just to chase.
Stop loss: 79.20. If it breaks the prior high, the short thesis is directly invalid—exit decisively.
First target: 78.00. When reached, reduce the position by
SOL0.00%
View Original
post-image
  • Reward
  • Comment
  • Repost
  • Share
7.22 Gold Morning Report
Yesterday, geopolitical risk aversion warmed up, and gold broke out of a one-way uptrend, surging from the 4,000 level all the way to the 4,087 intraday high. The long-term uptrend remains intact on a large timeframe, but after consecutive rallies, short-term longs’ profit-taking has clustered and exited; there is a need for a technical pullback and correction.
In terms of technical structure, the daily chart has formed a W double-bottom pattern. The strong bullish candle has firmly held above the key support at 4,050, and the short-term bullish setup remains solid. On
BTC1.38%
GT0.28%
ETH0.52%
View Original
post-image
  • Reward
  • Comment
  • Repost
  • Share
Reading old diaries, I realize people are such strange animals: when they plunge, they want to surge; when they surge, they want to plunge.
View Original
post-image
  • Reward
  • Comment
  • Repost
  • Share
#夏日创作营
The CLARITY Act has reached a critical crossroads—latest developments and what passage could mean for crypto
On July 17, 2025, the U.S. House passed the Digital Asset Market Clarity Act (CLARITY Act) by an overwhelming margin of 294 votes to 134, like a sudden thunderclap that jolted the entire crypto world. Yet ten months later, the bill is still struggling through the sharp edge of the Senate. Where does it stand right now? Which step is it stuck on? And once it’s passed, what impact will it have on the crypto market? Little Lucky Coin is here to chat with you about it today:
1. Whe
MEME-0.09%
WLFI-0.01%
View Original
post-image
  • Reward
  • Comment
  • Repost
  • Share
Recently, BTC dipped to test the 63,900 support area, then rebounded and surged steadily, with the highs repeatedly being refreshed. Yesterday, it pushed up and touched the 66,900 zone. The long setup from the lower target level given yesterday was perfectly realized, and the profits are safely secured in hand.
From the current market structure, on the daily timeframe, the uptrend that began after the 57,758 bottom reversal has continued rising. Price has firmly held above the Bollinger middle band at 64,064, and the Bollinger Bands as a whole are expanding upward. The larger intermediate-term
BTC1.38%
ETH0.52%
View Original
post-image
  • Reward
  • Comment
  • Repost
  • Share
#夏日创作营 US stock market trend analysis: The key for the next year is not simply to judge whether the US stocks will rise or fall
RBC’s latest US equities outlook: Technology becomes the main line again; S&P 500 target 8,150 points in the next 12 months
In its latest published US stock strategy report, RBC Capital Markets has made a clear shift in its allocation recommendations across S&P 500 sectors.
The core signal released by the report is: RBC still favors the US stock market over the coming year, but the market’s upside path will not be smooth. The investment focus may shift again—from valu
GS2.88%
MS2.57%
View Original
post-image
ShizukaKazu
#夏日创作营 US stock market trend analysis: The key for the next year isn’t simply deciding whether US stocks will rise or fall
RBC latest US equities outlook: Tech becomes the main theme again; S&P 500 target of 8,150 points for the next 12 months
In its latest published US stock strategy report, RBC Capital Markets made clear adjustments to its allocation recommendations across major S&P 500 sectors.
The report’s core signal is: RBC still likes the US stock market over the next year, but the path of market gains will not be smooth. The investment mainline may shift again from value stocks, small caps, and non-US markets back to US large-cap tech, artificial intelligence, and mega-cap growth stocks.
On sector allocation, RBC raised the Information Technology sector from “neutral” to “overweight,” while lifting Consumer Discretionary from “underweight” to “neutral.” In contrast, Communication Services was cut from “overweight” to “neutral,” and Utilities was reduced from “neutral” to “underweight.”
After the adjustments, the three sectors RBC currently has at “overweight” are Information Technology, Financials, and Materials.
Tech returns as the preferred growth segment. RBC’s most important change this time is to re-establish Information Technology as the preferred growth segment. Over the past month or more, the tech sector has lagged the S&P 500 at times due to profit-taking in AI bellwethers, semiconductor valuation pressure, and rotations in market style. But from a fundamentals perspective, tech companies’ earnings and revenue expectations remain among the strongest across all sectors, and capital has started flowing back into tech funds.
More importantly, RBC believes that although the tech sector’s overall valuation is not cheap, it is only slightly above its long-term average and has not reached an out-of-control level. Given that tech stocks’ market-cap share in the S&P 500 is already above one third, if investors remain bullish on the S&P 500’s performance over the next year, it is difficult to be bearish on the tech sector at the same time. Opportunities within tech are also not identical.
RBC thinks Software, IT services, and tech hardware, storage, and peripherals currently have both favorable earnings-revision trends and attractive relative valuations. Among them, the Software sector’s valuation is close to historical lows, but earnings expectations remain strongly upward; its risk-reward is improving. By comparison, the semiconductor industry still has very strong earnings growth, but valuations remain at historical highs. Even with recent pullbacks, RBC reminds investors that there is no guarantee within the year that profit-taking won’t happen again in AI and semiconductor “hot” stocks.
Consumer sentiment may be overly pessimistic. RBC lifted Consumer Discretionary from underweight to neutral, but that does not mean RBC thinks US consumers have fully recovered. Instead, RBC believes market pessimism about the consumer sector may already be excessive.
At present, US consumer confidence is still relatively weak, but some survey data show signs of stabilizing. Historical experience suggests that when University of Michigan consumer confidence starts to rise, both consumer discretionary and consumer staples tend to capture relatively favorable returns. From an earnings perspective, the earnings revisions in the consumer discretionary sector are roughly balanced. Valuation is not low, but it is not clearly so expensive that it must remain underweighted.
RBC also believes that in sub-sectors such as auto parts, diversified consumer services, and specialty retail, there are starting to be more opportunities worth watching. Therefore, this adjustment looks more like a “repair” from excessive pessimism rather than a strong bullish call on the consumer cycle.
Financials and Materials remain overweight. Other than tech, RBC continues to overweight Financials and Materials. Financials is one of the best-rated sectors in RBC analysts’ surveys.
Analysts generally like the financial industry’s outlook for the next 6 to 12 months and hold a positive view on sector valuations, demand, and the US domestic policy environment. At the same time, earnings and revenue expectations for the financial sector are improving, and capital flows have turned positive. Banks, insurance, and consumer finance are the sub-segments RBC considers relatively most attractive.
For capital markets businesses at investment banks such as Goldman Sachs and Morgan Stanley, RBC is comparatively cautious.
Capital markets is not the most attractive direction within the financial industry right now, but its valuation is already clearly below last year and is no longer in an obviously expensive state. If M&A, IPOs, securities issuance, and private credit activity continue to pick up, capital markets business could still benefit.
Materials also remains overweight. Its main advantage is relatively lower valuation, with earnings and revenue expectations turning positive again, and capital flows starting to stabilize. Metals and mining, and chemicals are among the more watched directions. Energy fundamentals are strong, but capital flows remain a constraint. Energy was at one point an object RBC considered upgrading to overweight.
From a fundamentals perspective, the energy sector has strong earnings and revenue revisions, relatively cheap valuation, and analysts generally take a positive view of demand, the policy environment, and future performance. Meanwhile, amid ongoing global geopolitical uncertainty, energy stocks can also provide some portfolio “insurance” effect. However, RBC ultimately keeps the energy sector at neutral allocation, mainly because there have been notably clear capital outflows from energy funds recently. That means RBC is not denying the energy sector; rather, it believes there is currently insufficient confirmation from the capital-flow side. Once capital flows improve again, energy could become one of the next sectors to be upgraded.
The industrial sector has good fundamentals, but valuation is already too high. Industrial sector earnings and revenue expectations remain robust; manufacturing activity, infrastructure investment, supply-chain reshaping, and AI infrastructure capital expenditures all provide long-term support for related companies. However, the industrial sector has already become one of the most expensive sectors by valuation within the S&P 500, and the previously strong capital inflows have started to weaken.
Therefore, while RBC acknowledges its fundamentals, it temporarily maintains neutral allocation and does not recommend chasing upside at these elevated valuation levels.
Within industrials, the professional services industry has relatively more attractive valuation and earnings-revision dynamics. Areas such as electrical equipment and building & engineering still have strong earnings trends, but valuations have clearly risen. Utilities was cut to underweight. Utilities is the clearest underweight direction in this round of adjustments. Although utilities’ earnings and revenue expectations continue to improve, RBC believes the sector currently faces three main problems: valuation is too high, capital flows are too weak, and analysts lack sufficient confidence in future performance.
In addition, as US midterm elections approach, the affordability of electricity prices and living costs could become a policy focus, which may create potential pressure on utilities companies’ pricing power and earnings expectations. As a result, RBC cut utilities from neutral to underweight. Within the sector, only independent power producers and renewable energy producers are relatively more attractive in terms of valuation and earnings revisions.
S&P 500 target of 8,150 points remains. On the overall market view, RBC maintains its S&P 500 target of 8,150 points for the next 12 months. Based on the index level at the time the model locks, this implies roughly 10.8% upside potential.
RBC’s core logic is that over the next year, US corporate earnings growth—especially for AI-related companies—can, to some extent, offset the negative impacts from rising interest rates, inflation pressure, and valuation contraction. Its valuation model assumes that the S&P 500 P/E ratio gradually falls to about 24x, and it applies a 5% haircut to market consensus earnings expectations. Under assumptions of inflation around 3%, one Fed rate hike, and a 10-year US Treasury yield of about 4.5%, the model yields a reasonable value for the S&P 500 of about 8,162 points, which is broadly consistent with the official target of 8,150 points.
Therefore, RBC’s view for the coming year is not “valuations expand indefinitely,” but rather that earnings growth can push the index higher even as valuations contract slightly.
Second-quarter earnings growth still strong. The market currently expects S&P 500 constituent companies’ earnings per share in 2Q 2026 to grow year over year by about 24%. While this is lower than the roughly 30% pace in 1Q, it is still at a very strong level. Among companies that have reported early, about 94% had earnings above market expectations, up from 84% in 1Q. However, the proportion of companies with revenues above expectations is about 65%, down from 80% in 1Q. This result suggests that US corporate profits remain strong, but the breadth of growth is not as optimistic as the earnings numbers alone might indicate. Some companies may deliver upside earnings through cost control, margin improvement, or capital-structure optimization, rather than relying entirely on rapid revenue growth.
More worth noting is that the trend of upward revisions to overall S&P 500 earnings expectations has recently weakened, though this weakening is mainly concentrated among the other 490 companies outside the top 10. For the S&P 500’s top 10 by market value, the upward revision proportion for earnings expectations is currently about 90%, already near historical highs. This indicates that mega-cap companies still have a clear earnings advantage.
Market leadership may return to large growth stocks. Since the start of this year, the market has gone through multiple style switches. Value stocks, small caps, non-US markets, and companies with relatively lower weights in the S&P 500 have all outperformed large tech and mega-cap growth stocks at various times. RBC believes this kind of “market breadth” rally may still persist in the short term, but it looks more like episodic trading rather than a fundamental change in long-term leadership.
Conditions for large growth stocks to regain leadership are gradually forming.
First, earnings growth over the next few years for AI-related companies and the “Magnificent Seven” is expected to remain higher than for other companies in the S&P 500.
Second, earnings expectations for the top 10 companies in the S&P 500 have improved again, while earnings revisions for other companies are starting to cool.
Third, after recent pullbacks, valuation pressure on large tech stocks has eased noticeably compared with earlier levels.
RBC’s valuation model shows that the relative P/E for the S&P 500’s top 10 companies can now be explained by their long-term earnings-growth advantage, and they are no longer as clearly overvalued as they were earlier. As a result, RBC is on alert that the market could shift back toward US stocks, the tech sector, AI themes, and mega-cap growth stocks.
The small-cap rally may continue, but its durability needs monitoring. Russell 2000 has recently clearly outperformed the S&P 500, and small caps have broken upward out of the prior trading range. Factors supporting small caps include improved manufacturing and employment data, high levels of short positioning in the market, and an expectation that earnings growth in 2027 could accelerate meaningfully. According to market consensus expectations, small-cap profit growth in 2027 is expected to exceed both the overall S&P 500 and some AI bellwethers. Still, RBC does not fully pivot to small caps. After the Russell 2000 index annual adjustment, its valuation has already fallen back from the high end, but it is currently only near the long-term average and has not reached a level that is extremely attractive. At the same time, small caps are more sensitive to financing costs and changes in interest rates. If the market reprices the risk of additional Fed hikes, or capital returns to mega-cap tech stocks, the relative performance of small caps could be pressured. Therefore, small caps still have cyclical opportunities, but for now they are unlikely to replace large tech as the long-term core mainline.
Pullbacks may be capped at 5% to 10%. While RBC continues to like the market’s outlook for the next year, it does not think the upside path will be a straight line. As long as the US economy does not fall into recession and the Fed does not launch a large-scale rate-hike cycle, RBC expects the typical correction range for the S&P 500 is likely to be between 5% and 10%. Risks that could trigger a pullback include worsening Middle East geopolitical conditions, downward revisions to 2027 earnings forecasts, overly optimistic AI and semiconductor earnings expectations, policy repricing triggered by midterm elections, and further increases in US Treasury yields. Of particular note is the 10-year US Treasury yield. If yields merely stay near current high levels, the equity market still has the capacity to absorb them. But if yields continue breaking above 5%, or the Fed enters a stronger rate-hike cycle, the market adjustment could exceed the ordinary 5% to 10% range.
Conclusion
The core takeaways from RBC’s latest report can be summarized as: the logic behind the US stock bull market is not over, but investors need to re-emphasize earnings quality and sector selection. Tech, Financials, and Materials remain RBC’s top three preferred sectors. Pessimistic expectations for Consumer Discretionary may already be excessive and there is some room for a rebound. Energy has attractive fundamentals and valuation, but investors still need to wait for improved capital flows. Industrials have strong earnings, but valuation is too high. Utilities has been cut to underweight due to valuation and policy risks. From the perspective of market style, the sector rotation among small caps, value stocks, and non-US markets over the past period may not be fully finished yet, but the earnings advantage of large tech, AI, and mega-cap growth stocks remains clear.
As tech stock valuations continue to correct, market leadership is approaching a new turning point. For investors, the key for the next year isn’t just deciding whether US stocks will go up or down, but rather finding sectors and companies where earnings can be sustained and delivered, valuations remain relatively reasonable, and there is supportive capital behind them while the index still has room to rise.
repost-content-media
  • Reward
  • Comment
  • Repost
  • Share
#TrumpAgreesToClarityEthicsClause 🇺🇸 A New Milestone for U.S. Crypto Regulation? 🚀
The U.S. cryptocurrency regulatory landscape continues to evolve as reports indicate that President Donald Trump has agreed to the proposed Clarity Ethics Clause, a development attracting significant attention from lawmakers, digital asset companies, and global investors.
If implemented, the measure could strengthen transparency standards while supporting the broader goal of establishing a clearer regulatory framework for the crypto industry.
📌 Why This Matters
🏛️ Greater Regulatory Clarity
Clearer legisla
BTC1.38%
ETH0.51%
post-image
  • Reward
  • 1
  • Repost
  • Share
HighAmbition:
坚定 HODL💎
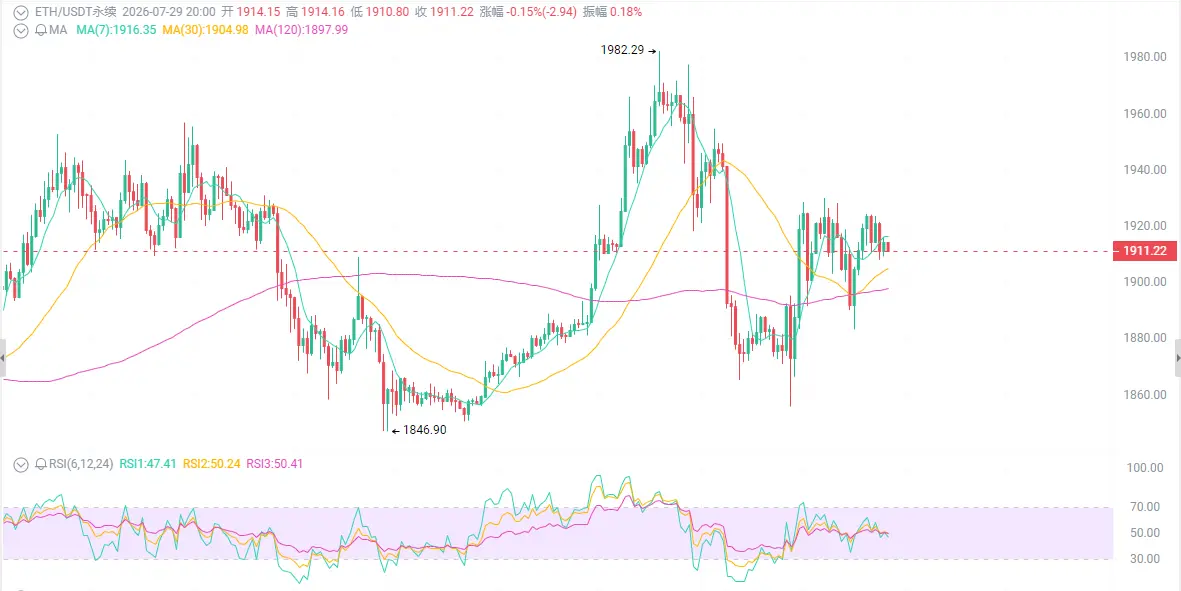
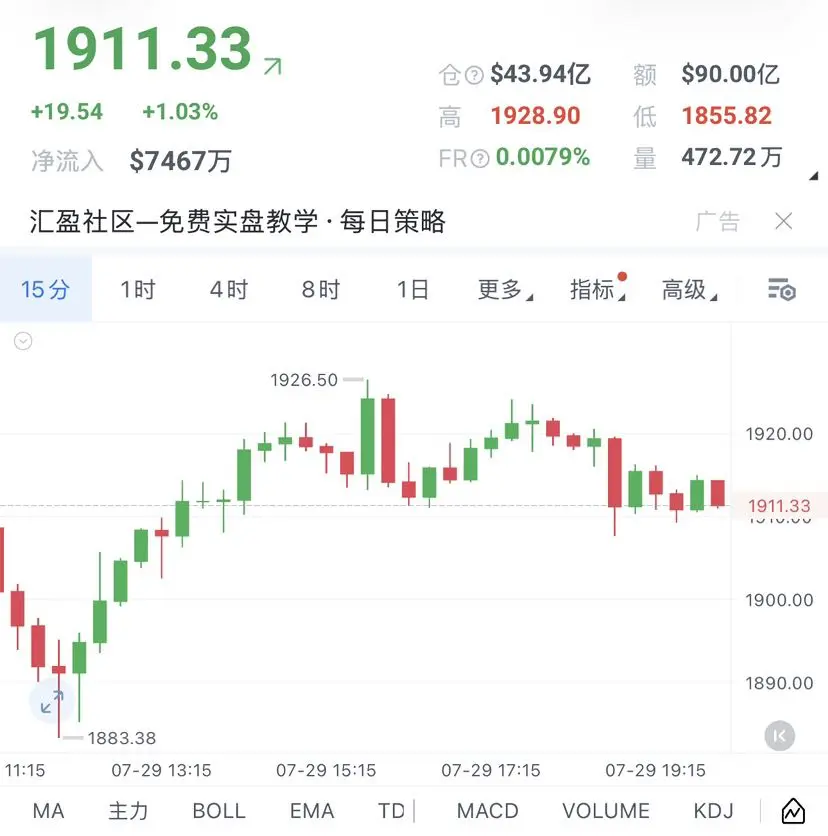
The recent market momentum has been fully nailed! The coordinated trend of “big pie” and “second pie” has played out as expected, and the gold range approach has also delivered within expectations.
No hindsight talk—I've mapped out the direction and key levels in advance; whatever the market does, the price action is within my predictions. #BTC突破66000美元 $BTC $ETH
BTC1.38%
ETH0.51%
View Original
post-image
post-image
post-image
post-image
post-image
  • Reward
  • Comment
  • Repost
  • Share
#TrumpAgreesToClarityEthicsClause
The CLARITY Act may have just reached its most important turning point.
After months of negotiations, the White House has reportedly reached an agreement on an ethics package that could remove the biggest obstacle preventing the CLARITY Act from advancing in the Senate. The compromise is expected to introduce restrictions on senior government officials—including the President, Vice President, and members of Congress—from personally benefiting from digital asset businesses while in office.
Ethics has been the center of the debate for months. Lawmakers raised c
post-image
post-image
  • Reward
  • Comment
  • Repost
  • Share
#夏日创作营 Double joy! Trump backs down on crypto bill, Bitcoin breaks above $66k, and Ethereum surges nearly 2,000
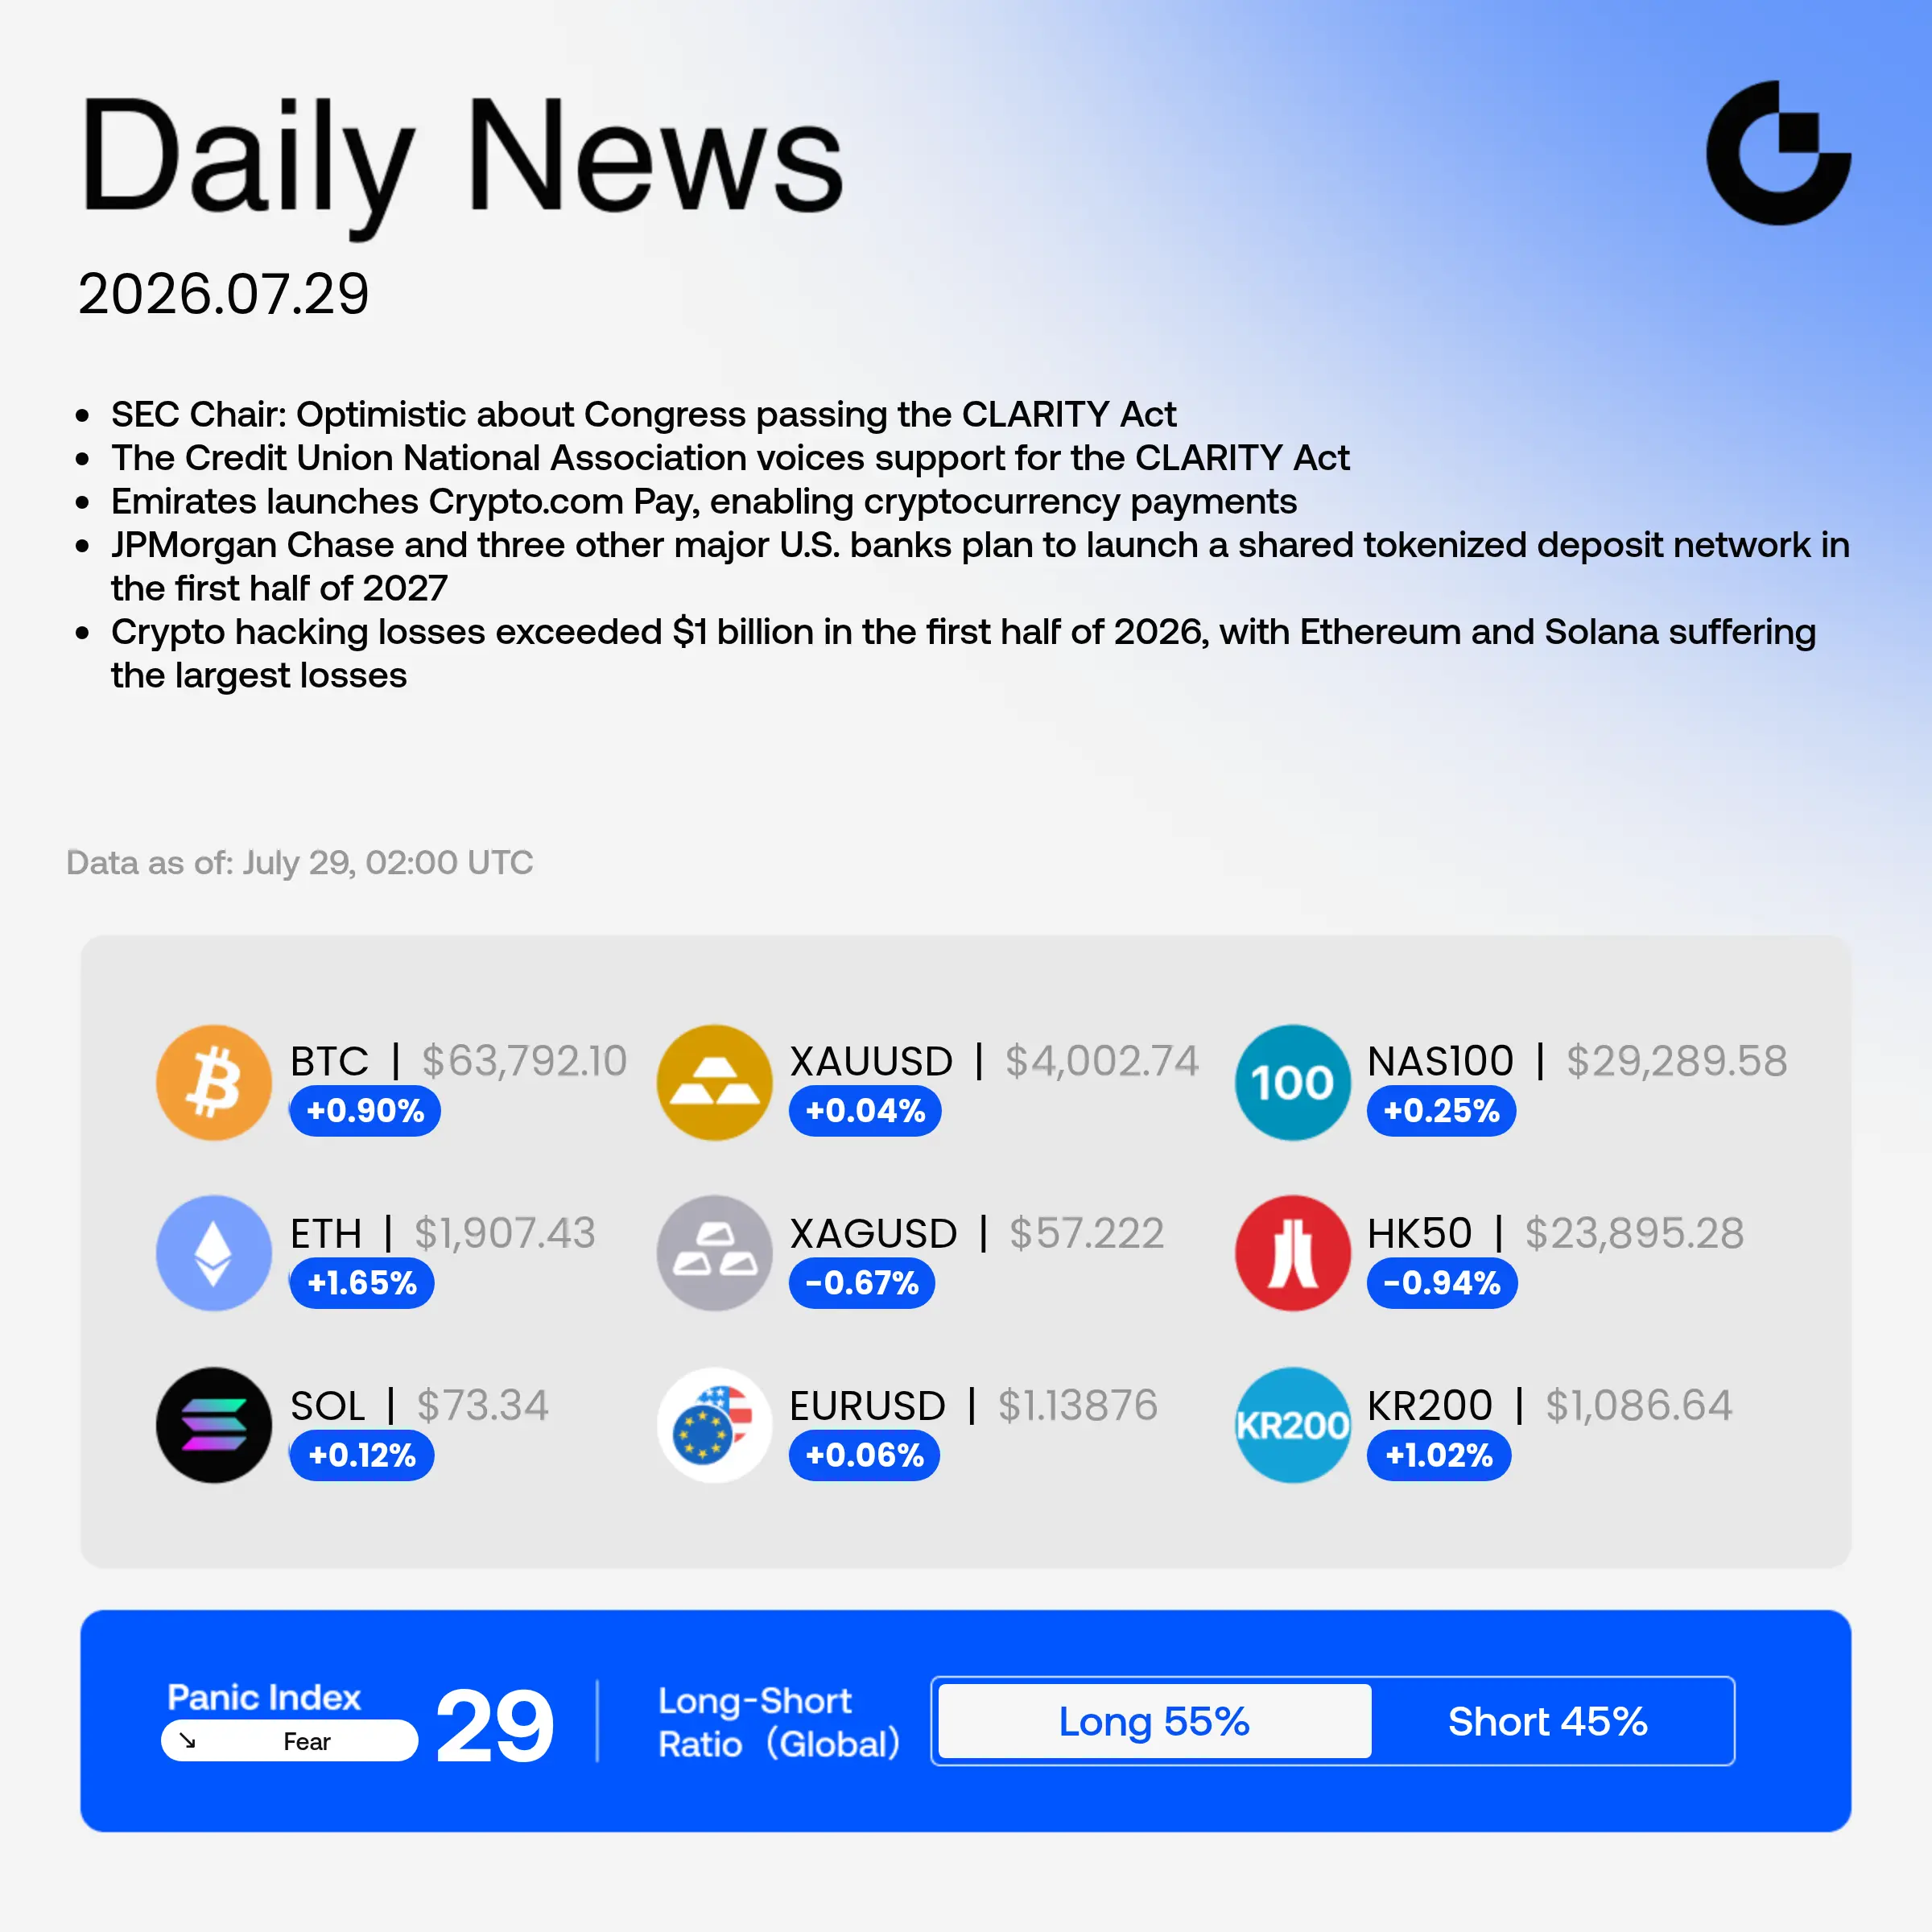
On July 22, the crypto market saw a explosive rally. After nearly a month, Bitcoin first reclaimed the $66k level, while Ethereum regained $1,900 and briefly touched $1,950. The core catalyst behind this rebound is Trump making a key concession on the ethics provisions in the “Clarity Act,” combined with Bitcoin spot ETF inflows staying net positive for 5 straight days and exceeding $700 million in total—together igniting bullish sentiment.
As of July 22, 2026, Bitcoin (BTC) is trad
BTC1.38%
ETH0.51%
XRP1.84%
SOL-0.02%
BNB-0.20%
View Original
post-image
  • Reward
  • 11
  • Repost
  • Share
HighAmbition:
good information 👍👍👍
View More
A crypto whale liquidated 1,862.3 ETH (avg $1,923) after five months, totaling about $3.58M with a ~$1.42M loss (−28%), having bought the same amount back in January at ~$2,685. $ETH
ETH0.51%
post-image
  • Reward
  • Comment
  • Repost
  • Share
JUST IN: S&P Dow Jones Indices and Pantera launch the S&P Pantera Digital Assets Index, targeting institutional allocation with a float-adjusted cap-weighted mix of 18 assets and real-world revenue. Could signal growing institutional demand for regulated crypto baskets. $SOL $...
SPX5.25%
SOL-0.02%
post-image
  • Reward
  • Comment
  • Repost
  • Share
#TrumpAgreesToClarityEthicsClause
Clear Rules Build Stronger Markets — Why Regulatory Clarity Matters for Crypto
The cryptocurrency industry has evolved from a niche innovation into a global financial ecosystem attracting retail investors, institutions, developers, and policymakers. As adoption continues to expand, discussions about regulatory clarity and ethical standards have become increasingly important. Market participants closely monitor policy developments because they can influence investor confidence, innovation, and long-term industry growth.
Regulatory clarity provides businesses a
BTC1.38%
post-image
  • Reward
  • 1
  • Repost
  • Share
HighAmbition:
坚定HODL💎
Load More

Join 40 M users in our growing community

⚡️ Join 40 M users in the crypto craze discussion
💬 Engage with your favorite top creators
👍 See what interests you
  • Pinned