Share your thoughts
placeholder
Article
#8月CPI数据出炉
U.S. Inflation Data Takes Center Stage
The latest U.S. August CPI report is out, and once again, inflation has become one of the most important catalysts for global financial markets.
The CPI report is closely watched because it provides one of the clearest snapshots of how quickly consumer prices are changing across the U.S. economy. More importantly for traders, the data can influence expectations surrounding Federal Reserve interest-rate policy, Treasury yields, the U.S. dollar, equities, and crypto assets.
📊 August Headline CPI: +0.4% MoM
📈 Annual Headline CPI: 3.4% YoY
📊 C
BTC-0.06%
ETH-0.02%
  • 2
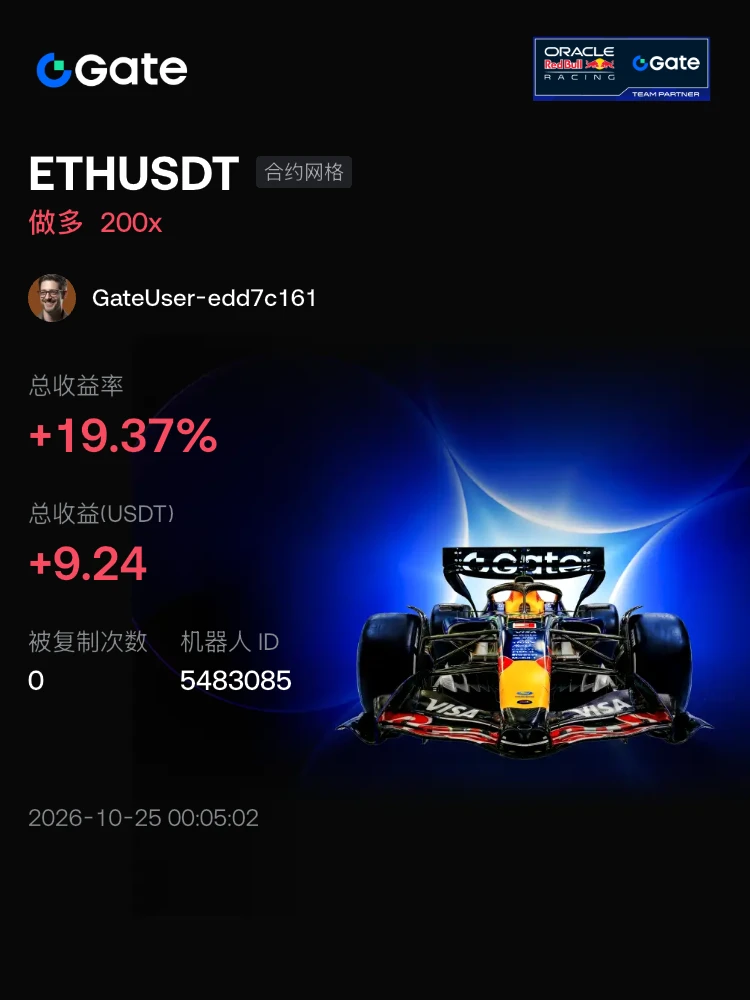
Deposited $300, and the account balance was $368.22 the next day.
#ZECPlungesOver13% ZEC Plunges Over 13% — What’s Behind the Sharp Drop?
Zcash (ZEC) has come under heavy selling pressure, with the token dropping more than 13% in a sharp market move. A decline of this size can quickly change market sentiment, especially after a period of strong volatility and elevated trader interest.
The first thing traders should focus on is risk management. A sudden 13%+ decline can trigger liquidations, stop-loss orders, and additional panic selling, creating a chain reaction where the price falls faster than expected.
🔻 Bearish Pressure Increasing
When a major cryptoc
post-image
ZEC+0.81%
BTC-0.06%
I was just about to shut down my computer and go to sleep when it suddenly started performing a nosedive, jolting me wide awake.

A few days ago, before bed, the rebound looked pretty fierce, but the trading volume clearly failed to keep up, and every surge was just short of breaking through. I went short directly around 1.3836, betting that this rebound was a bull trap—an unconvincing rally won't go far.

When I opened the chart this morning, wow, it gave me the answer right away. At 1.3665, the pullback was even more decisive than I expected, and +114.21% in unrealized profit was already s
post-image
LAB-14.06%
ZEC+0.81%
I really want to replace the MacBook Air M3 I have. The 13-inch screen is portable, but staring at it for a long time is honestly too small and doesn’t fit my macho persona.
But the 16-inch MacBook M5 is too expensive.
Are there any friends who could gift me one?
I’d be okay with 30 times.
post-image
I was just about to curse it out, but then I checked the account and thought, forget it—let it pump however it wants, I’ll keep quiet. While everyone was still watching from the sidelines, $HEMI 's HEMI consolidated at the bottom and buying pressure strengthened. I flagged the key level: as long as it didn’t break, wait for a pullback. Went long at 0.005583, now at 0.006724, +400.58%. Those already on board must be laughing in their sleep—this move was perfectly timed.

Panic comes from having no plan; losses come from overthinking. Hold as long as the trend remains intact, run when support b
post-image
HEMI-2.40%
SNDK-2.10%
LAB-14.06%
$ETH Signal】Long + 1H lower-band support/order-book depth imbalance
$ETH 2527 middle-band resistance; buy orders account for 67.09% of the order book, with a depth ratio of 5.08.
The 1H current price is 2518.42, near the lower band at 2512.5987, with RSI at 46.73; 4H RSI is 54.81, and the bullish MACD histogram at 2.0158 is contracting. The 1H bearish MACD histogram at -1.7107 is expanding. The 4H EMA20 at 2505.9108 provides support. Funding rate is 0.0091%, and OI is stable.
The risk-reward ratio for this trade is 1.50, with stop-loss room of approximately 0.7%, keeping the cost of testing t
post-image
ETH-0.02%
10-year government bond yields fall below 1.7% again, and the bond market is starting to heat up
A relatively clear signal has emerged again in the domestic bond market recently.
The 10-year government bond yield has returned below 1.7%, reaching around 1.69% at one point during the session. The market had previously been repeatedly battling around the 1.7% level, and the latest break below it indicates that demand for bonds is picking up again.
This level is worth noting.
Because when yields move lower, bond prices are essentially rising.
What this reflects is not just bond market sentiment,
post-image
GLDX+0.36%
PAXG+0.01%
  • 4
  • 1
Guys, can this coin be shorted?
post-image
##AIStockGuruReportedlyBullishOnAI is highlighting the growing confidence surrounding artificial intelligence and its expanding role across global markets. AI continues to attract attention as businesses invest in automation, advanced computing, cloud infrastructure, semiconductors, and next-generation technologies. This bullish outlook reflects expectations that AI could remain a major long-term growth theme, while investors closely watch innovation, earnings, adoption, and valuations. The sector also carries risks, including high expectations, competition, and market volatility, so careful r
post-image
OpenAI, who was this distilled from?....First bell😂
post-image
Technical Tutorial
Lesson 2 — Candlestick Patterns
Certain candlestick combinations can tell you whether buyers or sellers currently have the upper hand.
Bullish patterns may indicate that buying pressure is strengthening and prices may rise.
Bearish patterns may indicate that selling pressure is strengthening and prices may fall.
For example:
- A bullish engulfing pattern means buyers have regained control.
- A hammer means sellers drove the price down, but buyers stepped in and pushed it back up.
- A shooting star means buyers pushed the price higher, but sellers drove it back to its origina
#USMajorIndexesTurnHigher
US MAJOR INDEXES TURN HIGHER: WHAT IS THE MARKET REALLY PRICING?
The latest U.S. inflation data may look relatively calm on the surface, but the details underneath are telling a more complicated story.
Inflation is no longer rising broadly across the economy. Instead, the remaining pressure is concentrated in areas such as services, shelter, healthcare, insurance and other wage-sensitive categories. These components tend to decline slowly because they are closely connected to labor costs and household spending.
Energy is another important risk. Geopolitical tensions
post-image
CryptoChampion
#USMajorIndexesTurnHigher
US MAJOR INDEXES TURN HIGHER: WHAT IS THE MARKET REALLY PRICING?
The latest U.S. inflation data may look relatively calm on the surface, but the details underneath are telling a more complicated story.
Inflation is no longer rising broadly across the economy. Instead, the remaining pressure is concentrated in areas such as services, shelter, healthcare, insurance and other wage-sensitive categories. These components tend to decline slowly because they are closely connected to labor costs and household spending.
Energy is another important risk. Geopolitical tensions and supply disruptions can quickly push energy prices higher, creating renewed pressure on headline inflation and consumer expectations.
This explains why the Federal Reserve is unlikely to rush into aggressive easing. A single encouraging inflation report is not enough to guarantee a rapid rate-cut cycle. Policymakers need to see consistent progress before changing direction.
For markets, this means the path toward lower rates could be slower and more gradual than investors previously expected.
Yet U.S. equities are showing resilience.
Investors appear to be becoming more selective, favoring companies with strong cash flow, pricing power, solid balance sheets and sustainable demand. Highly leveraged businesses or companies dependent on distant future growth may remain more sensitive to elevated rates.
For crypto, the environment remains more challenging. Higher rates can limit risk appetite and make leverage especially dangerous during volatile sessions. At the same time, reduced macro uncertainty could eventually create opportunities for patient spot investors.
Three themes stand out to me:
Real utility: Projects generating fees, users and genuine economic activity.
Defensive diversification: Exposure to real-world assets and diversified instruments can help manage volatility.
Risk discipline: Staged entries, staged exits and controlled position sizes remain essential.
The bigger message is simple: inflation has not disappeared — it has changed form.
In this environment, patience may outperform aggression. The market may reward assets backed by real value rather than temporary narratives.
#weeklyshare #每周来晒 #8月CPI数据出炉 #ShareWeekly
repost-content-media
  • 5
13th sep market updates
live-cover
LIVE1,296
The hardest part of a profitable trade is exiting. $BTC I also reduced this short position as I held it, entering around 77609.7 after seeing resistance at the highs and no breakout above the previous high.
During the holding period, there was a pullback confirmation as well as a few brief wicks, but I managed the position only based on the protection level and did not let short-term volatility change the direction. As long as the trend remains intact, I’ll continue holding the short.
At 77258.4, I’m taking a 80/20 approach to the +78.67% gain: locking in 80% first, while using the remaining 2
post-image
BTC-0.07%
XRP-0.04%
SNDK-2.10%
one bitcoin can buy 60 iphone
live-cover
LIVE1,837
$ETH Signal】Set a long on a 1H pullback
$ETH The 1H price is below EMA20_1H 2522.98, with Bollinger Bands at 2540.48/2511.74 narrowing. The 4H MACD bullish histogram is shrinking, while the 1H MACD bearish histogram is also shrinking. Order book depth imbalance is -79.73%, bid/ask is 0.11, and a sell-pressure wall is suppressing the rebound. Funding rate is 0.0097%, and OI is stable. 1H RSI is 49.46, and 4H RSI is 55.61. The zone below 2511.74 is suitable for catching a wick; place long orders at 2514.035-2521.600. Chasing the rise offers an uncomfortable risk-reward ratio, while catching t
post-image
ETH-0.02%
BTC-0.06%
SOL-0.40%
Enjoying half a day's leisure.
Come to Chongqing, and I'll treat you to hot pot.
A few days ago, people in the group said $FXN had broken above 30, so I took a quick look—and it really had.
I clicked in again and checked the Locker: 562,232 FXN are locked, accounting for 79.51% of the circulating supply, with an average lock period of 3.46 years and an APR of 21.11%.
This week's veFXN revenue is currently 0.16 wstETH, compared with 15.08 last week. But this week isn't over yet; it will accumulate through September 16, so let's leave it for now and see once it settles.
fxUSD is currently 83.36
post-image
Everyone is missing the real move forming in $SLX /USDT right now.

$SLX /USDT - SHORT

Trade Plan:
Entry: 0.06730 – 0.06758
SL: 0.06881
TP1: 0.06641
TP2: 0.06573
TP3: 0.06470

Why this setup?
Why now? The daily trend is range, but the 1h ATR of 0.000571 shows enough volatility to fuel a sharp leg. The 15m RSI sits at 37.89, confirming bearish momentum without being overextended. The entry zone around 0.06744 aligns perfectly with the 1h price, giving a precise trigger. A move to TP1 at 0.06641 captures the first target, while TP2 at 0.06573 extends the reward. The invalidation level of 0.0
post-image
SLX-1.26%
Load More

Join 40 M users in our growing community

⚡️ Join 40 M users in the crypto craze discussion

💬 Engage with your favorite top creators

👍 See what interests you