Square
Following
Hot
News
Notifications
Profile
Share your thoughts
placeholder
Article
$MAGMA I caused this -17.67% bearish candle. Stop guessing—the market maker’s playbook has just four steps: pump, distribute, dump, buy back. During that 24h high of 0.3464, I placed sell orders worth over 30 million above 0.34. Retail FOMO buyers rushed in to catch the falling knife, and trading volume instantly hit 26.3M—if you want the details, I sold 70% of my position during that 80,000-point drop from 0.3464 to 0.2640, leaving the remaining 30% with bids around 0.28 to create the “illusion of support.” The price is now 0.2816, just a small push away from my next accumulation zone of 0.24
MAGMA-0.57%
Compared with the dot-com bubble, the Nasdaq has only climbed 2.2x during this AI boom, versus 4.2x over the same period in 1999. This time around, things are much less frenzied, and the valuation gap is actually much smaller. So don’t force the bubble narrative—slower gains don’t mean there’s no upside. Can $BTC hit $120,000? We’ll know by the end of the month. If you’re watching, follow along.
post-image
NAS100-0.07%
BTC-0.67%
Trenches
ZIG
Z
bade
b
ZIG
0x8c...1145
Market Cap
$.
Change
.
24h Vol
$.
Holders
.
BTC
B
bade
b
BTC
C5xp...pump
Market Cap
$.
Change
.
24h Vol
$.
Holders
.
Diamond
D
bade
b
Diamond
5VCE...pump
Market Cap
$.
Change
.
24h Vol
$.
Holders
.
DOGE
D
bade
b
DOGE
DoGE...fm7R
Market Cap
$.
Change
.
24h Vol
$.
Holders
.
STONK
S
bade
b
STONK
6GmA...UNgx
Market Cap
$.
Change
.
24h Vol
$.
Holders
.
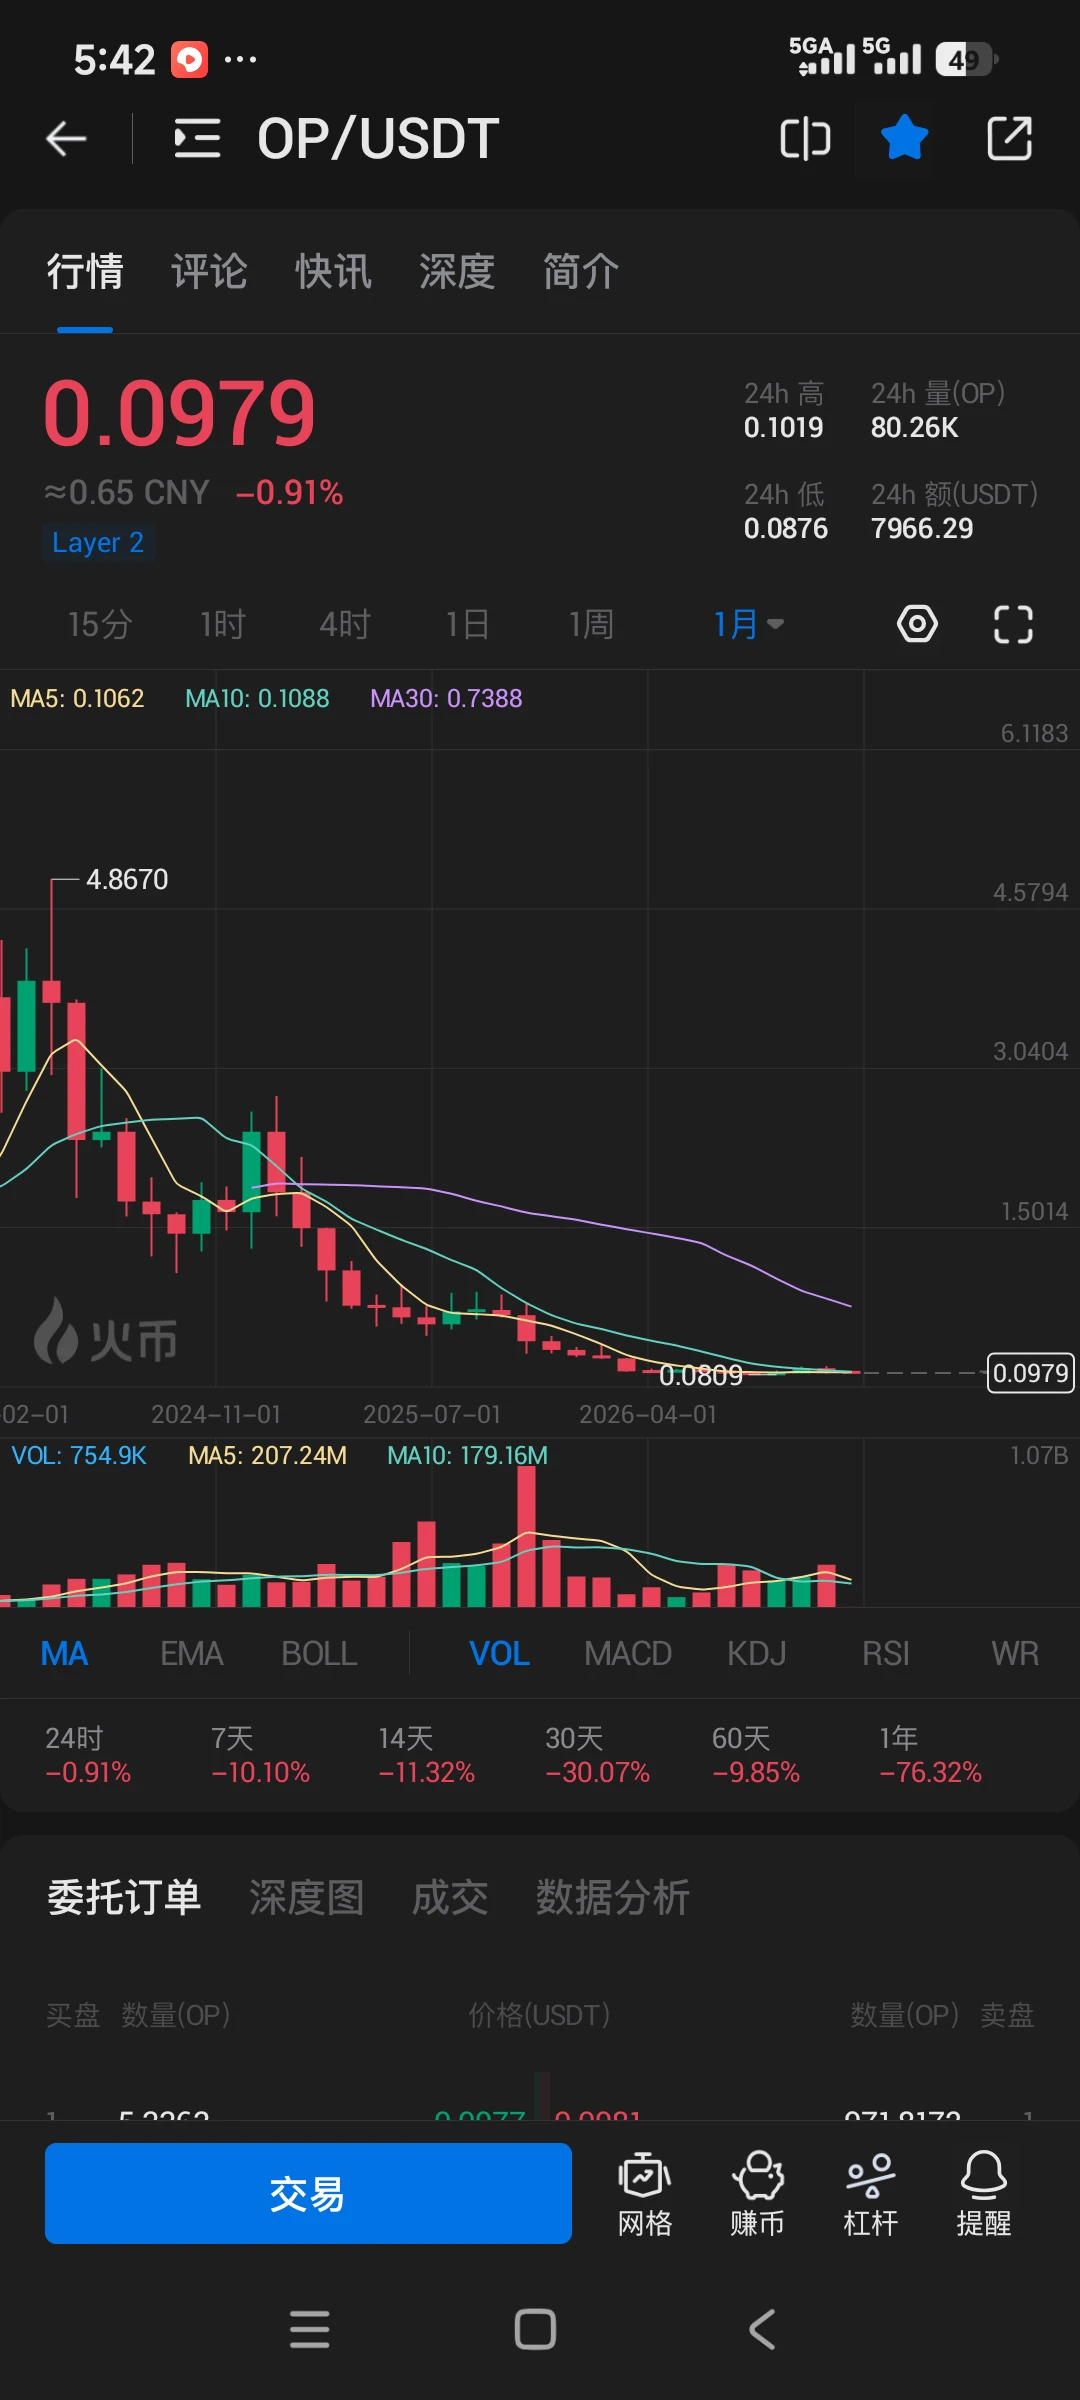
$OP Other platforms have all surpassed 0.1
post-image
OP-1.33%
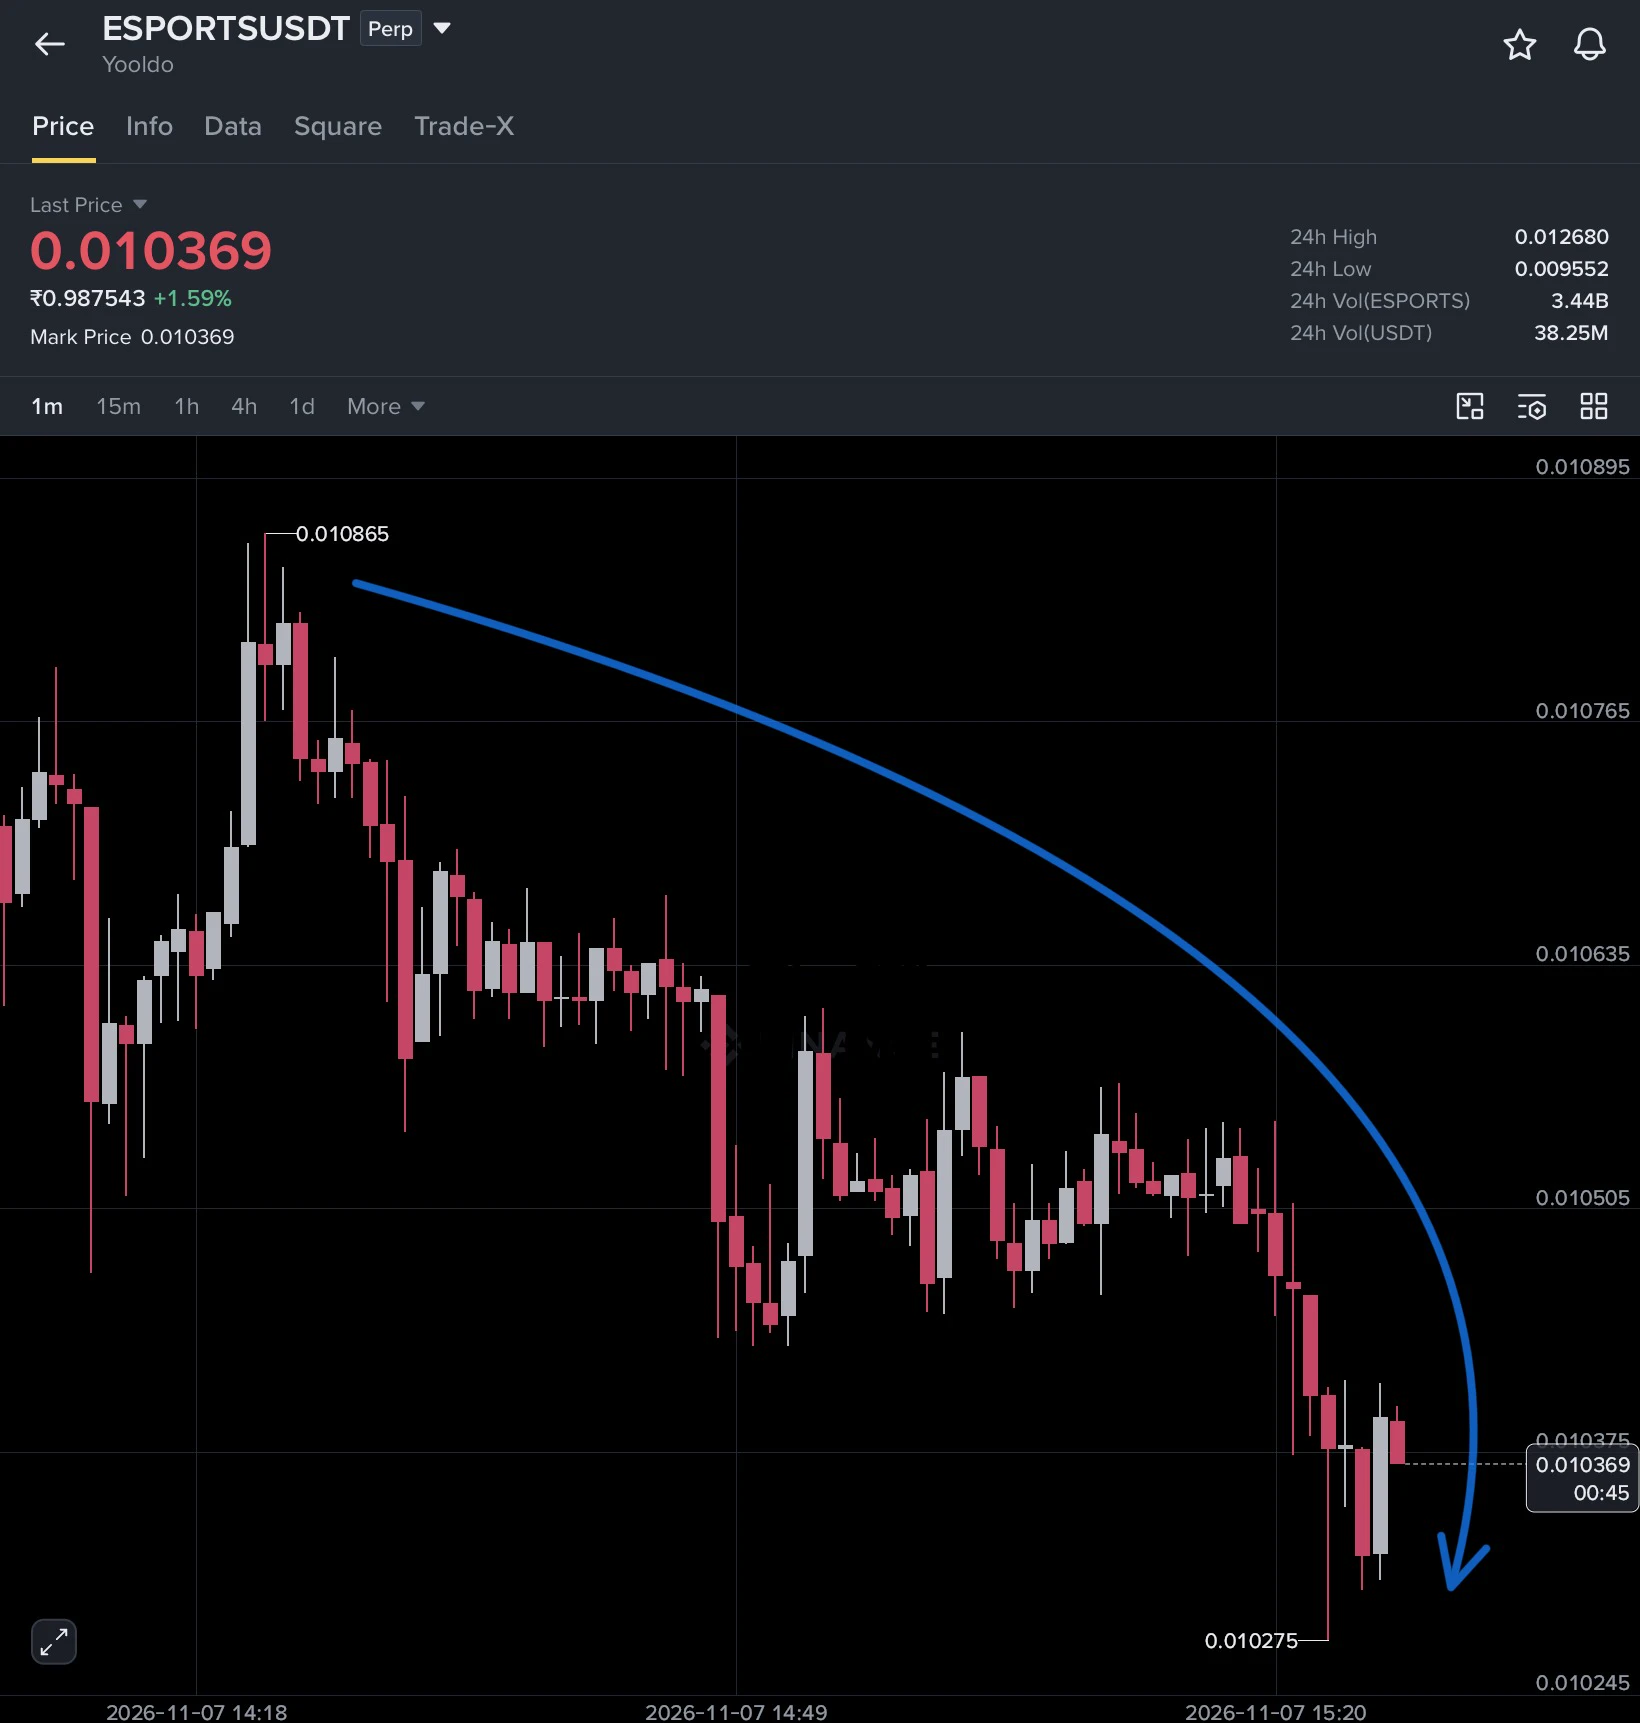
$ESPORTS First Target 🎯
post-image
CryptoSat
Esports Trading Signal

Don't miss big profits
ESPORTS-4.77%
Looks like it’ll keep trading sideways for another day tomorrow; just do your usual thing over the weekend
post-image
CRYPTO MARKET BEST BUYING
live-cover
LIVE2,036
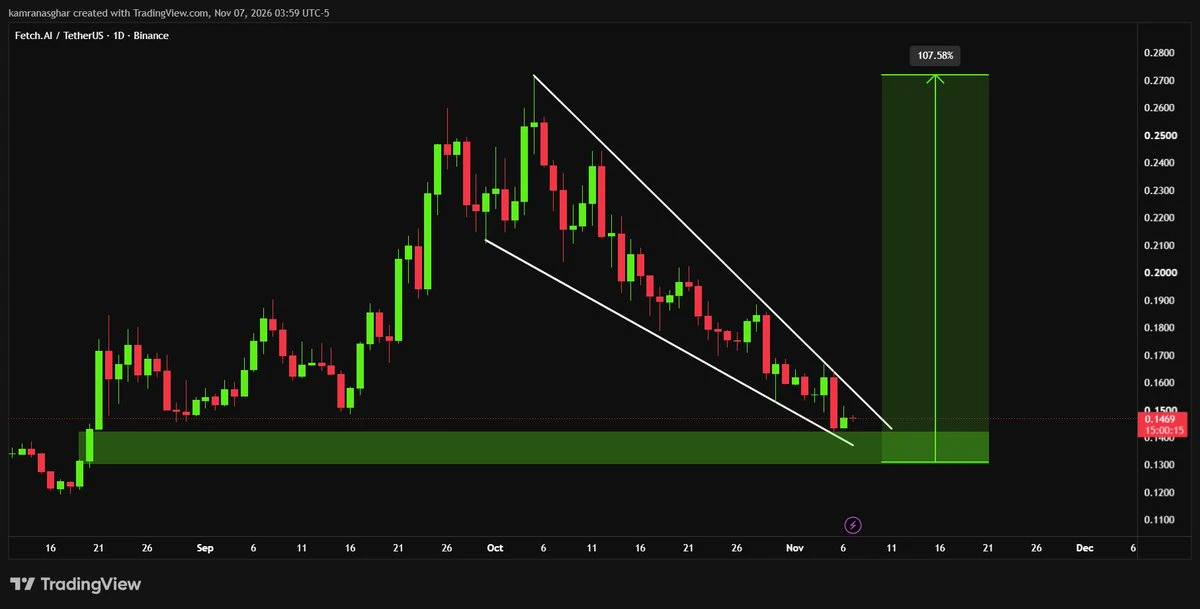
$FET holding primary demand with high structure confluence.
Falling wedge breakout loading up for a strong impulsive drive.
post-image
FET-1.52%
When trading BTC, many people see a long upper wick on a candlestick chart and assume the market is about to fall. But does a long upper wick really mean a trend reversal?
Actually, not necessarily.
A long upper wick usually indicates that the price encountered selling pressure while rising. Buyers tried to push the price higher, but sellers stepped in at higher levels, and the price eventually pulled back from its high.
When assessing a long upper wick, focus on three aspects.
First, its location. If a long upper wick appears near an important previous resistance level, it may indicate strong
post-image
BTC-0.67%
How do you use highly saturated colors to create a really oppressive painting😟
post-image
BTC has been moving sideways for three days, with the price fluctuating within a range. Many traders are starting to feel anxious: should they go long or short?
In fact, the most common mistake in a sideways market is trying to predict the direction of a breakout in advance.
To assess a breakout, pay close attention to three signals.
First, trading volume. If volume continues to increase as the price approaches the top of the range, it suggests market participation is rising. But increased volume alone does not guarantee a move higher; you also need to see whether the price can hold above the
BTC-0.67%
“ I Split My Money Into Three Accounts, and I’ve Never Been Liquidated Since” I used to have just one account, with all my money in it. It felt like walking a tightrope: a small loss made me panic, and a bigger loss made me want to add money to win it back. In the end, even my living expenses went in. Later, I split it into three accounts.

1. Principal account (70%): Only long-term money that I won’t touch goes here. Buy spot and trade on longer timeframes; no futures. This account has one job: whatever happens, it has to stay intact. Don’t buy more when prices fall or chase when they rise. C
post-image
BTC-0.65%
ETH-1.23%
“Smart Money Influencer Weekly Review” Episode 14 · Gold Empire: 8 Trades in 15 Days, Over 50% Win Rate, Netting Around RMB 400

Keep losing money on your own trades? It’s not because you’re not trying hard enough—you just need a reliable reference. Every week, we review well-known influencers across the web, letting real results and data speak for themselves.

This trader posted 8 signals in half a month, and 7 trades were executed. 4 hit the first target, 2 were stopped out, and 1 exited at breakeven. With a win rate over 50% and a maximum loss of RMB 1,000 per trade, he netted around RMB 40
AMD+11.55%
#ShareWeekly #SEC #CFTC #WCTCS9

The U.S. crypto regulatory landscape is entering an important phase. Instead of focusing on one major piece of legislation, regulators are advancing on multiple fronts. The Securities and Exchange Commission (SEC) is working toward clearer broker-dealer requirements for crypto-related activities, while the Commodity Futures Trading Commission (CFTC) is developing a regulatory framework for prediction markets and event-based contracts.

Both developments could reshape how digital assets and related financial products are traded in the United States. However, th
BTC-0.67%
ETH-1.26%
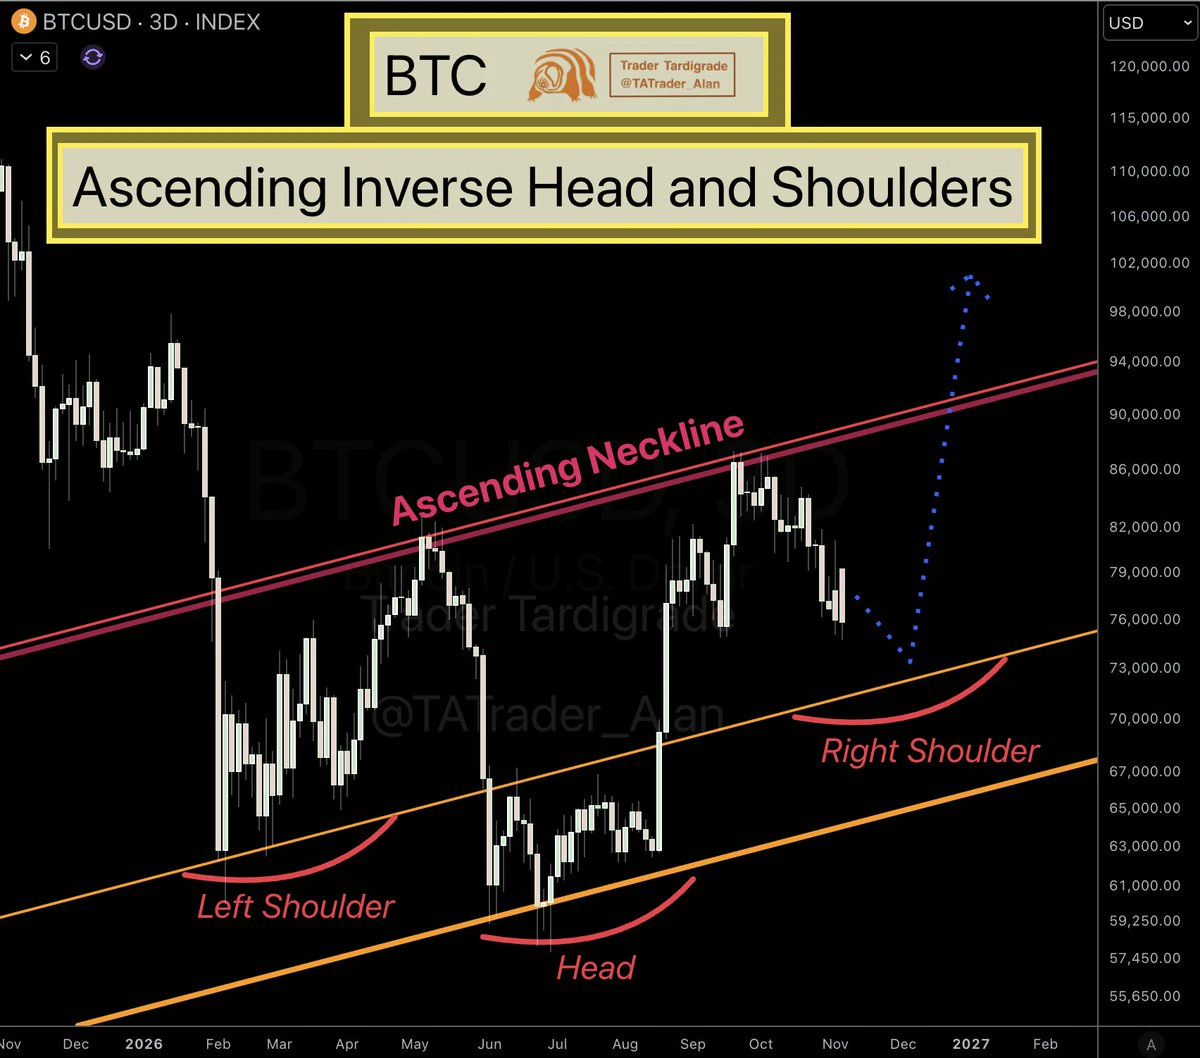
$BTC appears to be forming an Ascending Inverse Head and Shoulders.
🚨 Note: the development of the Right Shoulder is still ongoing. The low could come down near $73k, around the upper orange line.
✍️ An Ascending Inverse Head and Shoulders is a variation of the classic Inverse Head and Shoulders pattern in technical analysis. It is a bullish reversal signal that typically appears at the end of a downtrend and suggests the market may shift from bearish to bullish.
post-image
BTC-0.67%
☀️ GM! The market suddenly hit the brakes—what signal will tonight’s nonfarm report flash? 🚦
The Nasdaq plunged 5.52% last night, while BTC pulled back to around $76K . The U.S. nonfarm payrolls report is due out tonight at 21:30. 👀

📌 Today’s featured topic: How will you adjust your trading strategy ahead of the nonfarm report?
🔴 Risk watch: Will U.S. stocks and BTC remain under pressure?
🟡 Waiting for confirmation: What changes could the nonfarm report bring?
🟢 Looking for opportunities: Are there any assets worth watching in this pullback?

🎁 Come share your nonfarm predictions and t
NDAQ+0.28%
BTC-0.67%
  • 6
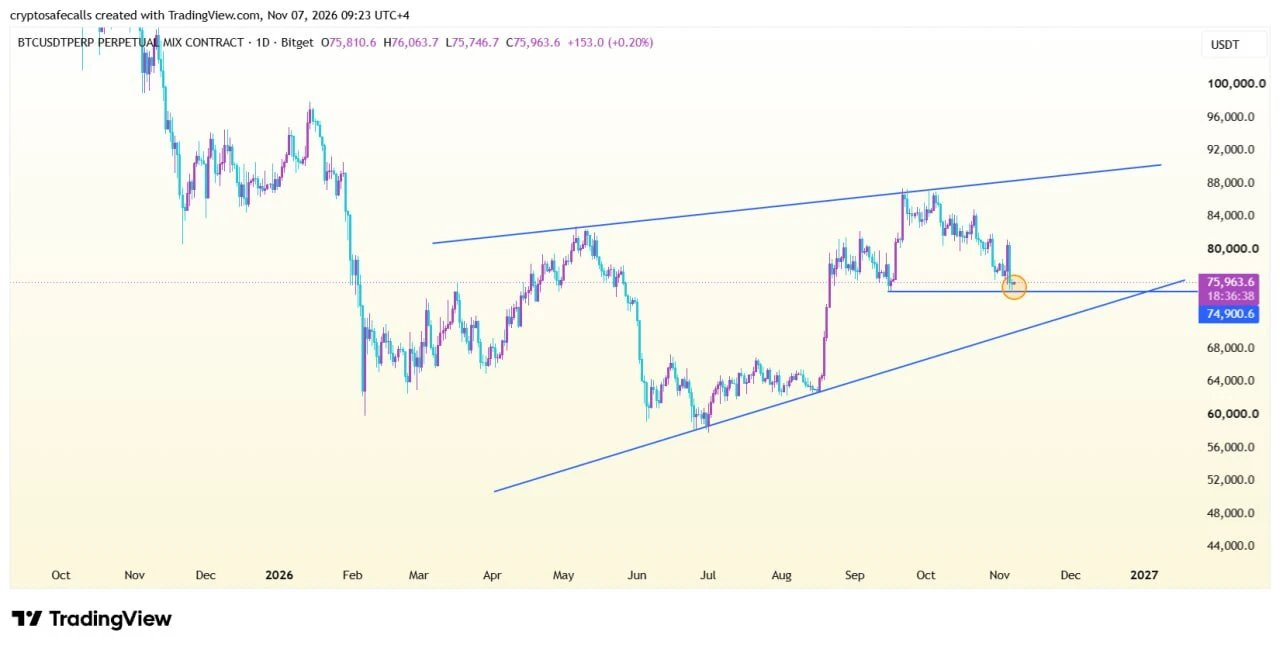
💰$BTC /USDT | 1D Update 🕯

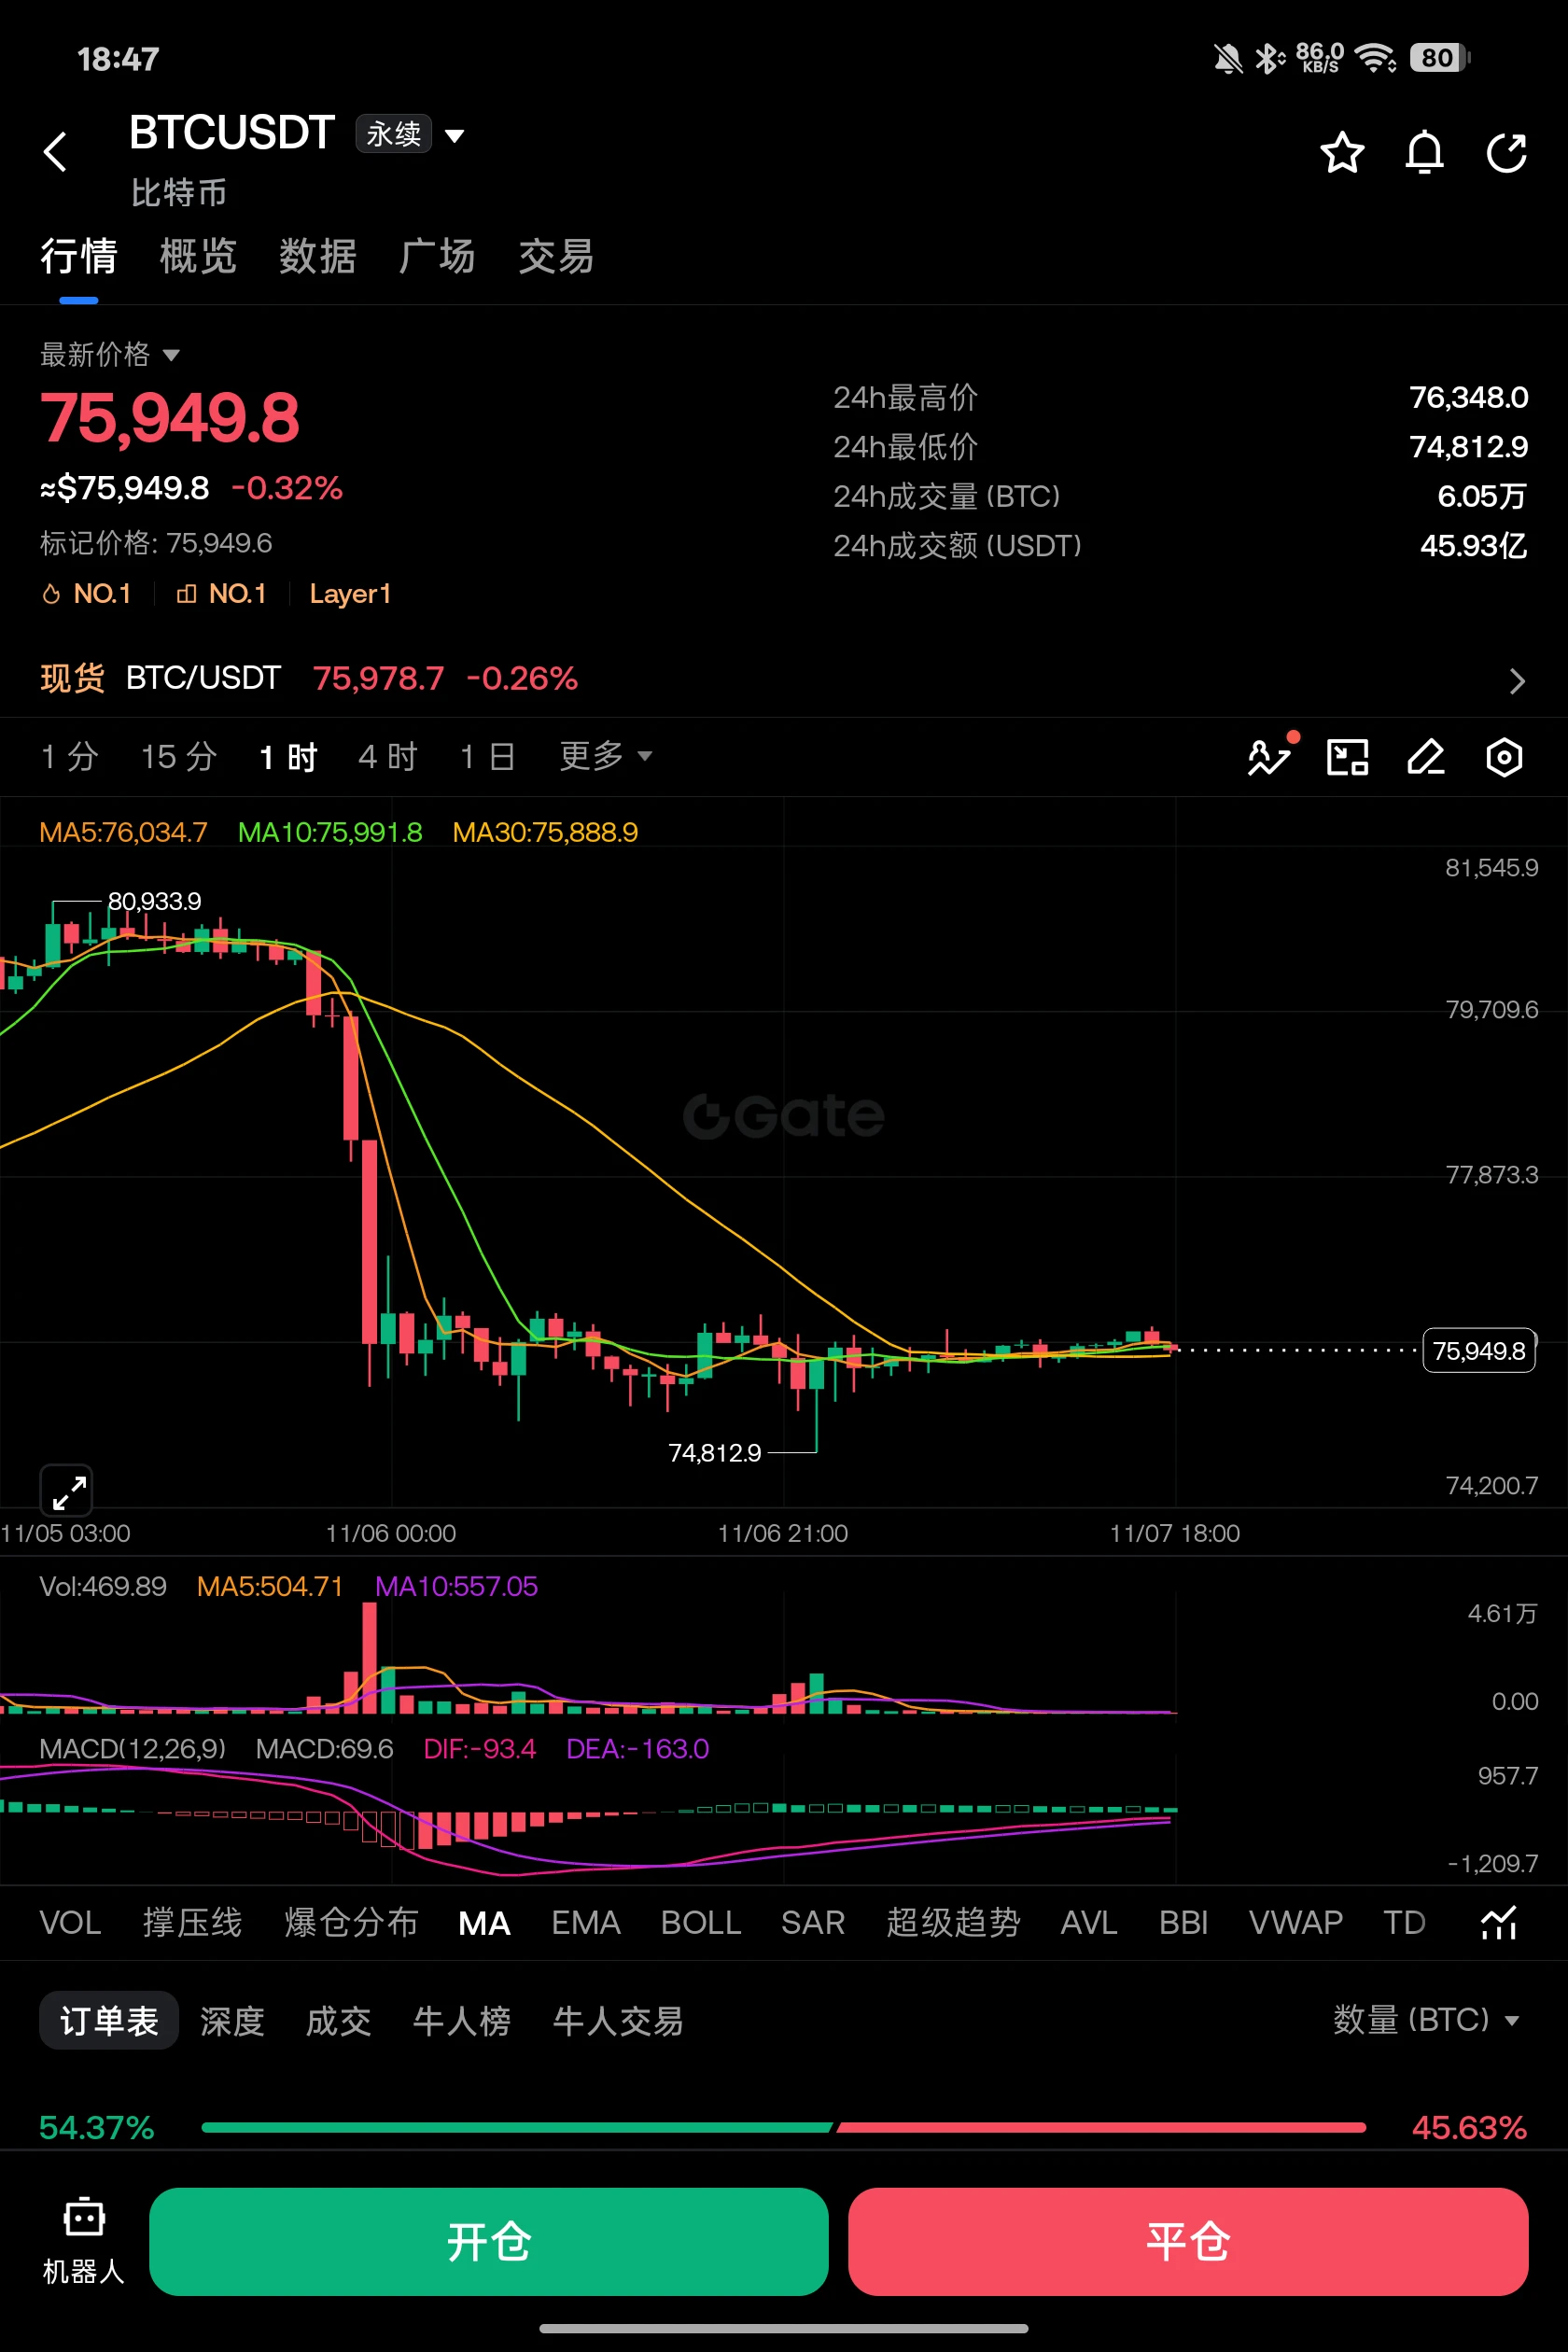
BTC is holding just above $74.9K. A daily close below could trigger a major dump toward the lower trendline support.📉

📌 Wait for daily close confirmation!

$ONE $ZEC $IDOL $AKE #ShareWeekly #AITechSelloffPutsCryptoUnderPressure
post-image
BTC-0.65%
ONE-1.38%
ZEC+1.29%
IDOL-7.01%
AKE+6.39%
$DOT At the current price of 0.9008, my long position is down 3.2%. I accept this pullback. The 24h low of 0.8974 is right below us, and trading volume has shrunk sharply to 23.8M. The panic selling has basically been cleared out. My plan: add to my long in the 0.895–0.900 range, bring my position up to 50%, and set a stop-loss below 0.882. If it breaks the previous low, I’ll admit I’m wrong and exit; my first take-profit target is 0.935, and the second is near the previous high of 0.948. I see two possible scenarios: first, 0.897 holds and price consolidates on declining volume; an hourly bul
DOT-1.51%
$AKE Stop making me empty promises—I’ve already bought Bitcoin myself.
post-image
AKE+6.07%
  • 3
#BTCETFOutflowsContinue
#BTCETF资金持续流出
Bitcoin ETF Outflows Continue: Potential Impact on BTC Price, Market Outlook, and Key Strategies for Investors
The cryptocurrency market is once again facing uncertainty as Bitcoin Spot ETFs continue to experience capital outflows. This trend has attracted the attention of traders, institutional investors, and long-term Bitcoin holders. Continuous ETF outflows may indicate that some investors are becoming cautious amid changing market conditions.
The biggest questions are: How could continued ETF outflows affect Bitcoin's price? Could BTC face further do
BTC-0.31%
ETH UPDATES
live-cover
LIVE1,901
Load More

Join 40 M users in our growing community

⚡️ Join 40 M users in the crypto craze discussion

💬 Engage with your favorite top creators

👍 See what interests you

Trending Topics

USAIStocksHitHard

17.41k Views3.65k Discussing

U.S. stocks sold off sharply on Thursday, November 5 (UTC). The Nasdaq closed down around 5.5%, entering correction territory, while the Philadelphia Semiconductor Index plunged roughly 12%, with chip stocks including $NVDA and $AMD posting steep losses. Beyond profit-taking, investors are growing concerned about the pace of AI data center construction, capital spending, and future returns on investment. The key question now is whether the AI sector’s lofty growth expectations need to be repriced. Where do you think the next opportunities will emerge: chip stocks, tech giants, or other sectors?

USNonfarmPayrolls

26.04k Views4.28k Discussing

StakeOnLaunchpoolToShare450KVLX

4.29k Views789 Discussing

View More