

Square
Following
Hot
News
Profile
Share your thoughts
placeholder
Article
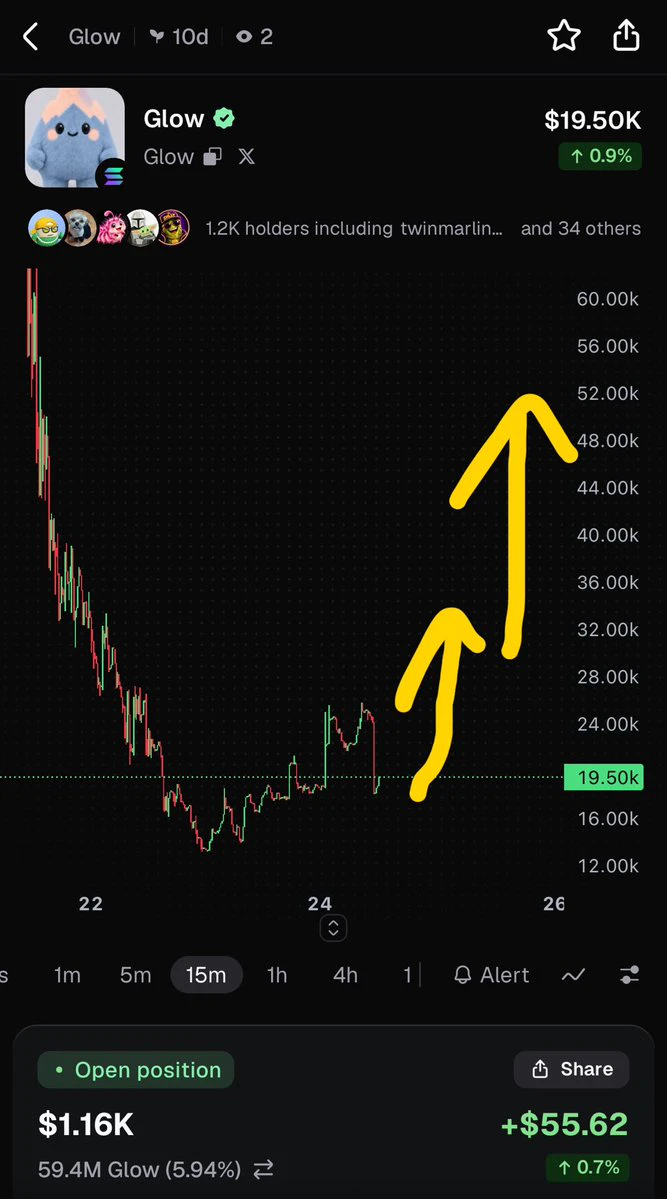
The stonk token’s single-day burn has reached a recent low of 84k U; let’s be a bit more pessimistic
Assuming tokens worth 50k U are burned every day, based on the current data, with market capitalization unchanged, how much would the token increase each month and each year
The answers are 1.3% and 17%, respectively
STONK+7.15%
  • 1
October 11, a day of mourning for the crypto market’s historic liquidation—surviving old-timers, please burn some incense?
The trigger was the tariff backdrop: Trump floated the idea of imposing an additional 100% tariff on China, while market leverage was already at a historical high. Market makers collectively pulled their orders, liquidity instantly vanished, and a cascade of liquidations was triggered.
Bitcoin quickly wicked down from around $122,000 to a low of approximately $102,000 within half an hour, with a maximum drawdown approaching 20% and a single-day decline of more than 13%. Et
post-image
BTC+0.18%
ETH+0.17%
GM if you GM!
post-image
sunday special market predection
live-cover
LIVE3,034
Gatio New Spin Event live Trade Gold & Silver Futures
https://www.gate.com/campaigns/6565?ch=8404&ref=AwJMUlgN&ref_type=132
Complete 2k Future Volume Unlock Spin
Draw, Unlock Reward XAUT & SLVON
#GateAtTOKEN2049 #EthereumUpOver71%inQ3 #CRCLLeadsCryptoStocks #BTCPullsBackTo81000
post-image
XAU+0.03%
XAG-0.13%
XAUT0.00%
SLVON+0.56%
#BTCPullsBackTo81000
BTC tagged $81,000, bounced to $82,000, and the 24h drop has narrowed to about 1.5%. “Bulls and bears are battling” is true but useless, so here is what the daily chart actually says.
1. Why 81,000 matters
It’s not just a round number. On my daily chart it sits right on the 50-day MA (~80,950) and just under the 81,868 support line I’ve marked. That’s a confluence zone, which is why the bounce happened where it did.
2. The distance map (from ~82,000)
Up to 86,589 resistance: about +5.6%
Down to the 50-day at 80,950: about -1.3%
Below that, the next structural levels on my
BTC+0.18%
The broader market moved sideways all day yesterday, and today is expected to be the same. A major move will likely have to wait until tonight. In any case, the longer the bottom consolidates sideways, the higher the probability of a move up. Bitcoin’s daily candle needs to close above 84000 for this daily-level pullback to end. The first major target above is around 87000. If it fails to close above 84000, beware of a retest of the previous low. If there is an opportunity to move lower, longs can still be entered with a small position!
$BTC Today, go short with a small position on a rebound t
BTC+0.18%
ETH+0.17%
BNB-0.37%
SOL-0.49%
I won’t go back and translate my previous trades and analyses. From now on, I’ll gradually share how I view the market each day, what I plan to do, and the things I’m working on.
I currently work as an R&D engineer at a major tech company. Recently, I’ve been turning my trading methods and habits into practical tools. There are mainly three:
Fibonacci Level Bot
I’ve repeatedly fine-tuned the methods for measuring moves and selecting ranges that I developed over the past year through an Agent. Its output is generally consistent with the levels I draw manually. It supports range adaptation for d
BTC+0.18%
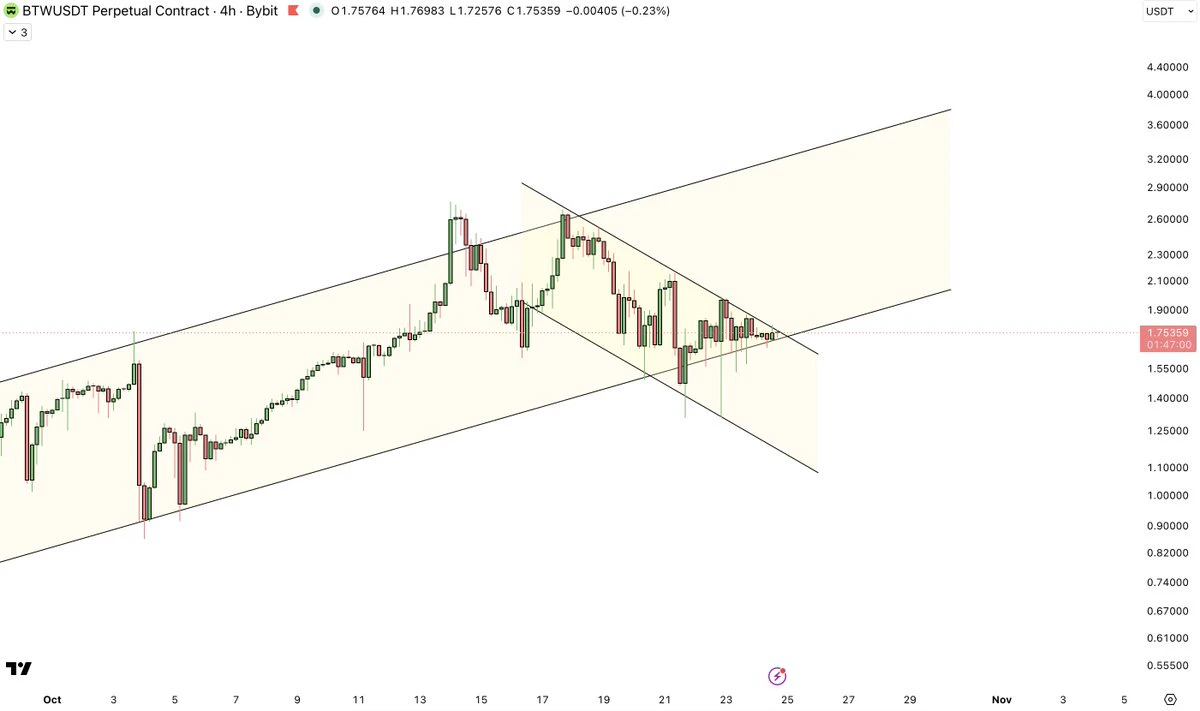
2026-10-11 08:48 UTC. Current chart structure. High probability of mean reversion: BTW/USDT, RLC/USDT, BTC/USDT. Stay alert to price interaction with the defined SHORT and LONG zones at range extremes prior to confirmation.
post-image
BTW-2.13%
RLC+6.82%
BTC+0.18%
Long on $ONE here ⬆️
post-image
$BTW The whale hasn't taken profit on everything yet—the old script is about to play out again, bros
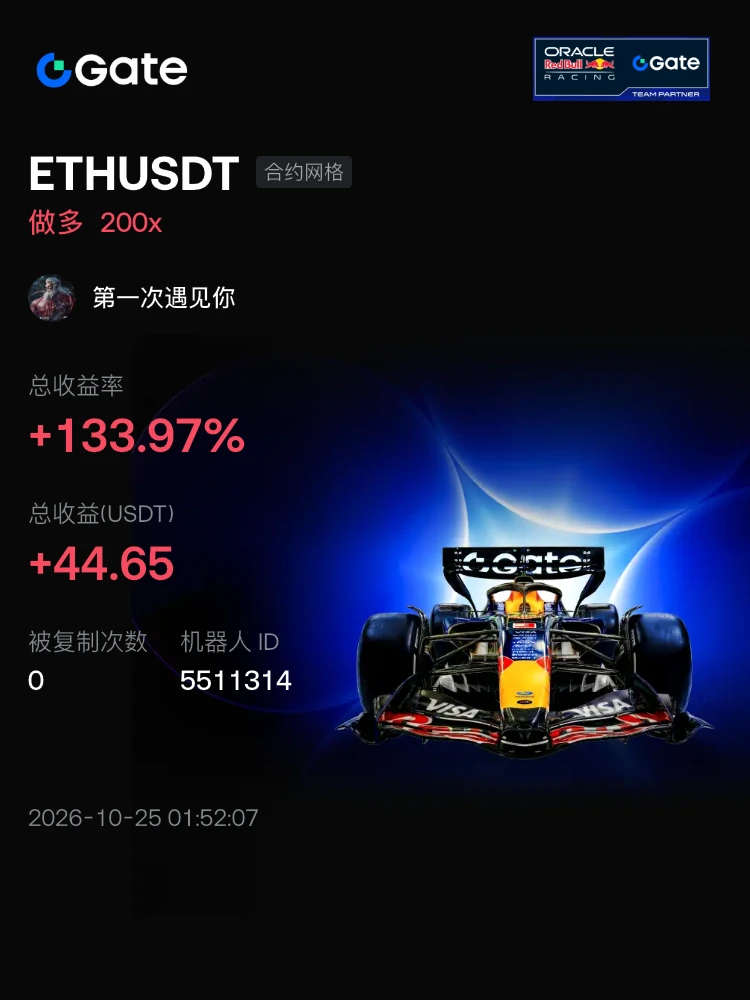
Now go long 🔥🔥Tp1: 1.55Tp2: 1.75Tp3: 2.05Sl: 1.05$B $CAP
post-image
BTW-2.13%
CAP+7.92%
$LUMIA Around 0.16, you can get in; seeing 2.1, it still needs to keep moving up. ‌
post-image
LUMIA+47.53%
Bitcoin daily chart: A bullish candle with a long upper wick ended the four-day losing streak.
4-hour chart: The recovery from the secondary low is not over yet, but weekend liquidity is thin, so it is ranging here—don’t complain that it is moving slowly.
Focus on 82800. The support-resistance flip has been completed at this level; now we just need to see whether it can break through and establish support.
As long as it can successfully hold, going long remains our priority. $BTC #Ledger事件损失近9000万
post-image
BTC+0.20%
Open a large long for $XAG
! 🚀Entry range: 60.54 - 60.84Target 1: 63.63Target 2: 65.98Stop-loss: 58.72The price has reclaimed the 15-minute MA99 and MA25 moving average cluster and held the 60.74 support level, indicating that the short-term trend has turned bullish. The 15-minute RSI(6) reached 81.93, showing strong momentum. This setup is expected to extend the upward move and challenge the intraday high of 60.93. Click here to trade 👇👇👇Market watch: $NEAR : Current price 5.228 - 24-hour change: +0.77%$CFX : Current price 0.06903 - 24-hour change: +35.33%
post-image
XAG-0.13%
CFX+34.96%
market update on gate
live-cover
LIVE30
Still shaken!
After attending Token2049, my trip flying from Singapore back to Chengdu turned out to be unexpectedly tortuous, and budget airline Thai Lion Air taught me a harsh lesson
First, when I was checking in at the airport, my original suitcase got stuck with a Thai Lion Air trainee clerk, who said I had to pay an additional 260 SGD to check it in. I thought I could accept paying a few dozen SGD, but paying that much would be no better than buying a new ticket, so I had no choice but to abandon the suitcase
Fortunately, the MSX small carry-on suitcase that @HarlanMix Haolan had given me
$CFX is currently experiencing a powerful bullish trend! The bulls have taken full control, with the price surging over 37% and breaking above $0.0700.
The next major surge could target $0.0750. Watch closely and avoid blindly chasing the rally. Entry price: $0.06750 – $0.06900 Target price: $0.07150 / $0.07350 / $0.07500 Stop-loss price: $0.06550
post-image
CFX+34.96%
$QNT enters the oversold zone; a rebound and a bottom are two different things
Over the past $QNT 24 hours, -5.13%, with the current price at 236.51. The 1-hour and 4-hour RSI are 27 and 48, respectively. Oversold conditions create demand for a rebound, but a rebound only indicates that the drop was sharp; forming a bottom still requires the price to stop breaking down structurally.
Set emotions aside for now; the structure gives very specific information. The 1-hour EMA20 is at 239.7294 and currently weak; the 4-hour EMA20 is at 242.911 and currently weak. Shorter timeframes expose changes, w
post-image
QNT-4.31%
The whereabouts of the Imperial Seal of China have become an eternal mystery
post-image
Load More

Join 40 M users in our growing community

⚡️ Join 40 M users in the crypto craze discussion

💬 Engage with your favorite top creators

👍 See what interests you

Trending Topics

GateAtTOKEN2049

40.76k Views21.69k Discussing

Gate brought a series of major events to TOKEN2049 Singapore! From the official launch of Gate Money to the F1 Red Bull driver meet-and-greet and the Gate Gala, we witnessed a new chapter of "One Gate, Borderless Finance." Which moment from TOKEN2049 stood out most to you?

LedgerLossesNear90Million

39.32k Views243 Discussing

GateWCTCS9GlobalTradingCompetition

33.93k Views5.04k Discussing

View More