Share your thoughts
placeholder
Article
U.S. funds sold for 7 straight days, while ETFs took in $216 million in a single day: ETH’s selling pressure was absorbed head-on
Ridiculously, U.S. funds have dumped BTC on Coinbase for 7 straight days, yet $ETH simply didn’t follow. Strategy—don’t chase shorts; buy dips above 2508, and reduce positions if 2481 breaks.

Coinbase is the main entry point for U.S. institutions and retail investors, so 7 straight days of selling means U.S. funds have continued to retreat. The market hit back directly—after the event, 2541.02 moved to 2540.38, -0.03%; ETF net inflows reached $216 million, with Bl
ETH-1.83%
$ZZZ is in strong Accumulation
ll tape to $500M by the end of new week
post-image
ZZZ+40.75%
This move doesn’t even require me to think—the account is partying on its own. During the intraday bottoming, $MU repeatedly held above 946.09 without breaking below. I watched for a few minutes: the key level held, buying pressure was still strengthening, and it was obvious someone was accumulating through the volatility. My only conclusion at the time: a pullback is an entry point, not a signal to run.
The market is waited out, and profits are held onto.
Then the candlesticks slowly started to rise, and just now they touched 976.19 directly, with the position return already reaching +226.35
post-image
MU-0.69%
DOGE-0.71%
LAB+6.96%
#ZECPlungesOver13% ZEC Plunges Over 13% | Sharp Correction After Major Rally
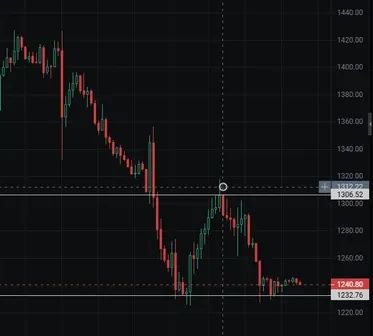
$ZEC faced heavy selling pressure, falling more than 13% in 24 hours after an aggressive rally pushed the token to multi-year highs. The move highlights just how quickly momentum can reverse when traders start locking in profits and leveraged positions are forced to close.
The correction came after Zcash had posted a remarkable run, with the price recently reaching around the $1,250–$1,300 area. High leverage and stretched momentum made the market particularly vulnerable to a sharp pullback. Reports also pointed to si
post-image
ZEC-3.25%
Insiders are calling this the quiet setup before ETH explodes.

$ETH /USDT - LONG

Trade Plan:
Entry: 2529.14 – 2536.16
SL: 2498.96
TP1: 2557.92
TP2: 2574.76
TP3: 2600.03

Why this setup?
Why now? The daily trend is bullish and the 1h price is holding at 2532.68, which matches the entry reference almost perfectly. The 15m RSI at 44.15 shows room to run before overbought, while the 1h ATR of 14.03688 tells us the next move should be big enough to hit the first target at 2557.92. If momentum continues, the second target at 2574.76 becomes the real breakout level, but the invalidation level at
ETH-1.75%
Everyone's sleeping on SYMBOL while the daily trend screams bullish.

$NEAR /USDT - LONG

Trade Plan:
Entry: 2.3973 – 2.4183
SL: 2.3068
TP1: 2.4836
TP2: 2.5341
TP3: 2.6099

Why this setup?
Why now? The daily trend is firmly bullish, giving us a high-conviction directional backdrop with a 95 confidence score on the 4h timeframe. The 15m RSI at 53.71 shows room to run without being overbought, so we are not chasing an exhausted move. The 1h ATR of 0.042099 tells us average volatility is healthy enough to target TP1 at 2.4836 and TP2 at 2.5341 from the entry zone of 2.3973 to 2.4183 around the
NEAR-7.50%
Volume ratio 22.8x, shorts are still paying funding: MTL’s surge is not that simple
Damn, $MTL rallied 24.314% in one day, driving the volume ratio to 22.8x—I watched it all night, waiting for a pullback. Direction first: bullish on the daily chart, but don’t chase short term; buy the dip on a retracement.
The volume is real. 24h trading volume was 2819067 USDT, while the entire previous day was only 277,000; at 23:15, the 15-minute candle surged to 0.35, with single-candle volume of 1718486. MACD has maintained a golden cross above the zero line for 22 days, MA7 has held above MA30 for 19 day
MTL+15.02%
BITCOIN IS FACING A SHIFT AS AI DRASTICALLY ACCELERATES QUANTUM COMPUTING THREATS. Before you get completely distracted by the pre-CPI market jitters, take a look at what is cooking on the tech side. According to Decrypt, AI agents have successfully optimized quantum attack benchmarks against cryptography by 86 percent. This means the hypothetical quantum threat to $BTC is moving closer to reality much faster than anyone anticipated. 🤖 AI agents are now being used to optimize quantum algorithms, making decryption techniques far more efficient. ⚡ This 86 percent drop in quantum attack benchmar
post-image
BTC-0.66%
$1000 to $100,000 Crypto Trade Challenge Today
live-cover
LIVE533
ETHFl has risen for 8 consecutive days? Is it going to space? #ethflUSDT
post-image
Guys, some of this coin’s communities are really good—worth it! #LCKC
post-image
#美参议院发布新版CLARITY法案 Brothers, the market has reached a turning point on the monthly timeframe. I still believe this is a rebound rather than a reversal. Next, three major events could trigger a black swan: the bill failing to pass or being postponed, Trump losing the November midterm elections, and the AI bubble bursting. No one can predict the future amid historical volatility, but human evil and greed have remained unchanged for thousands of years. If we do not go through a hellish collapse, how can we welcome new life? If you have FOMO, please don’t go all-in. If you’re afraid, wait togethe
🚨 What if Bitcoin’s 4-year cycle isn’t broken… but simply misunderstood?
Look at the chart.
2017 → ATH around $19K
2021 → ATH around $69K
2025 → ATH around $126K
And now the chart is suggesting something even more interesting:
2026 = accumulation?
2028–2029 = another major expansion?
If the historical structure continues to rhyme, a $400K+ Bitcoin in the next cycle wouldn’t look completely impossible.
But there’s a problem with this thesis…
Bitcoin’s market today is nothing like it was in 2017 or even 2021.
Institutional participation, ETFs, liquidity, regulation, leverage, and market maturit
post-image
BTC-0.66%
LSK surged directly from around $0.12 to $0.24, with trading volume exceeding $100 million (some data shows over $200 million). Public reports do not align with an independent mainnet catalyst today; it looks more like a low-market-cap blockchain taking its turn in the rotation. Technical indicators are already extremely overbought. The difference between it and Lobster is that LSK has sufficient spot volume and is not purely a Chinese meme.
$LSK
post-image
LSK+98.28%
Entering a position with 0.265 as the target.
post-image
$BTC Signal】Short setup + 4H moving-average suppression/order-book sell pressure buildup
$BTC The 1H rebound is weak, with the buy-side ratio slipping from 0.56 to 0.45 over four candles. Sell orders are densely stacked above 77384, and order-book depth is imbalanced by -35.5%, with sell-side thickness outweighing buy orders below. Price is oscillating around the 1H Bollinger middle band at 77260, while the upper band at 77424 remains unbroken. The 4H EMA20 is at 77580; the rebound fell back without reaching it, and the short-term moving-average system is still suppressing price. The 1H MACD
post-image
BTC-0.61%
U.S. Inflation Data Reshapes Crypto Sentiment, Could BTC and ETH Find Stability Before Next Week?
live-cover
LIVE363
The Gate ETF AAPL3L/3S Trading Challenge is live. Trade any ETF to earn points and hit AAPL3L/3S volume milestones for up to 3x points. Help unlock a prize pool of up to 50,000 USDT and earn up to 500 USDT based on final points. Trade 1,000 USDT in any ETF daily for one guaranteed-prize draw, with new Apple products among the rewards. https://www.gate.com/campaigns/6248?ref_type=132
post-image
AAPL3L-0.49%
AAPL+1.71%
#CoinDeskRevealsGateRWAPerpetualsTop3Globally
Gate RWA Perps Top 3: Why Synthetic Efficiency Matters More Than Volume Rank for Structural Validation
CoinDesk reports Gate’s RWA perpetuals volume hit $64.7B (+158% MoM) with 12.6% global share, ranking top 3. But raw volume is a vanity metric; the capital efficiency of synthetic exposure to real-world assets determines whether this reflects genuine institutional hedging demand or speculative retail leverage on illiquid underlyings. The real edge lies in validating whether these perps offer tight basis tracking to spot RWAs with sustainable fund
This isn’t a pullback—it’s CPR for my empty account. While the whole screen was glowing green and everyone else was running, I was thinking $PIPPIN was showing weak upward momentum, with clear resistance overhead and no surge in volume. It reeks of a bull trap. This kind of rebound is meant to be shorted. I entered right when the market opened and dumped, shorting at 0.01950. It’s now at 0.01794, and I opened my account to see +157.51%. Feels good, brothers—what a satisfying meal. Take profits when it’s time: pocket the bulk first, set the rest at breakeven, and let it fall. Don’t give the pr
post-image
PIPPIN-1.38%
LAB+6.96%
DOGE-0.71%
Load More

Join 40 M users in our growing community

⚡️ Join 40 M users in the crypto craze discussion

💬 Engage with your favorite top creators

👍 See what interests you