Share your thoughts
placeholder
Article
It’s X layer’s turn, just bought some #DUO
Make money and share the gains with the bros.
post-image
A few days ago, I was still thinking about how to make a graceful exit before bed. When I opened the chart in the morning, it had already sent the short position into profit😮‍💨. During the intraday plunge, $SKYAI kept falling just short every time it pushed higher, with insufficient buying support, so I signaled a short at 0.06198. Now at 0.05182, the +402.36% profit is already secured. The earlier action was truly sluggish, but the result is truly sweet😎. Take the bulk of the profits off the table first: close 80%, and set the remaining 20% at the entry price for protection. Don’t let a re
post-image
SKYAI+0.43%
XRP+1.30%
BNB+2.53%
Did you claim those $100 from the Grok bot?
I originally just wanted to connect the X paid API to Grok Bot for searches / timelines / mentions.
I added $25 to try it, but total showed approximately $123.
Only after breaking it down did I understand:
• prepaid ≈ $23.7 → the remainder of what I added
• free ≈ $99 → the starting credits granted when connecting (expires in about 1 year
Official statement on 8/29: Paid Grok Bot users get free X API credits to start
The official amount wasn’t fixed; the image above shows my actual test. Check free before connecting, and don’t be tricked by total int
post-image
  • 1
hot Topics only
live-cover
LIVE1,557
#SOLV/USDT ANALYSIS
SOLV is rebounding from the support trendline of the falling wedge pattern and is currently attempting to break above the wedge resistance.
The 50MA is acting as a key support level below the current price action.
A solid breakout above the wedge, followed by a successful retest, could trigger a strong bullish rally.
$SOLV
post-image
SOLV+5.00%
  • 2
  • 1
【$Lobster Signal】1H Momentum Continuation, Place Limit Orders to Go Long
$Lobster 1H RSI 94.01, 4H MACD histogram continues to expand, and the 0.0917% funding rate remains under control. The price at 0.104062 is holding above the 1H Bollinger upper band at 0.0976.
🎯Direction: Long
⚡Entry/Limit Order: 0.10374981 - 0.10406200
🛑Stop-Loss: 0.10302138
🚀Target 1: 0.10562293
🚀Target 2: 0.10640340
🛡️Trade Management:
- Execution strategy: After reaching Target 1, reduce the position by 50% and move the stop-loss up to breakeven. If the price falls back to the entry level, exit automatically to pr
post-image
龙虾+188.29%
BTC+0.19%
ETH+2.30%
SOL+2.06%
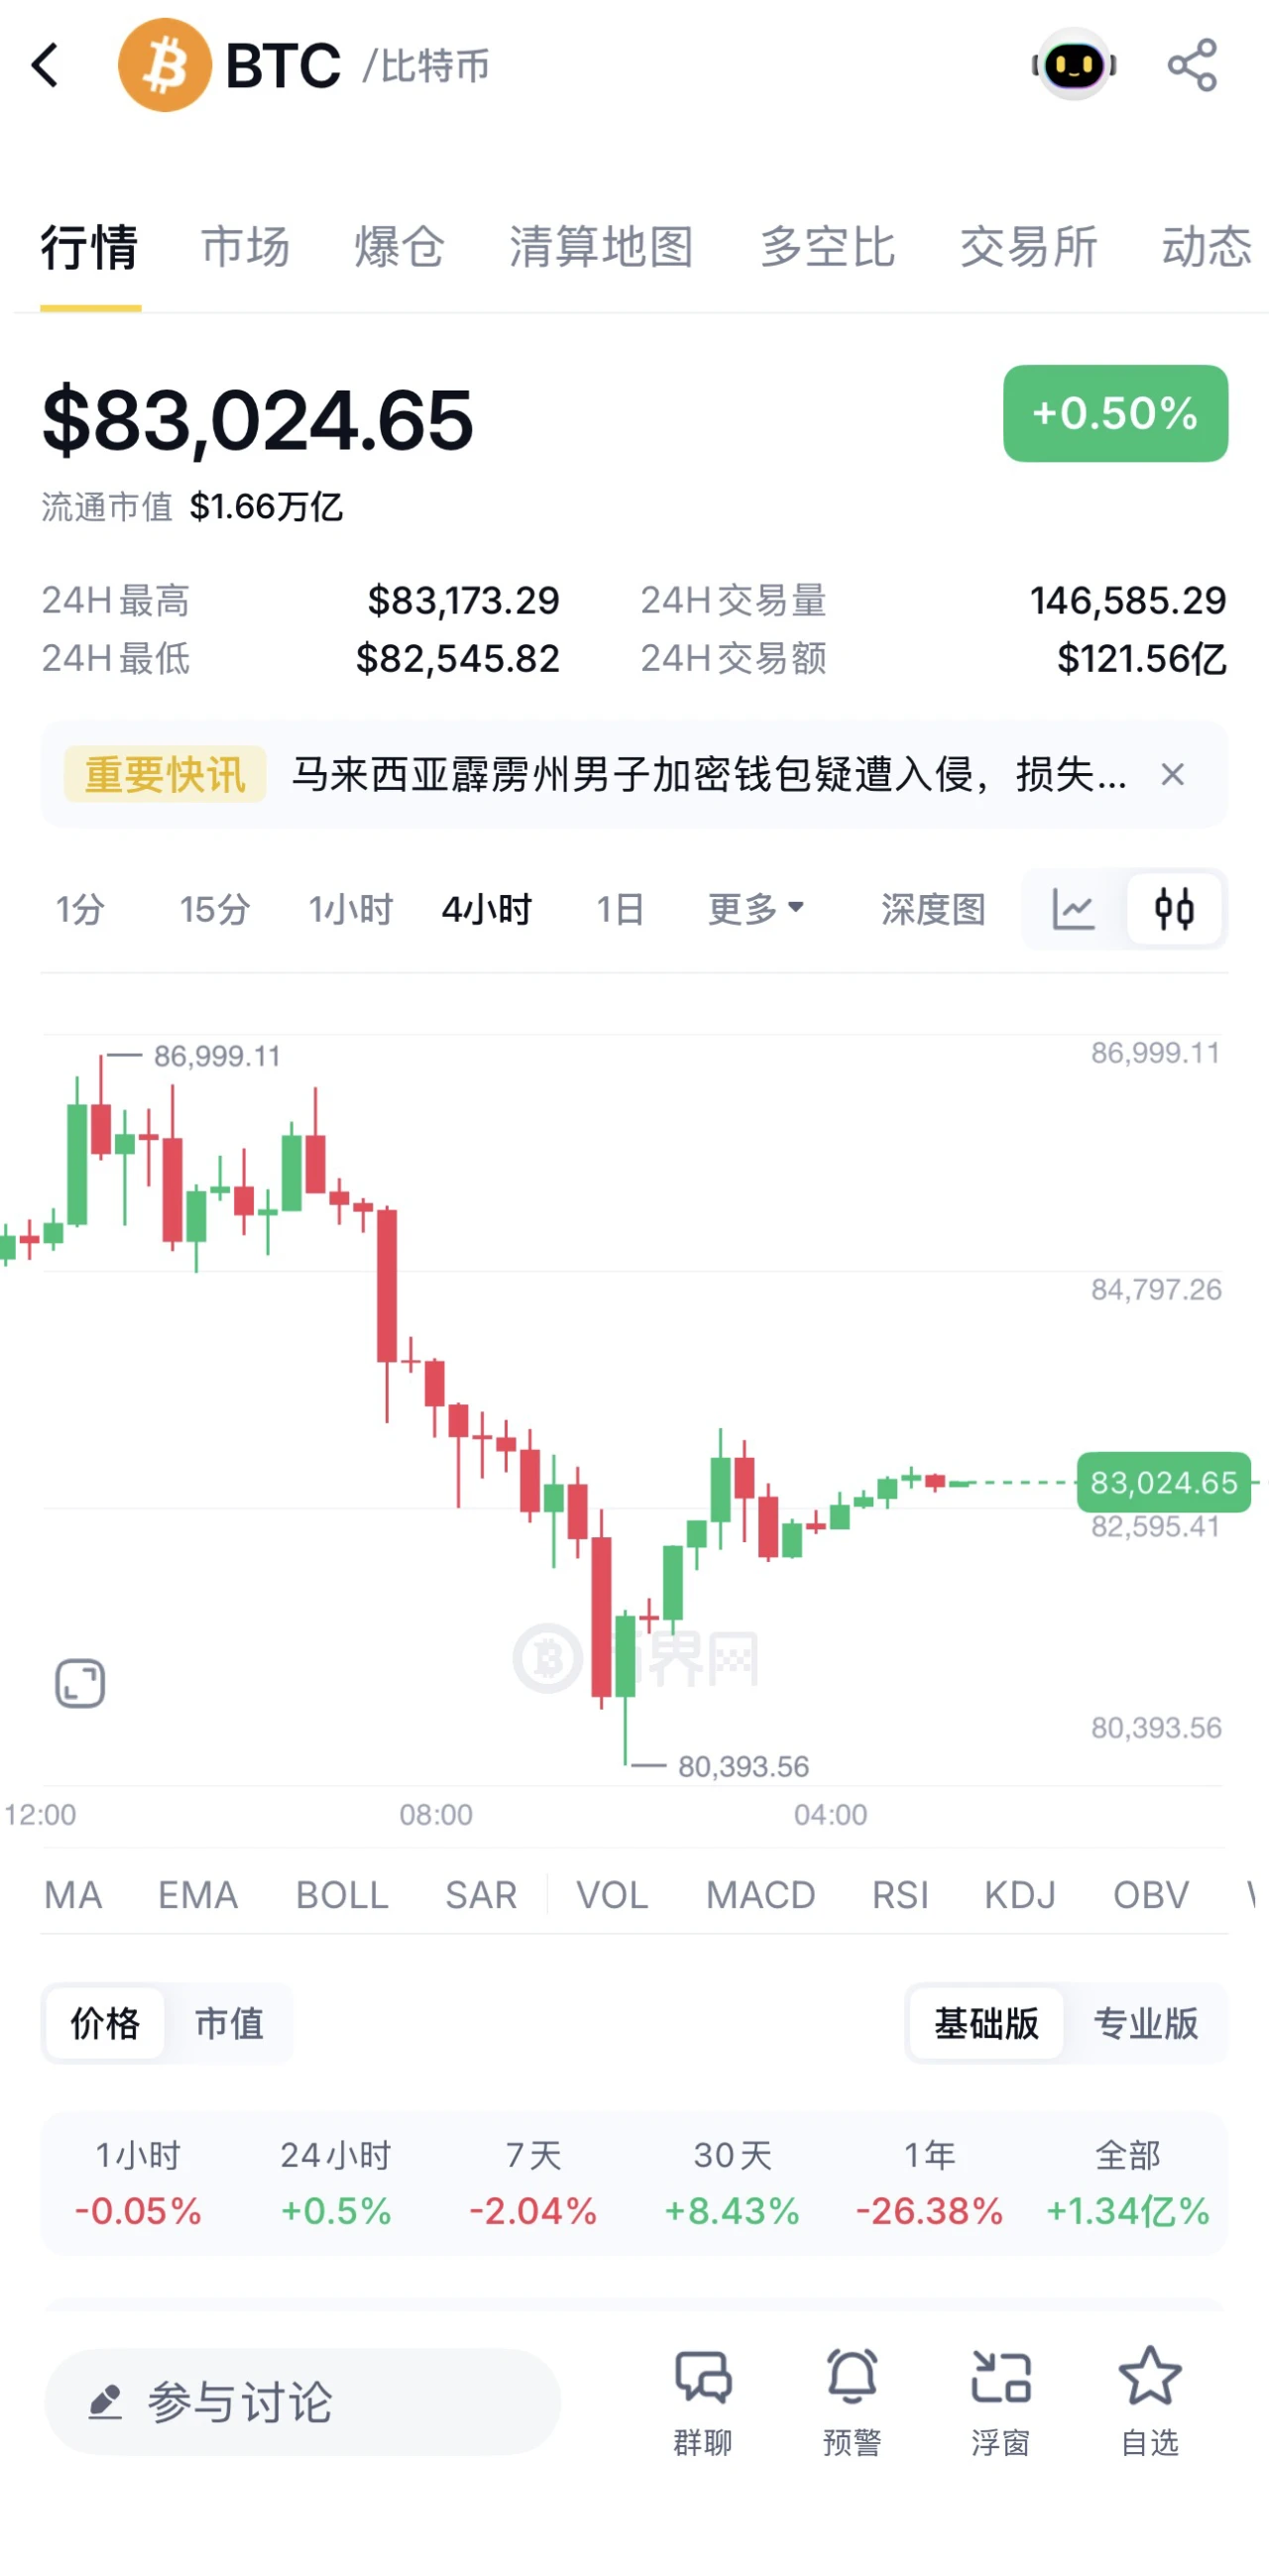
#BTC
Share your favourite fractals below 👇🏻
Here is mine
BTC+0.19%
$ETH has been absolutely brutal this time. Just a moment ago, I was watching a big bullish candle with my unrealized profit doubling, then one sharp bearish drop blew out my long position, crashing from 2667 all the way back to 2516 without even giving me a chance to set a take-profit. Don't talk to me about a reversal now, and don't tell me to buy the dip. If the 2510–2500 range can't hold, even my last bit of hope for adding to my position will be shattered. If it holds, I can still hope for a rebound to 2540 to recover some losses. Once 2500 is breached, it will head straight for 2450, and
post-image
ETH+2.29%
Everyone is missing the SYMBOL short setup hiding in plain sight.

$XAUT /USDT - SHORT

Trade Plan:
Entry: 4347.3 – 4353.9
SL: 4382.7
TP1: 4326.5
TP2: 4310.5
TP3: 4286.4

Why this setup?
Why now? The daily trend is bearish while the 1h price sits at 4350.6, perfectly inside the entry zone between 4347.3 and 4353.9. The 15m RSI at 49.59 shows neither overbought nor oversold, leaving room for a clean move lower before any exhaustion. The 1h ATR of 13.364881 tells us the market is volatile enough that a single candle can cover the distance to TP1 at 4326.5 and still have momentum toward TP2 at
XAUT+0.39%
Early-session prices pulled back and stabilized around 0.0129703, so I directly went long. The plan is simple: as long as the hourly candle body does not break down, the upside target is the high-volume trading zone, with the stop-loss placed at the same time.

After entering, it chopped around for a short while, with one wick in between, but I didn’t adjust the position. Once the hourly candle closed bullish again and volume pushed the price upward, I took 70% off at the first target, then moved the stop-loss on the remaining position directly above the entry price.

The subsequent rise wen
post-image
XRP+1.30%
ADA-0.81%
$rock hard, plumber owned asset on the left
$meth stupid brocoli head gen z poor people owned asset on the right.
which one did you buy anon?
told you from the beginning to buy the plumber owned asset, did you listen?
post-image
Insiders are quietly fading $LTC /USDT above 53.82 while the 1h ATR screams exhaustion.

$LTC /USDT - SHORT

Trade Plan:
Entry: 53.68 – 53.96
SL: 55.12
TP1: 52.84
TP2: 52.19
TP3: 51.21

Why this setup?
Why now? The 1h price sits at 53.82 inside a tight entry zone between 53.68 and 53.96, and the 1h ATR of 0.542904 shows compressed volatility that often precedes a sharp move. The 15m RSI at 54.89 is barely neutral, confirming no bullish momentum is left to defend the range. The daily trend is range-bound, meaning the market lacks directional conviction and sellers can dominate once resistanc
LTC+1.59%
Simple lunch by myself.Yummy!
post-image
🔥 Bitcoin’s multi-month falling wedge has finally broken, signaling a potential end to the prolonged correction. With higher-timeframe momentum turning bullish, BTC could be entering its next major expansion phase, with $120,000+ emerging as a long-term target.
post-image
BTC+0.19%
WHO’S GONNA MAKE IT TO $1 FIRST? 👀🔥
terra-luna:native VS $DOGE

👇 👇
post-image
LUNA+2.86%
DOGE+0.46%
The main reasons for yesterday’s sharp surge in Bitcoin and Ethereum were the release of the U.S. August CPI data and a short squeeze. Ethereum surged directly from around 2,430 to around 2,667 before coming under pressure and pulling back, and is currently fluctuating around 2,500.
From the daily chart, Ethereum’s bullish trend has not been broken, but the long upper wick at the highs indicates heavy selling pressure above, with the market shifting from a one-way rise to high-level consolidation. Therefore, traders should not blindly chase long positions on the daily timeframe. The mid-band s
post-image
ETH+2.29%
#AugustCoreCPIBeatsExpectations
Yes, this data is a hawkish signal that could create short-term pressure on BTC.
* Core CPI came in at 0.3% month-over-month; the expectation was 0.2%. This indicates that inflation is re-accelerating on a monthly basis.
* However, annual core CPI declined to 2.4%, matching expectations. Therefore, the picture isn't entirely one of "inflation spiraling out of control."
* More importantly, following the CPI release, expectations for a Fed rate hike in September rose to approximately 90%.
* This situation could push US bond yields and the dollar higher wh
BTC+0.22%
  • 2
I didn’t do anything—just went to the bathroom, and when I came back, the candlestick chart had already done the work for me. During the repeated intraday swings, I noticed that every push upward kept falling just short, with clearly insufficient buying support and no follow-through in volume. I immediately pointed out that the rebound was weak and that short positions could be added gradually.
490.3 to 418.7, +287.13% secured. This move was handled beautifully, brothers. The wait beforehand dragged on a bit, but it feels truly great now that it played out. This profit was well earned.
Panic c
post-image
SOL+2.07%
BNB+2.53%
#晒出我的持仓收益 Held on for too long! No, you liquidated me, didn't you?
post-image
Load More

Join 40 M users in our growing community

⚡️ Join 40 M users in the crypto craze discussion

💬 Engage with your favorite top creators

👍 See what interests you

View More