Square
Following
Hot
News
Notifications
Profile

BlueBrother

vip
Having been deeply involved in the digital asset market for many years, I have experienced multiple bull and bear cycles. Skilled in interpreting macro fundamentals, analyzing Federal Reserve policies and capital flows, and proficient in technical systems such as moving averages, MACD, and RSI, I focus on trend trading of mainstream assets like BTC and ETH. I believe trading discipline comes first, with capital management as the foundation, and I emphasize stop-loss and risk control. Continuously providing market logic and trend analysis, I share independent thoughts on market cycles, sentiment, and narratives. The market is never short of opportunities; surviving long-term is the key.
Peak Tier VIP 00.0 Year(s)
0
Following
0
Followers
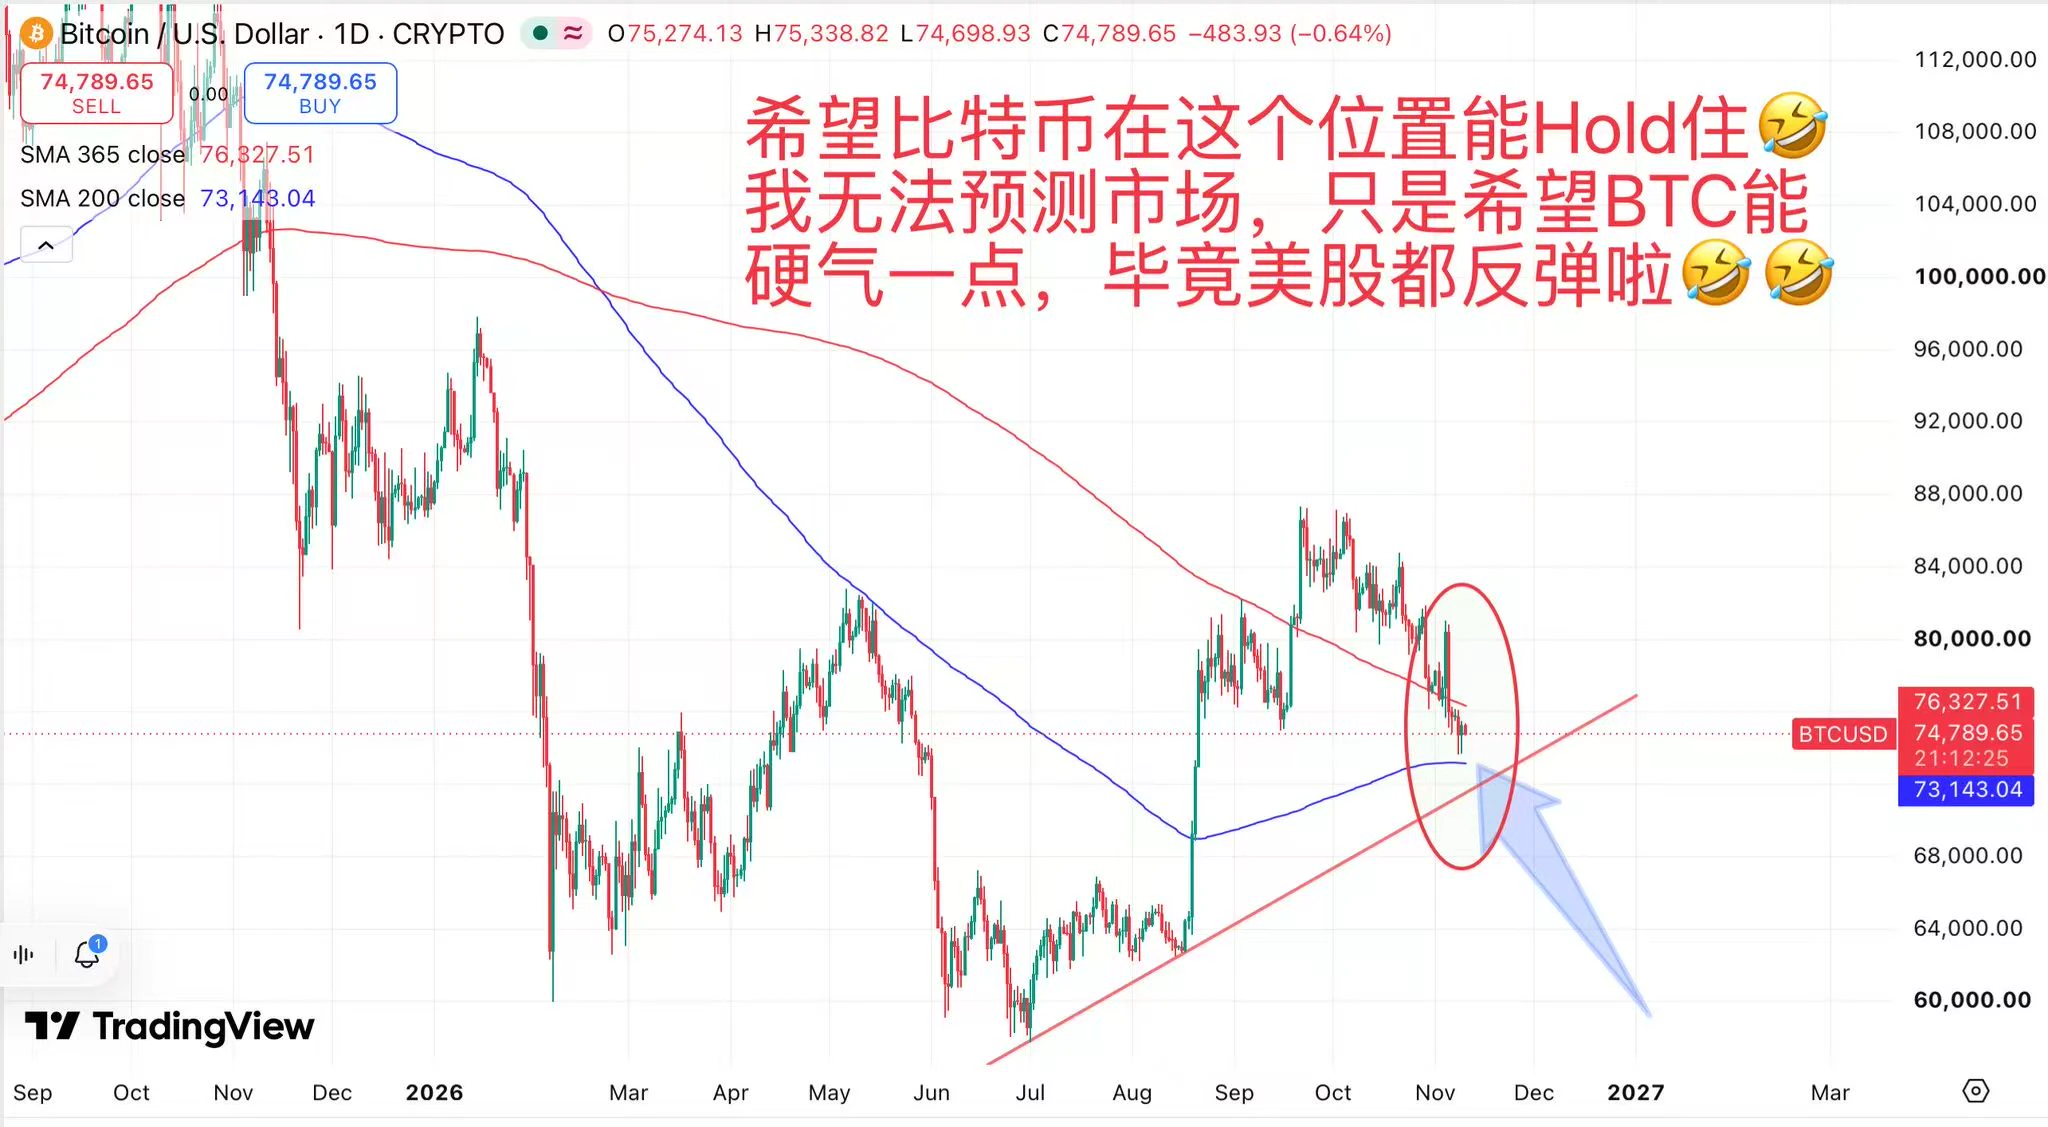
Bitcoin’s recent price action is really frustrating! 🤣

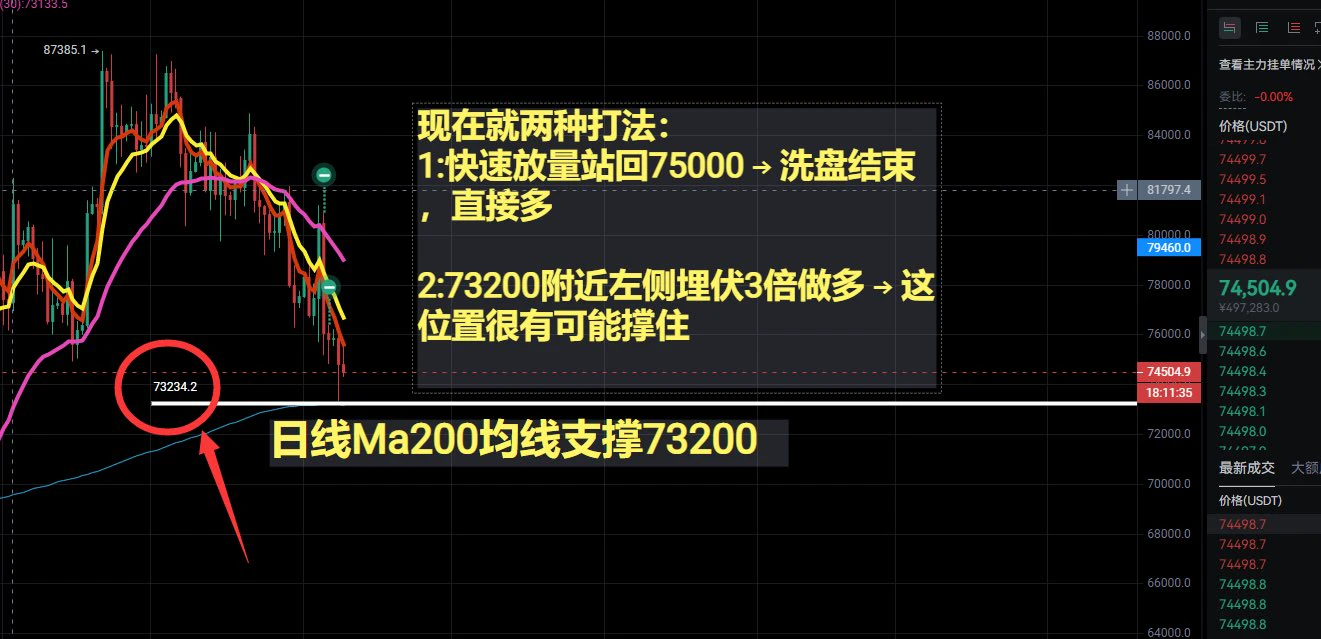
U.S. stocks have already rebounded, but BTC is still hovering around $75k, with no sign of life. It finally managed to surge above $80k a few days ago, only to get slammed back down, and it couldn’t hold above the 365-day moving average.

BTC is now around $74,700. Below that is the 200-day moving average near $73,143, along with the uptrend line I drew. Honestly, I can’t guess what happens next; I just hope it can hold around $73k this time.

If it can get back above the 365-day moving average and then challenge $80k, that would be grea
post-image
BTC-0.65%
Tuesday News

1. US-Iran situation: Al Arabiya reports that US-Iran talks have made initial progress on the key issue of uranium enrichment.
2. External markets: A sharp pullback in international crude oil prices boosted sentiment in US markets. Investors bought the dip overnight, and US stocks posted their strongest single-day performance since April this year.
3. A-share outlook: The broader market is likely in a bottoming phase. With stronger US stocks acting as a catalyst, and given current price-volume trends and capital flows, A-shares may see a rebound with attractive risk-reward.
4. Ge
post-image
BTC-0.65%
11.10 ETH Trade Setup
Market Analysis

ETH plunged rapidly to a low of 2050.32, then stabilized and recovered. The current price is 2126.81. The lower Bollinger Band provided effective support, and the MACD bearish histogram continues to contract, indicating fading downside momentum and an oversold rebound structure following the sharp drop.
Resistance is at 2200, with strong resistance at 2250.

Entry Range

Scale into long positions in the 2110–2120 range. Enter only if a pullback does not make a new low; do not chase the price higher.

Stop Loss

2090. A break below the low of this rebo
post-image
ETH-1.23%
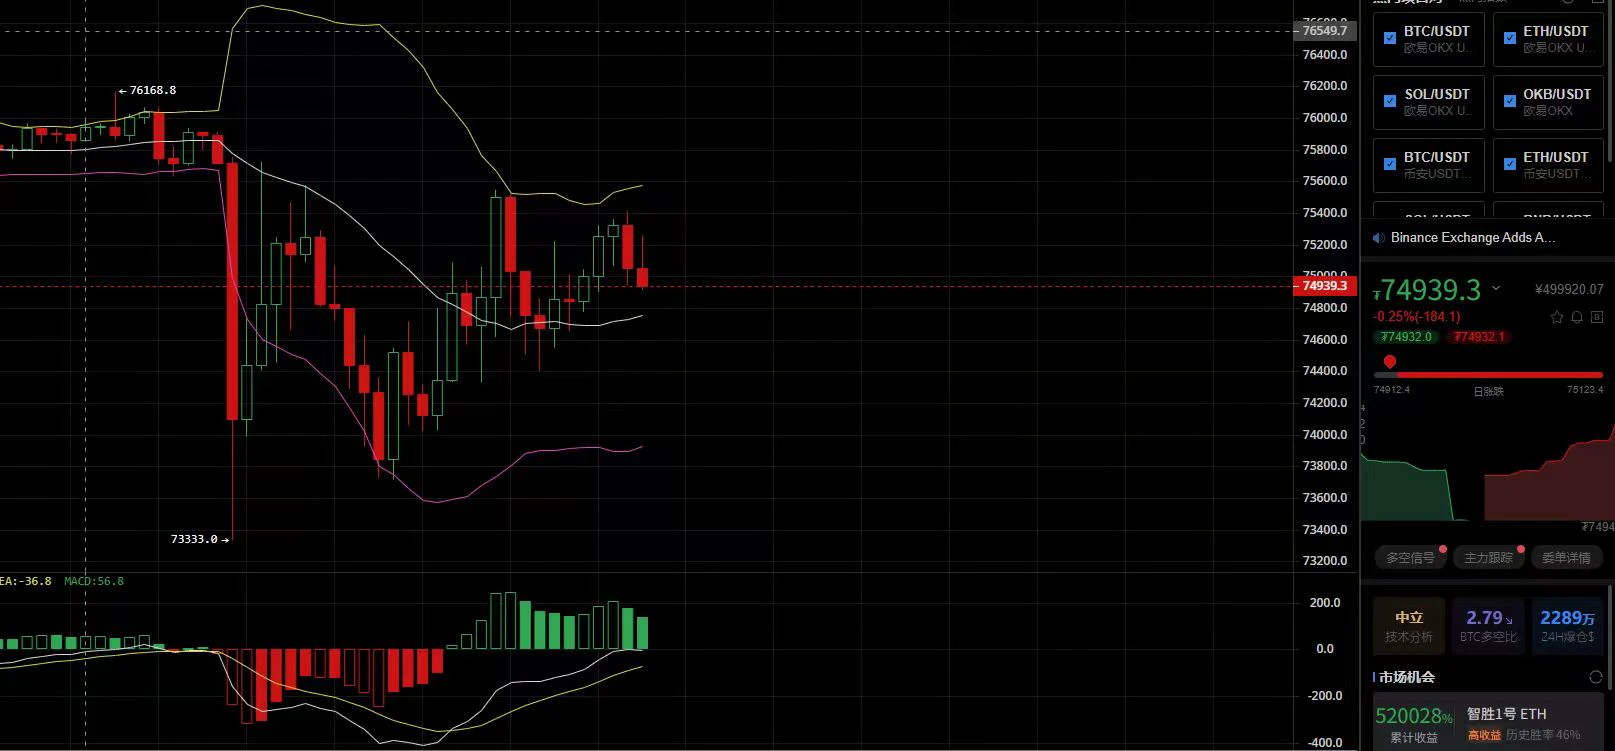
11.10 BTC Positioning Strategy
Market Analysis

BTC is currently quoted at 74939.3. After previously surging to 76168.8, it pulled back, reaching a low of 73333. This level is strong support for the current pullback, with clear buying interest stepping in after the decline. This is a consolidation retest during an uptrend.
The lower Bollinger Band is providing effective support. After the MACD green bars ended, the red bars began rising again, forming a corrective shakeout pattern. As long as the price does not decisively break below the 73333 low, there is still a chance for the bullish recov
post-image
BTC-0.65%
“Flowers do not bloom for a hundred days; no trend stays strong forever.”

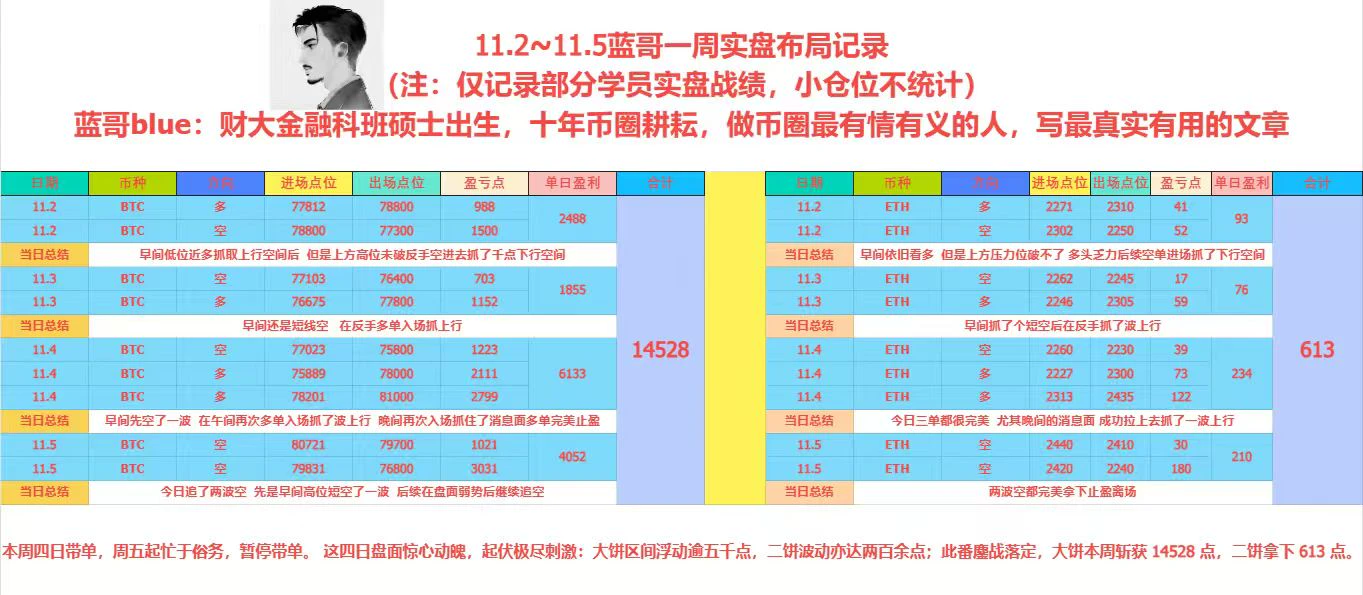
Four days of trade calls this week. Starting Friday, I’ll be busy with everyday affairs and pause the calls.

These four days were nail-biting, with extremely dramatic swings: BTC moved more than 5,000 points within its range, while ETH fluctuated by over 200 points. After the fierce battle ended, BTC gained 14,528 points this week, and ETH gained 613 points.

This market made dramatic swings, rising first and then pulling back, with a wide range of volatility, an intensifying battle between bulls and bears, and shifts
post-image
BTC-0.65%
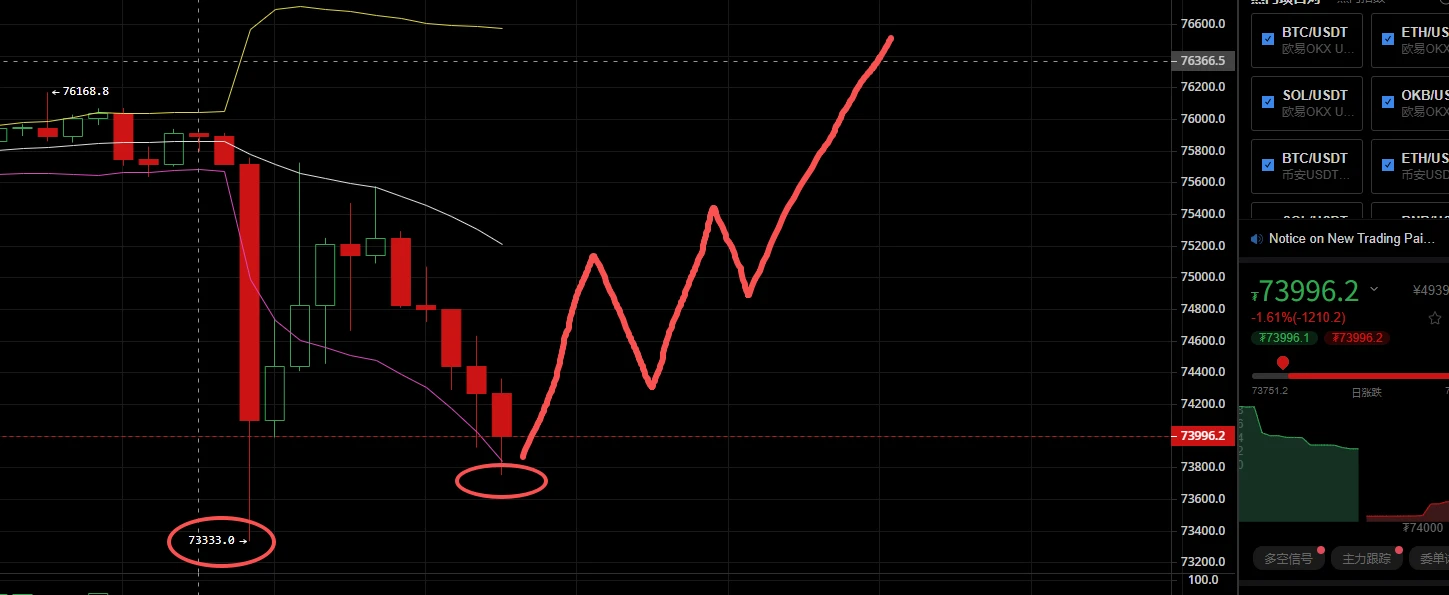
I've seen this Bitcoin price action before: after every accelerated drop comes a second bottom, and once that second bottom is in, a strong rebound begins. It's currently in the second retest, which is also a bear-trap pattern. Once confirmed, it'll take off!$BTC ‌
post-image
BTC-0.65%
Bitcoin continues to slide, leaving the market gripped by panic, but on-chain data shows an unusual divergence: long-term holders are beginning to loosen their grip, while short-term holders remain relatively calm.

Data from November 5 showed that realized losses transferred to exchanges by long-term holders (LTHs) reached $139 million, enough to indicate that some long-time holders can no longer withstand the current market pressure. But short-term holders (STHs) have not seen a comparable wave of panic selling. After substantial turnover in the preceding period, the cost basis of short-term
post-image
BTC-0.65%
11.9 ETH Trading Plan
Market Analysis

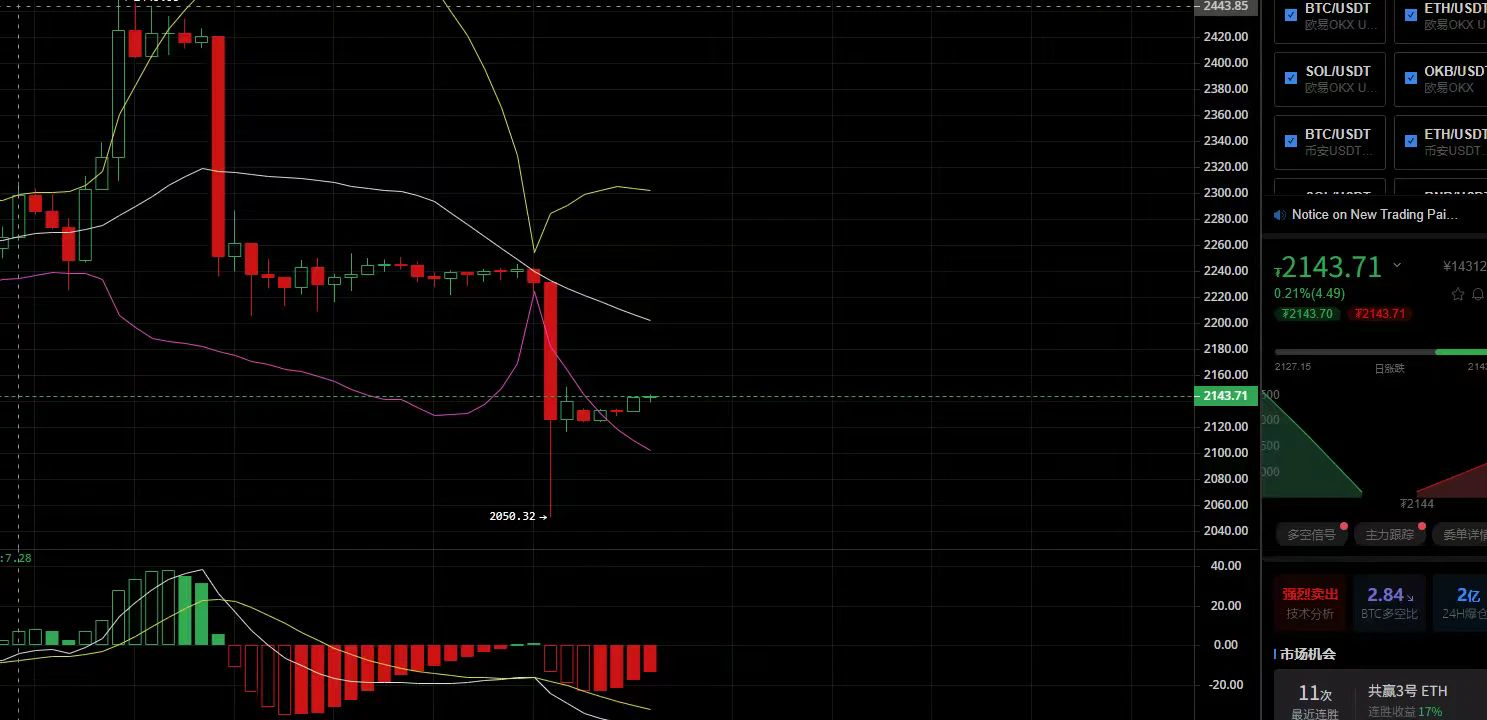
This is a short-term ETH candlestick chart. After a rapid decline to a low of 2050.32, small candles formed as the price stabilized and began to recover. MACD bearish momentum is gradually contracting, indicating an oversold rebound pattern following the sharp drop. The current price is 2143.71, in a bottoming consolidation and recovery phase after the decline, presenting an opportunity to take a long position on an oversold rebound.

Entry Zone

Look to go long on a pullback into the 2130 - 2138 range once the price stabilizes. Wait for a bullish candl
post-image
ETH-1.23%
11.9 SOL Trading Plan
Market Analysis

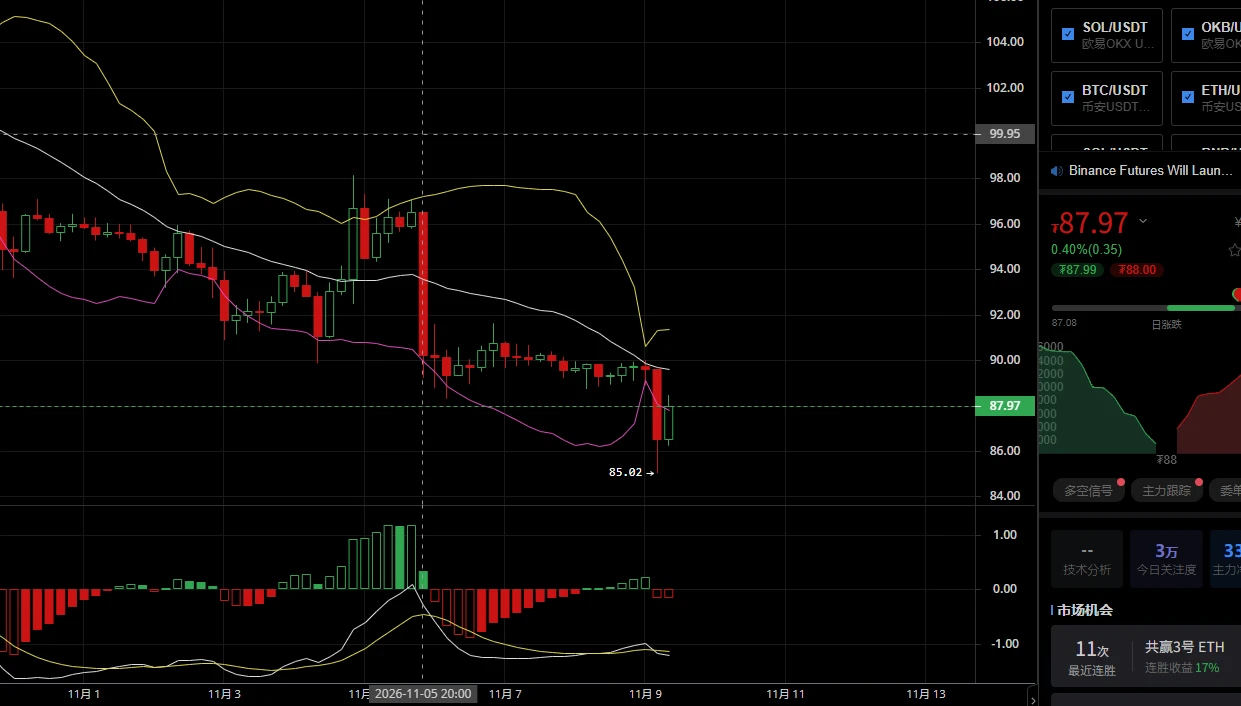
The candlestick chart shows SOL recently dropping sharply, hitting a low of **85.02** and forming a long lower wick—a sign of a short-term plunge that has released bearish pressure. The current price is 87.97, with a slight recovery after the retest. Support is emerging at the lower Bollinger Band, and indicators below show signs of bullish divergence. Bearish momentum is fading, creating an opportunity for a rebound.

Entry Zone

Preferably wait for a retest of the 86.80–87.20 range and enter long in batches;
Aggressive approach: Open a small long pos
post-image
SOL-0.74%
Load More