Square
Following
Hot
News
Profile
Share your thoughts
placeholder
Article
State Street, which manages $6.306 trillion, now has $74.97M of its SWEEP tokenized liquidity fund on Stellar.
That is 26.42% of the $283.77M fund, which State Street built with Galaxy.
@StellarOrg
XLM+0.39%
#美股财报季 Did everyone catch that move last night?
post-image
Trenches
STONK
S
bade
b
STONK
6GmA...UNgx
Market Cap
$.
Change
.
24h Vol
$.
Holders
.
BTC
B
bade
b
BTC
C5xp...pump
Market Cap
$.
Change
.
24h Vol
$.
Holders
.
CNPY
C
bade
b
CNPY
0xc6...ddd2
Market Cap
$.
Change
.
24h Vol
$.
Holders
.
ZIG
Z
bade
b
ZIG
0x8c...1145
Market Cap
$.
Change
.
24h Vol
$.
Holders
.
Q
Q
bade
b
Q
0xc0...0589
Market Cap
$.
Change
.
24h Vol
$.
Holders
.
This has a flywheel—you can take a look, it’s pretty interesting.
If you’re not interested in the rest, you can skip straight to:
It’s already been through one round of shakeout; only .ai wallets can buy.
Once the presale raises 15 BNB, it launches on Pancake;
after launch, each transaction is taxed 2.25%, with 60% converted to BNB and distributed to “depositors.”
---
How to play: three steps
① Buy
Buy on the presale bonding curve; only .ai wallets can buy
Each wallet can buy up to 10 million tokens (1%)
② Graduate
Raise 15 BNB → automatically launch on Pancake
Now: 3.03 / 15 BNB (20%)
③ Depos
post-image
BNB+2.54%
Another successful trade 😎😘 Guys, keep opening short positions on $USELES , as another crash is coming very soon 📉📉
🎯 Final target: $0.10
post-image
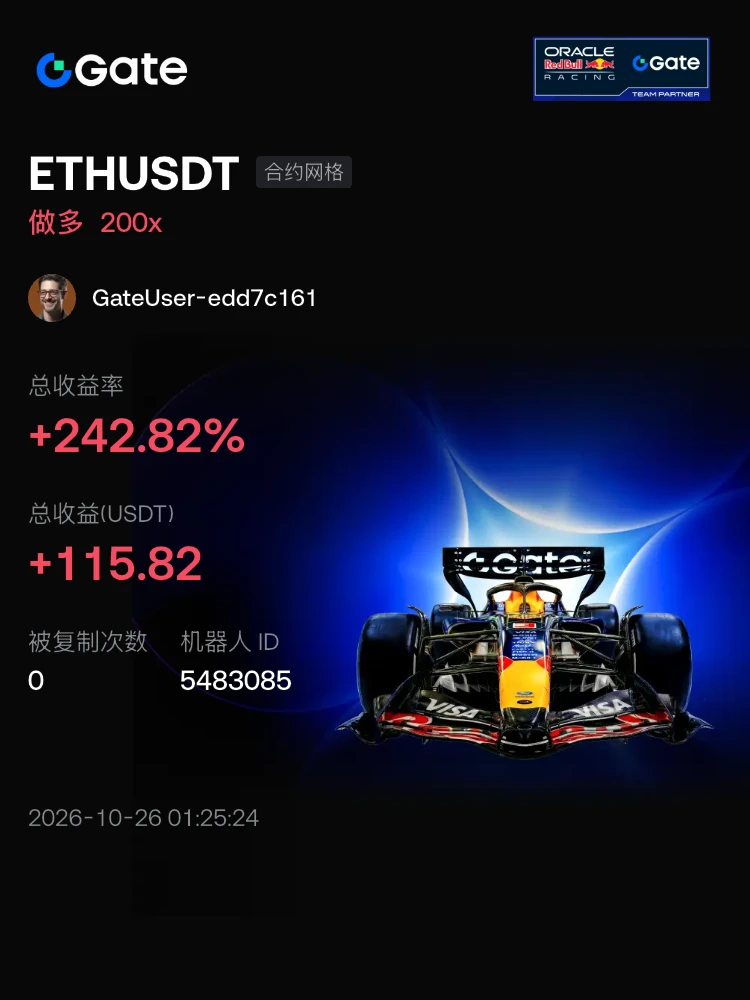
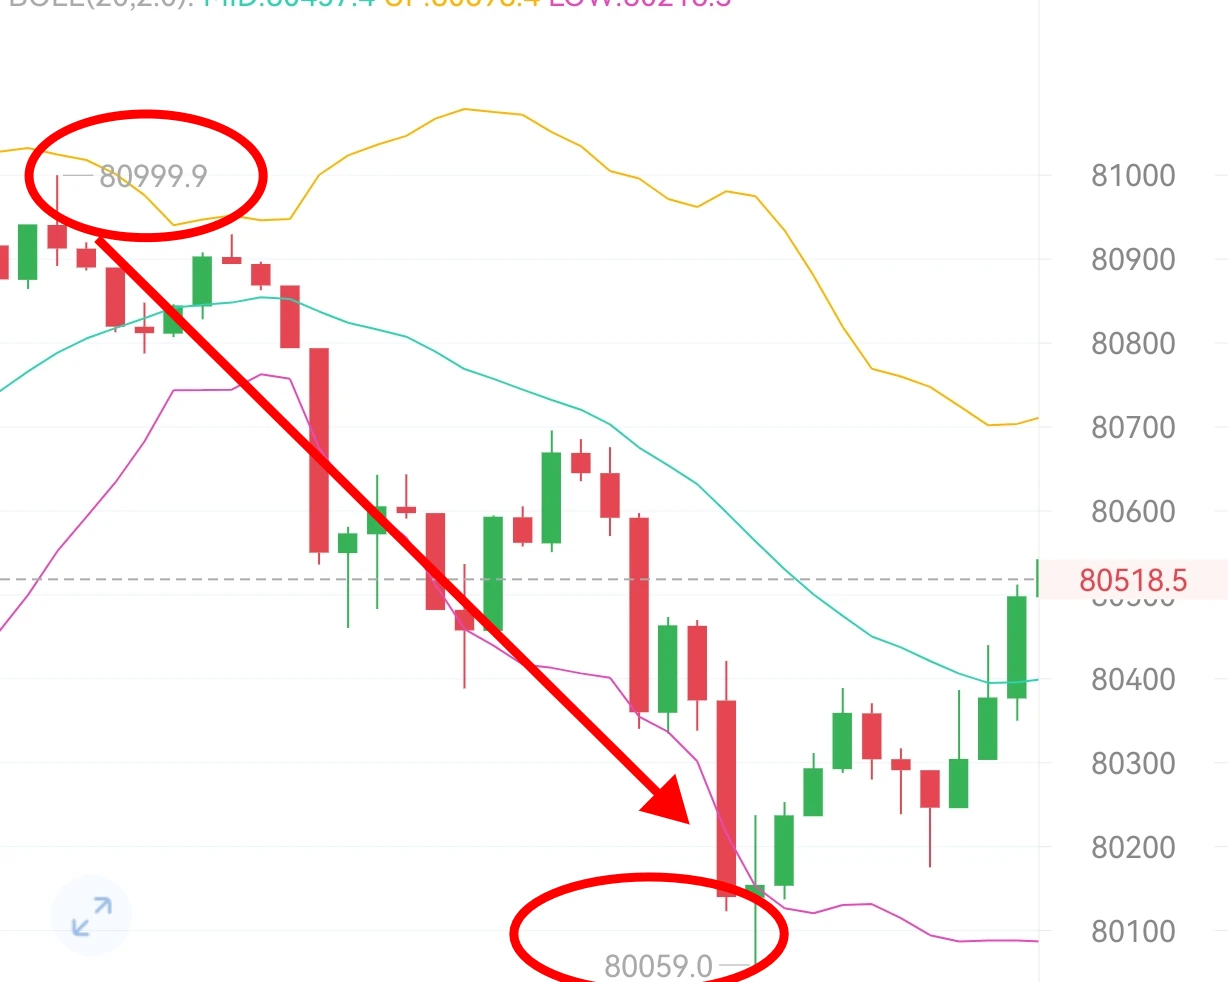
Bitcoin and Ethereum longs and shorts continue to profit intraday
Bitcoin/Ethereum went long last night at 2,290 and 79,300. The market rallied in the early morning to around 81,000 and 2,370. Then we reversed into shorts, with prices falling to around 80,000 and 2,316.
We then entered long positions again around 79,800–80,200 and 2,310–2,330. The market rallied again to around 80,800 and 2,360, and both longs and shorts continued to profit. Overall, capturing these moves over the weekend was pretty good. Congratulations to everyone who followed the strategy. #美股财报季 #GateWCTCS9全球交易赛 #美国消费者信心接近
TraderGuJingci
Sharing the latest subscription order strategy
BTC+0.78%
ETH+1.75%
  • 3
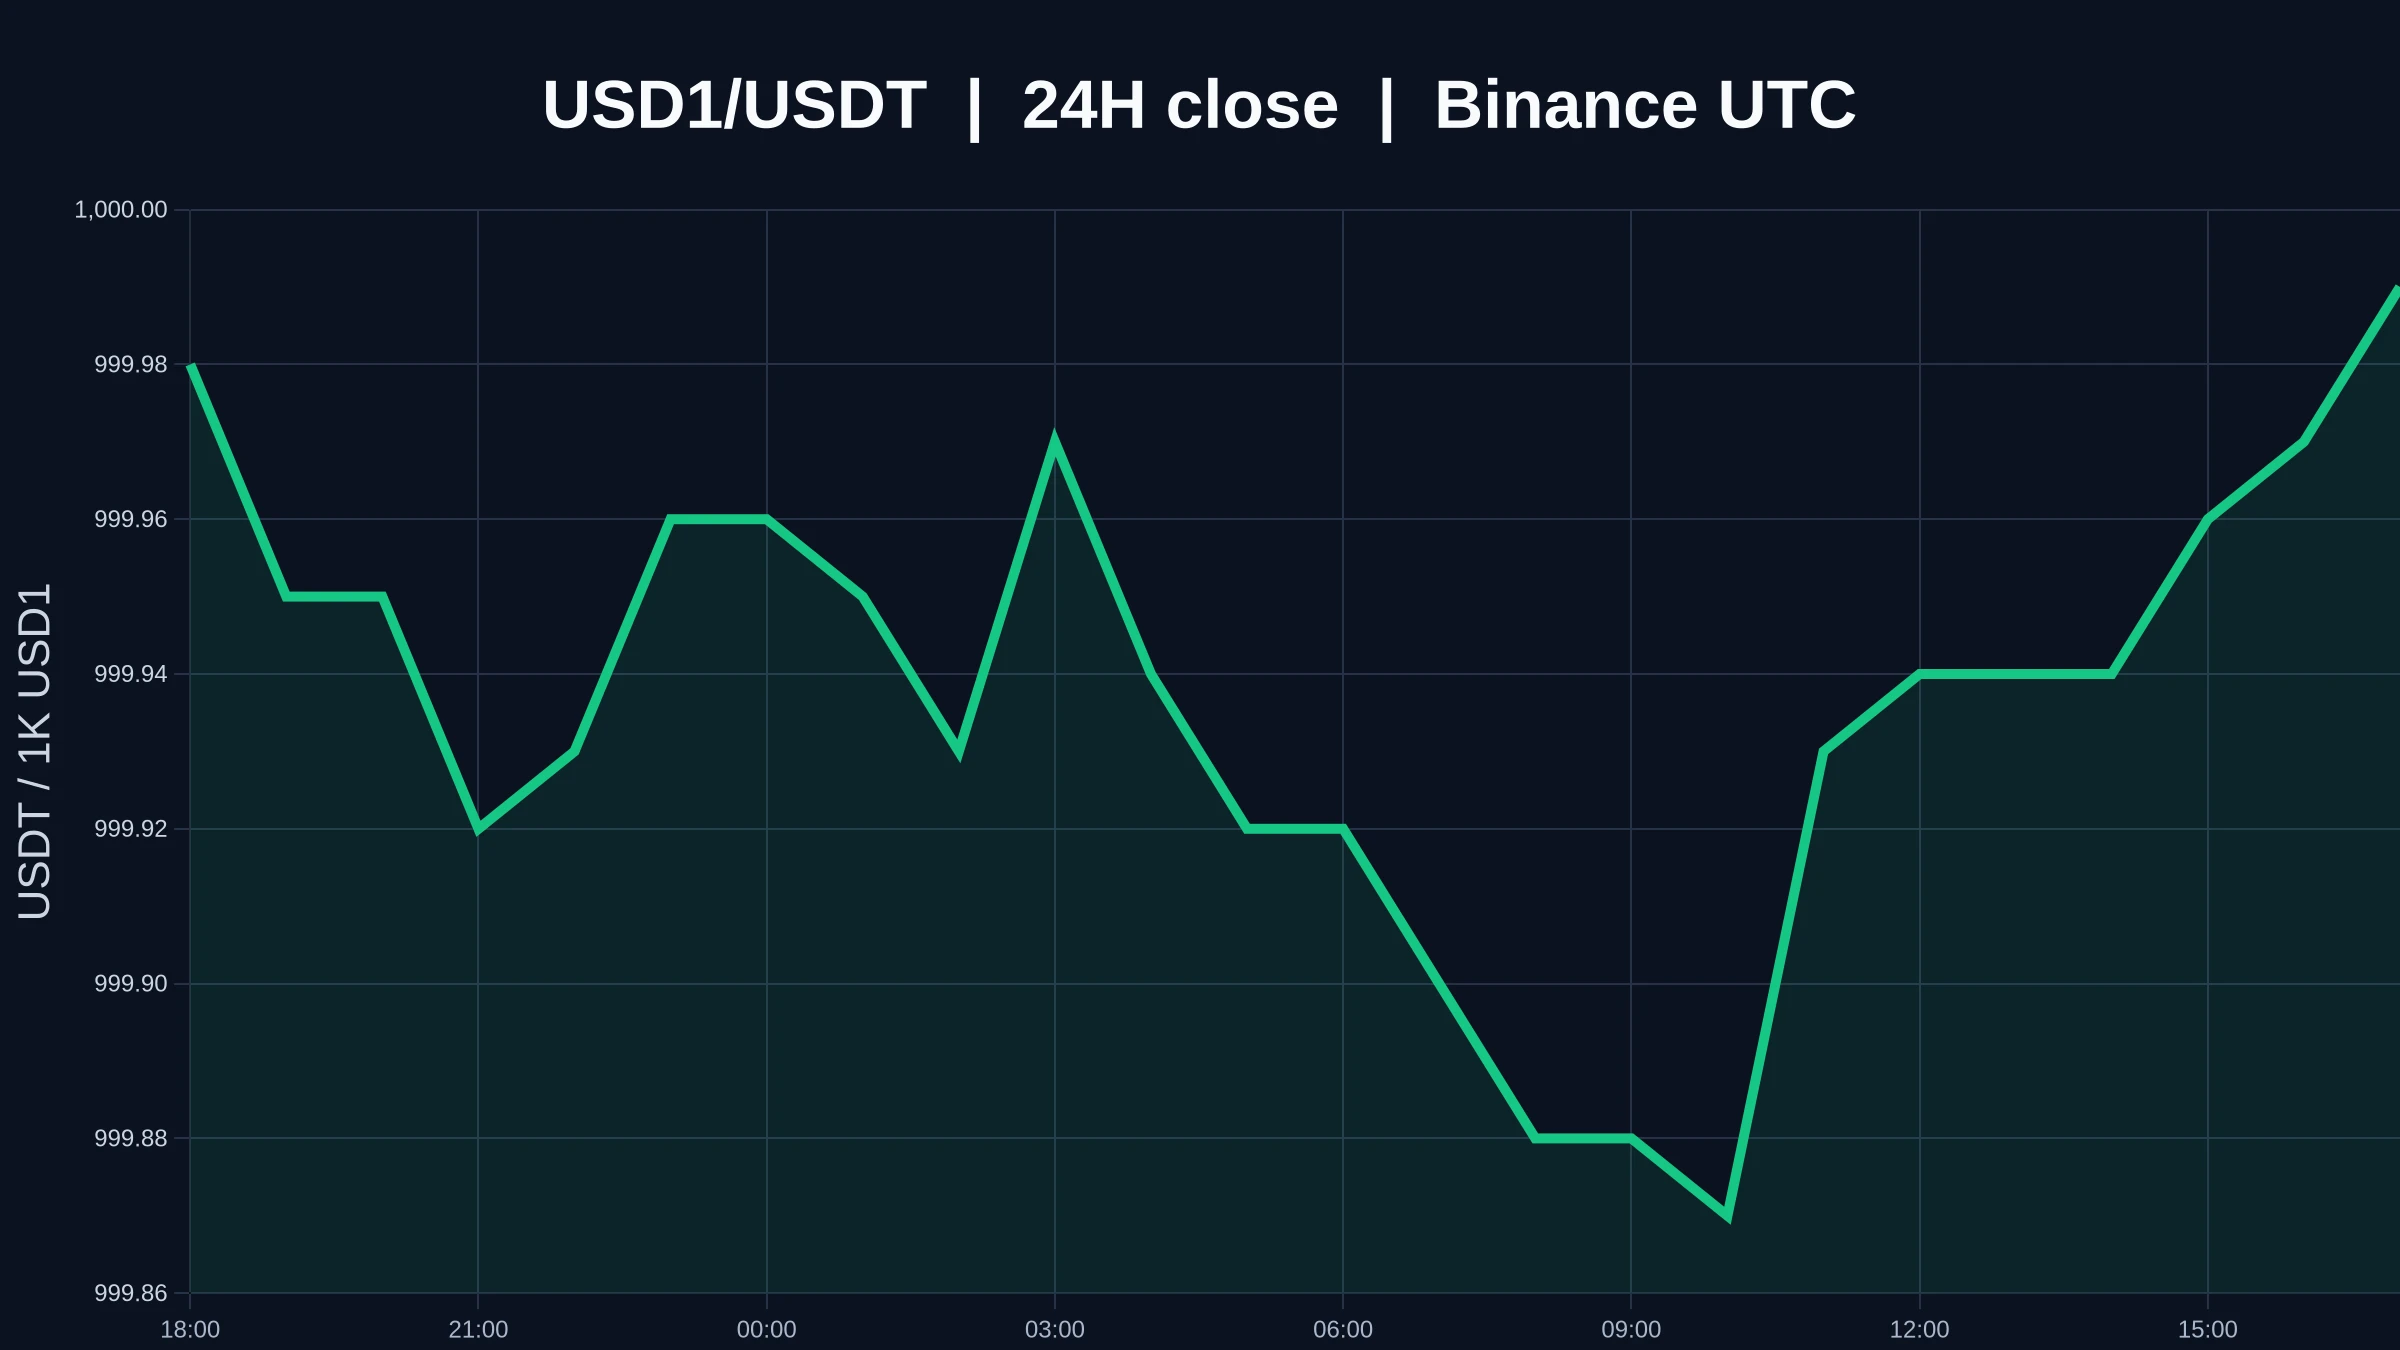
$USD1 is currently priced at 0.99998, up +0.00% over 24 hours, with volume at 0.99 times the average of the last 20 candles. Taken together, these figures show $USD1 at resistance, making it essential to clarify the three distinct steps: testing, breaking through, and holding above.
I treat the first move above resistance as a test; only holding after a retest counts as a valid breakout. Touching resistance is just a test, moving above it intraday is a breakout attempt, and only closing above it with supporting volume comes closer to a confirmed hold.
For the near-term levels, watch 0.99987 an
post-image
USD1+0.01%
I declare that GPT is the AI that understands me best.
post-image
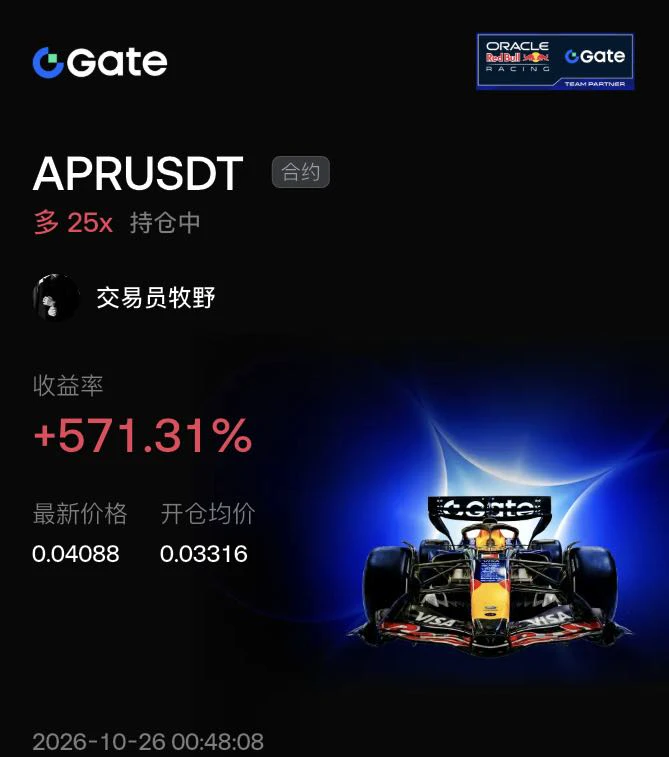
With 571% unrealized gains, every extra hour you hold on, traders sitting on profits near 0.04 feel a stronger urge to “take profits and secure the gains”—and that can drag you down from the highs first.
$APR At 0.04088, the uptrend is intact, but the move from 0.03316 has already left the original trading range and entered an ambiguous acceleration/distribution zone. Liquidity is thin in small-cap futures, and after funding rates run hot, a wick down to 0.038 is perfectly normal. At 25x leverage, you don’t lose only when “the trend is wrong”—volatility alone can wipe you out.
I don’t gamble
post-image
APR+69.76%
BTC+0.78%
ETH+1.75%
$301M in Bitcoin ETF inflows. Enough to flip October green?
US spot $BTC ETFs finished the latest week with roughly $301 million in net inflows. That broke a two-week run of outflows totaling about $910 million.
The week was not clean. Early sessions brought strong buying, more than $1 billion across the first three days. Thursday and Friday then saw heavy redemptions, including one day near $635 million out. BlackRock’s IBIT carried most of the week’s net positive.
October itself is still not clearly green. Mid-to-late month numbers showed the month still in the red or only barely improved on
post-image
BTC+0.81%
  • 3
  • 1
10.26 $BTC Early Morning Analysis
Currently, BTC is consolidating after a sharp drop. The 4-hour bearish trend is slowing, and MACD is showing signs of bullish divergence or a golden cross, suggesting a short-term rebound. However, as the broader trend remains under pressure from a retreat from the highs, the strength of the rebound will depend on whether price can break above and hold the 81,000 level with increased volume.
Yifan's Trading Suggestions (For Reference Only)
· Longs: If price stabilizes around 79,500-80,000, consider a small position to trade a rebound, with a target near 82,00
post-image
BTC+0.81%
Night session, in line with the early morning analysis (your choice; personal opinion)
2375 faces resistance and fails to break through
Continue to short
Targets: 2300-2285-2240
A firm hold above invalidates the short-term bearish outlook
BTC faces resistance at 81500-82400 and fails to break through; short for a T trade
Targets: 79700-78800; broader target 76300
A breakout and firm hold above invalidates the short-term bearish outlook
post-image
This situation once again highlights the decisive impact of energy costs on the global economy. With Brent crude oil trading above $100 per barrel, the effects extend well beyond fuel prices, directly influencing inflation expectations and the monetary policy choices of central banks. Consequently, investors are now tasked with seeking a new equilibrium.
The impact of rising energy prices on inflation is clearly evident in the latest data. In the United States, the 9.1% monthly surge in gasoline prices played a major role in pushing the annual Consumer Price Index (CPI) for September to 3.7%.
post-image
User_any
$XTIUSD ‌$XBRUSD ‌$BZ ‌$CL ‌
Hello, Gate Square community! The data currently appearing on market screens clearly reveals just how delicate and tight the balance in the oil market has become. The U.S. Energy Information Administration’s (EIA) October report indicates that global oil inventories fell by an average of 1.9 million barrels per day in the third quarter, with a further decline of 0.7 million barrels per day projected for the fourth quarter. This is not merely a supply-demand imbalance; it is concrete evidence that the market is tightening further with each passing day.
The primary driver behind this situation is the decline in commercial oil inventories across OECD countries, which, as of September, fell to a level equivalent to 58.1 days of consumption. While a range of 55–65 days is historically considered normal, anything below 55 days signals tight inventory conditions. Although the current level of 58.1 days has not yet fallen below the critical threshold, the continuous erosion of stocks shows that this buffer is thinning week by week. Indeed, the EIA has confirmed a draw of 3.06 million barrels in U.S. commercial crude oil inventories—a figure significantly higher than expectations.
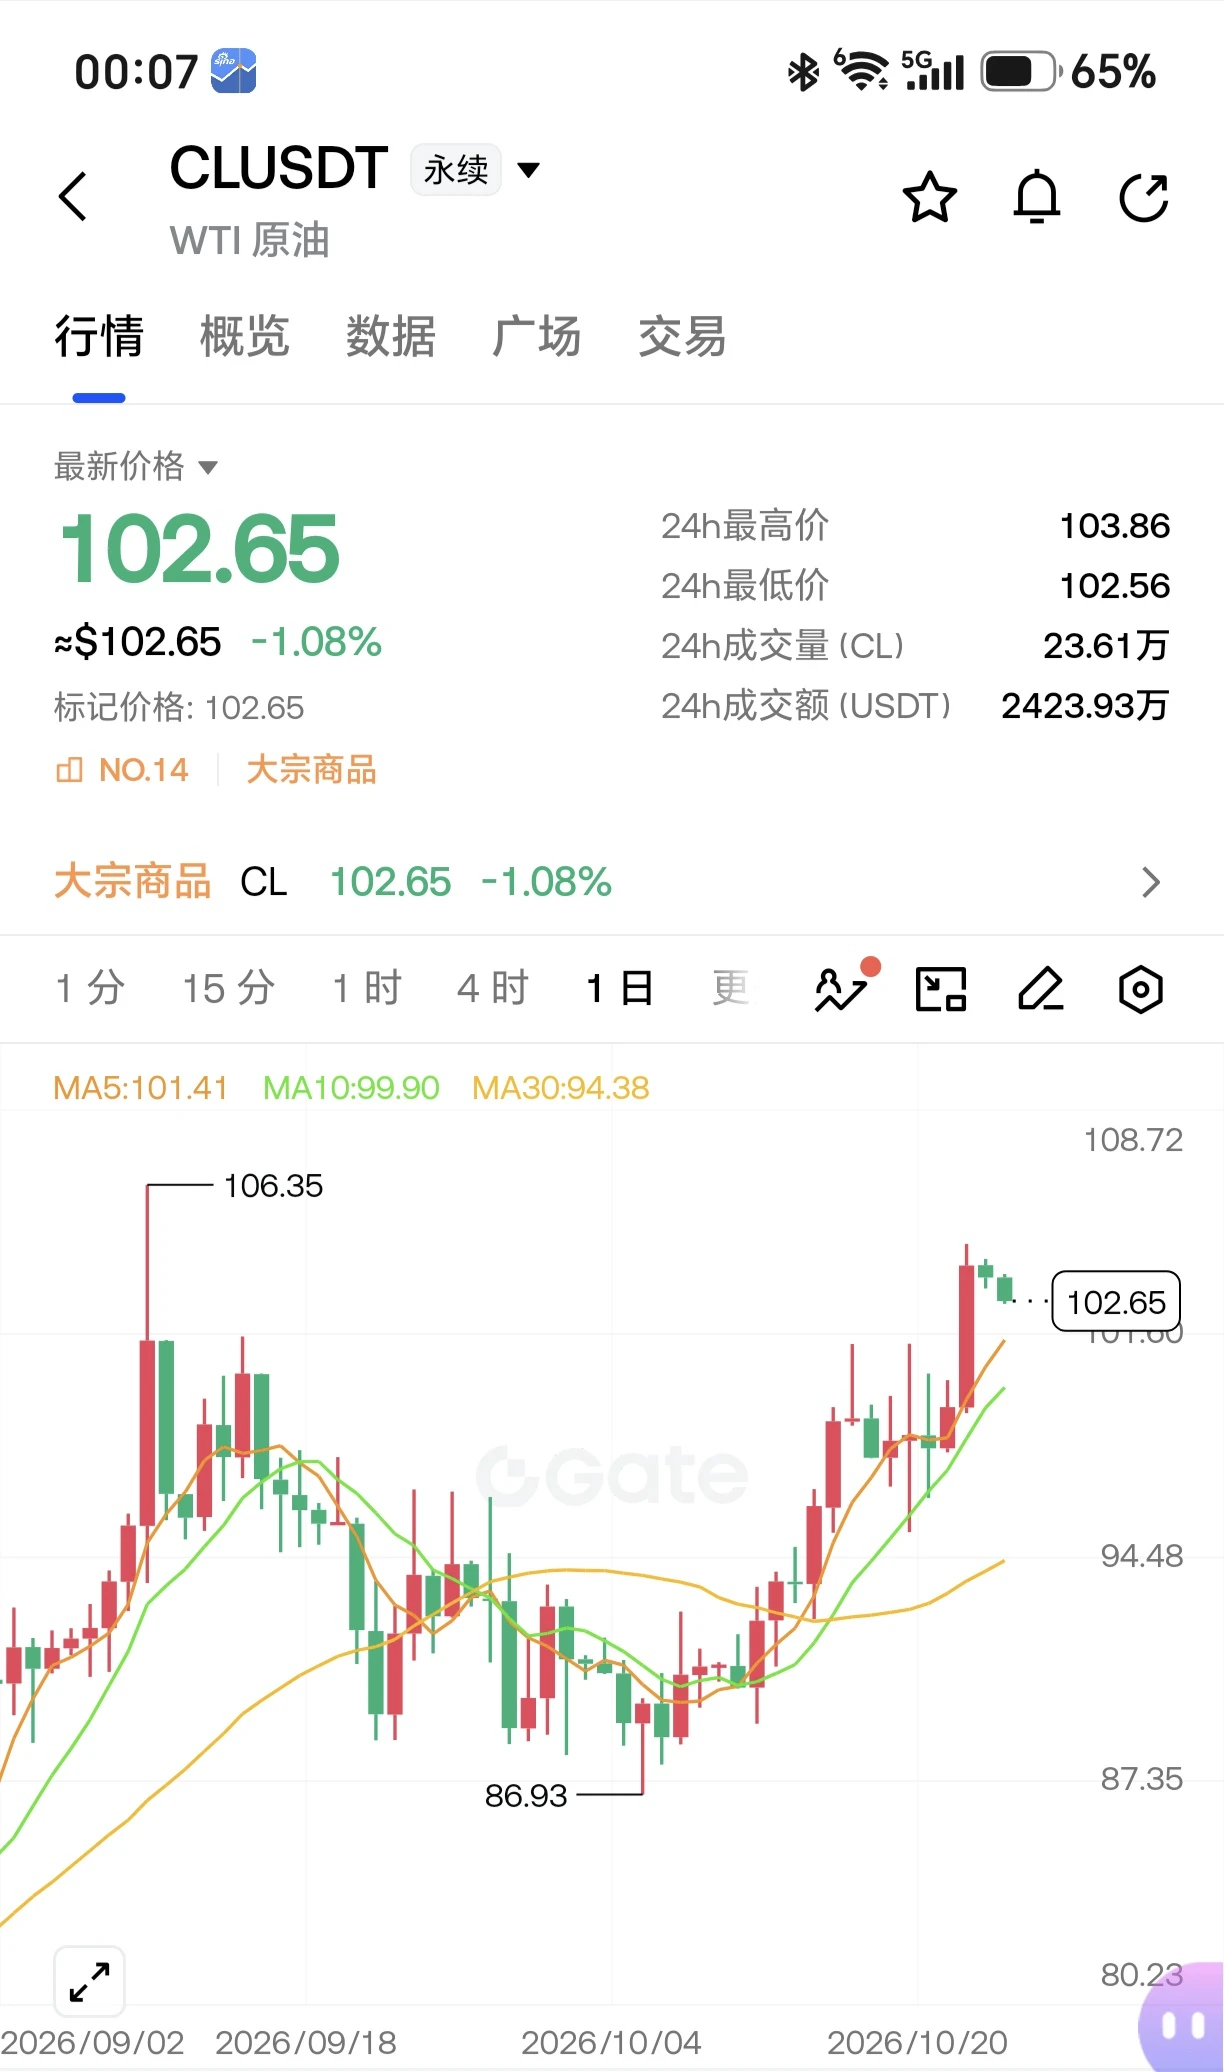
So, how is this tightening reflected in prices? As of October 23, Brent crude climbed to $117.38, reaching its highest level since March, while WTI is trading at $103.44. The real-time data shown in the visuals further confirm this picture: Brent stands at $116.97, WTI at $104.27, and natural gas at $3.073. The reason prices are holding at these levels is not merely the decline in current inventories, but also concerns regarding potential future supply disruptions. The fact that December 2027 futures contracts are priced at $87 suggests that the market anticipates tight conditions in the short term, followed by a normalization in the long term.
However, one must exercise caution here. The EIA’s projected inventory drawdown of 0.7 million barrels for the fourth quarter represents a notable slowdown compared to the 1.9 million-barrel decline seen in the third quarter. In other words, while inventories are still shrinking, the pace of this decline is decelerating. Should we see an increase in U.S. commercial inventories in the coming weeks, or an easing of supply disruptions in the Middle East, the upward pressure on prices could diminish. Conversely, if inventory drawdowns persist alongside ongoing geopolitical risks, the current tight balance will likely be maintained.
For me, as an individual investor, the most critical indicators in this landscape are the weekly EIA inventory data and shifts in the number of days of OECD commercial inventory cover. Rather than attempting to predict the direction of prices, it is far more prudent to monitor these concrete supply-side metrics. The oil market is currently in a state of "tight yet fragile" equilibrium. Any developments that disrupt this balance would have direct repercussions—not only for oil, but also for bond yields (via inflation expectations) and risk assets.
This text does not constitute investment advice.
#ShareWeekly #𝐎𝐈𝐋
repost-content-media
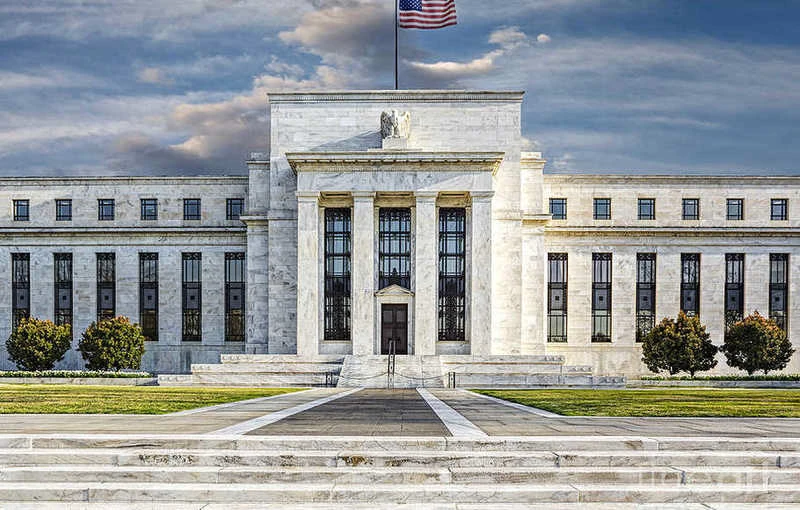
Prediction markets are pricing a 94% chance the Fed does nothing this Wednesday.
Nothing. After hot inflation prints all through September.
But the bond market is already looking past it, guys. Money markets have around an 80% chance of a hike priced in for December.
Wednesday is the trailer. December is the movie.
And Warsh has said he's done previewing decisions, right? Which means the statement and the presser carry all the weight, six days before the midterms.
What moves risk assets more this week: the decision, or what Warsh says after it?
post-image
Today's market action is unusually quiet, so quiet that it's hard to trust your own eyes.
This kind of complete calm is often the most dangerous sign before a big move begins.
The entire market seems frozen, with major coins moving up and down by just a few dozen points, grinding away at traders.
On the 4-hour chart, every time $ET tries to move higher, it gets firmly capped by the MA20 above near 2370, without even managing a decent rebound.
The reason for the weakness is straightforward—the rate-hike meeting is just around the corner, and if U.S. stocks so much as sneeze, crypto catches a f
post-image
SOL+1.66%
https://www.gate.com/competition/pumpking?ref_type=165&ch=Direct&ref=U1lHUFFZ
Join the Halloween Carnival & Pumpkin King Merge! Play daily to climb the leaderboard and grab a share of the 450,000 USDT prize pool and airdrops!
#GateWCTCS9GlobalTradingCompetition
#SolanaNonVoteTxHits8.92B
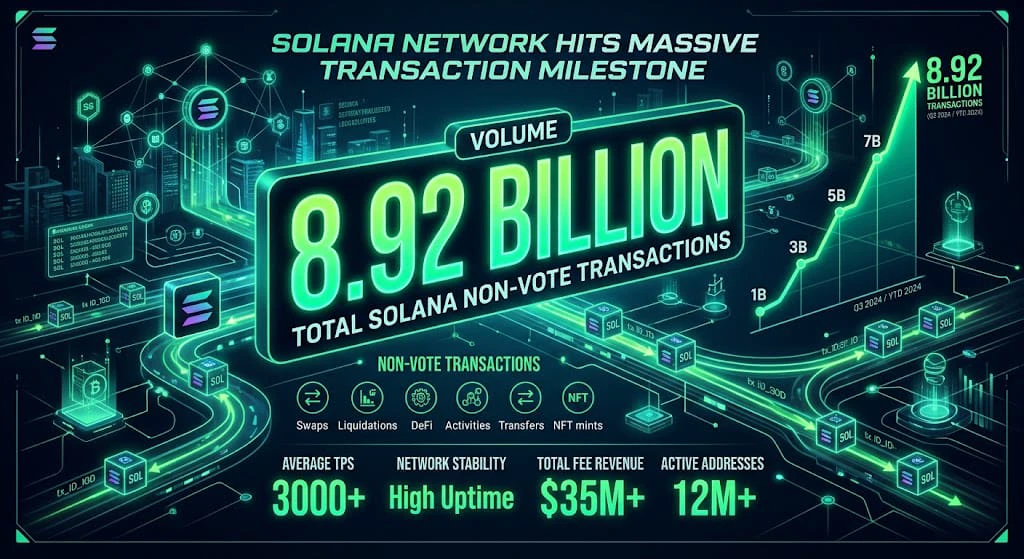
SOLANA RECORDS 8.92 BILLION NON-VOTE TRANSACTIONS — IS NETWORK ADOPTION ENTERING A NEW PHASE?
Solana is once again drawing attention across the crypto market as its reported non-vote transaction activity reached an impressive 8.92 billion transactions in Q3 2026. This milestone highlights the scale of activity taking place across one of the industry's leading high-throughput blockchain networks.
But the bigger story is not just the number itself. It is what this level of activity could mean for decentralized finance, on-chain trading, payments, decentralized applica
post-image
CryptoEye
#SolanaNonVoteTxHits8.92B
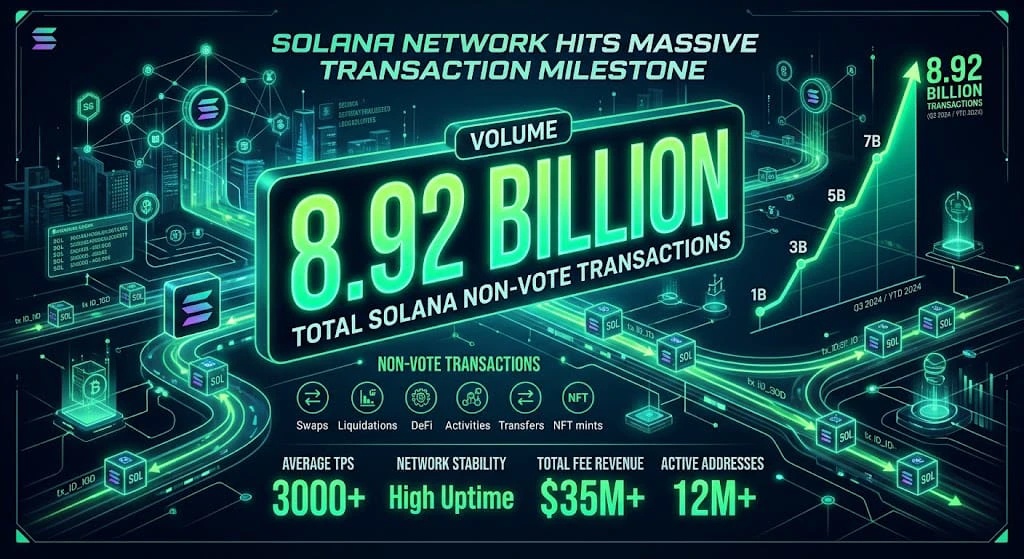
SOLANA RECORDS 8.92 BILLION NON-VOTE TRANSACTIONS — IS NETWORK ADOPTION ENTERING A NEW PHASE?
Solana is once again drawing attention across the crypto market as its reported non-vote transaction activity reached an impressive 8.92 billion transactions in Q3 2026. This milestone highlights the scale of activity taking place across one of the industry's leading high-throughput blockchain networks.
But the bigger story is not just the number itself. It is what this level of activity could mean for decentralized finance, on-chain trading, payments, decentralized applications, and the long-term investment narrative surrounding SOL.
According to Solana's published figures, the Q3 total was approximately 104% higher than Q4 2025, more than doubling over that comparison period. However, this is not quarter-over-quarter growth. Independent Solana Compass data recorded 8.78 billion completed non-vote transactions in Q3, up 23.3% from Q2, illustrating both the strong trend and differences between data providers.
📊 What Are Non-Vote Transactions?
Solana validators exchange vote transactions to help maintain consensus and secure the blockchain. Non-vote transactions exclude these validator votes and capture activity such as token transfers, swaps, and interactions with decentralized applications.
This distinction matters because non-vote activity gives investors a more useful view of application-level blockchain usage than a figure dominated by validator consensus operations.
Nevertheless, transaction counts are not a perfect measure of adoption. Automated trading bots, arbitrage strategies, and repeated transactions can contribute significantly to network activity. Therefore, a record number of transactions does not automatically mean a proportional increase in unique users or economic value.
🔥 Why Is Solana Attracting Attention?
Solana's appeal comes from its high throughput, relatively low transaction costs, and active ecosystem of trading applications.
Decentralized exchanges allow users to trade tokens directly on-chain, while DeFi protocols support lending, borrowing, and liquidity provision. Stablecoin transfers and emerging tokenized assets provide additional potential use cases.
As blockchain applications compete for users, networks that can process large numbers of transactions efficiently may have an advantage. Solana's latest quarterly figures reinforce its position as a significant player in this competition.
The next challenge is converting activity into sustainable economic value through real users, meaningful transactions, application revenue, and continued developer participation.
💰 What Does This Mean for SOL's Price?
Strong network activity can support a positive long-term investment narrative, but it does not guarantee an immediate price increase.
A bullish scenario could develop if transaction growth is accompanied by rising stablecoin usage, healthy DeFi liquidity, stronger application revenue, and improving market sentiment. These factors could strengthen confidence in Solana's ecosystem.
A bearish scenario remains possible if SOL faces broader crypto-market weakness, speculative activity declines, liquidity deteriorates, or network growth fails to translate into sustainable demand.
Investors should therefore examine network activity alongside SOL's price action, trading volume, market capitalization, and broader Bitcoin market direction.
🔍 Key Metrics to Watch Next
The most important indicators include successful transactions, unique active addresses, transaction fees, DeFi total value locked, stablecoin supply, decentralized exchange volume, and developer activity.
It is also worth tracking how Solana's protocol upgrades affect finality and performance. Improvements in network efficiency could support future adoption, although their benefits must be assessed through actual network performance rather than expectations alone.
📈 My Outlook: Cautiously Bullish on Network Fundamentals
Solana's 8.92 billion reported non-vote transactions represent a significant activity milestone. The data suggests that the network continues to support substantial on-chain usage, while the independent figures also demonstrate why consistent measurement standards matter.
My outlook is cautiously bullish on Solana's long-term ecosystem potential, provided that transaction growth is accompanied by stronger organic demand and sustainable economic activity. Short-term SOL price movements, however, remain uncertain and will depend on liquidity, investor sentiment, and the wider crypto market.
Final Thought: A blockchain's success should not be measured by transaction counts alone. The real test is whether it can transform high throughput into useful applications, lasting adoption, and economic value.
Solana has demonstrated impressive activity. The next milestone is proving how much of that activity translates into sustainable growth.
#Solana #SOL
repost-content-media
SOL+1.66%
BTC+0.81%
#SpotGoldFallsBelow4000 🥇📉
Spot Gold Falls Below $4,000 — The Market Is Repricing Risk
Gold breaking below a major psychological level is more than just another price move.
When spot gold falls below $4,000, investors immediately start looking beyond the metal itself.
Gold has traditionally been viewed as a store of value, a defensive asset and a hedge against uncertainty.
So when gold experiences a sharp decline after reaching historically elevated levels, the bigger question becomes:
What is changing in global investor positioning?
The answer could involve interest-rate expectations, profi
BTC+0.81%
BTC , ETH, GT
live-cover
LIVE1,641
Crude oil at 103? Isn’t this just handing everyone a gift?
Just short it! This is free money! $CL
post-image
CL-1.35%
Load More

Join 40 M users in our growing community

⚡️ Join 40 M users in the crypto craze discussion

💬 Engage with your favorite top creators

👍 See what interests you

Trending Topics

USEarningsSeason

99.7k Views3.52k Discussing

The U.S. Q3 earnings season is in full swing, with major tech companies including Tesla and Meta reporting results. Market focus is shifting beyond revenue and profit toward AI spending, capital expenditure, margins and forward guidance. Which company’s earnings are you watching most closely?

GateWCTCS9GlobalTradingCompetition

720.76k Views8.08k Discussing

USConsumerSentimentNearRecordLow

12.12k Views299 Discussing

View More