




Share your thoughts
placeholder
Article
Thank you for your help; my growth is entirely thanks to your support and encouragement.
post-image
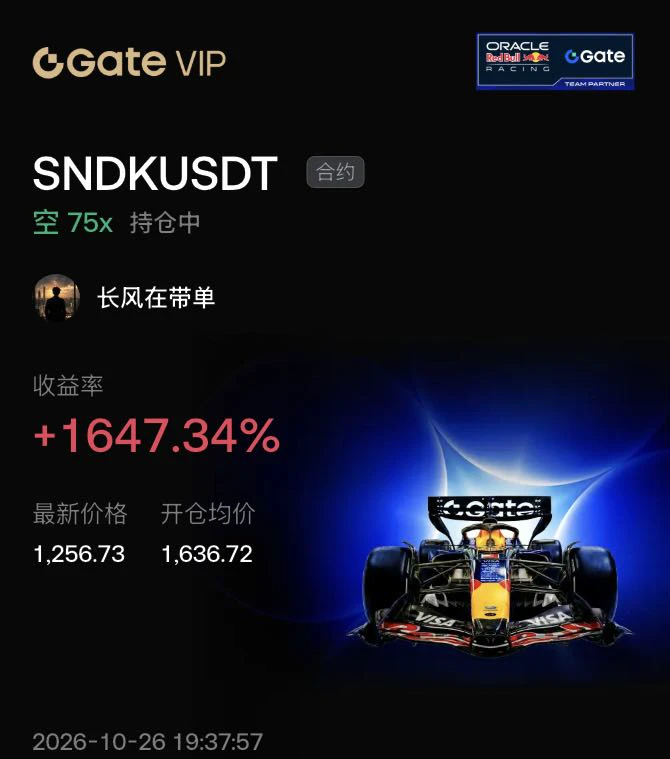
With this trend, I don’t even need to think—the account is dancing on its own. When the market kept fluctuating intraday, everyone thought there was no chance. I watched the chart grind along a bottom without breaking down, and I knew what was up: if it holds steady, the gains will come. $ZEC is now at 1229.93 from 857.01, up +3090.33%. The beginning was truly sluggish, but the result is truly sweet. The market is waited out, and profits are held onto. Have a strategy before the market opens, discipline during trading, and reflection after the close. I’ll take 75% off the table for now, and p
post-image
ZEC+22.69%
BTC+0.05%
LAB-4.68%
$ETH Signal】1H triangle convergence + 4H bullish buildup, targeting the breakout
$ETH 1H Bollinger Bands have narrowed to 2478-2514, marking a short-term decision point. The 4H MACD histogram is contracting, but bullish momentum remains. Order book depth imbalance: -7.24%, with aggressive buyers holding a slight edge. Funding rate: 0.0044%, with no signs of overheating. OI is stable, and holders remain calm.
🎯Direction: Long
⚡Entry/Limit order: 2488.4424 - 2494.7300
🛑Stop-loss: 2469.7827
🚀Target 1: 2532.1509
🚀Target 2: 2550.8614
🛡️Trade management:
- Execution strategy: After reaching Ta
post-image
ETH+0.73%
What can be the AMC top? I’m a bit conflicted.
post-image
AMC-1.11%
Everyone’s staring at FLOCK’s 4h chart—but the real trap is hiding in the 15m RSI.

$FLOCK /USDT - SHORT

Trade Plan:
Entry: 0.07274 – 0.07490
SL: 0.08417
TP1: 0.06605
TP2: 0.06088
TP3: 0.05311

Why this setup?
Why now? The 1D trend is *range*, not breakout. Your 4h bias is SHORT at 0.07382, but the 15m RSI (52.97) shows a weak bounce—not a reversal. ATR (0.0043) is thin, meaning price can slide silently.
- Entry zone: 0.07274–0.07490 (wait for the fill).
- TP1 at 0.06605 is a 10% drop—no news needed.
- If we lose 0.05176, the thesis is dead. Don’t marry the trade.

Debate:
Is FLOCK’
FLOCK+21.39%
$MARA
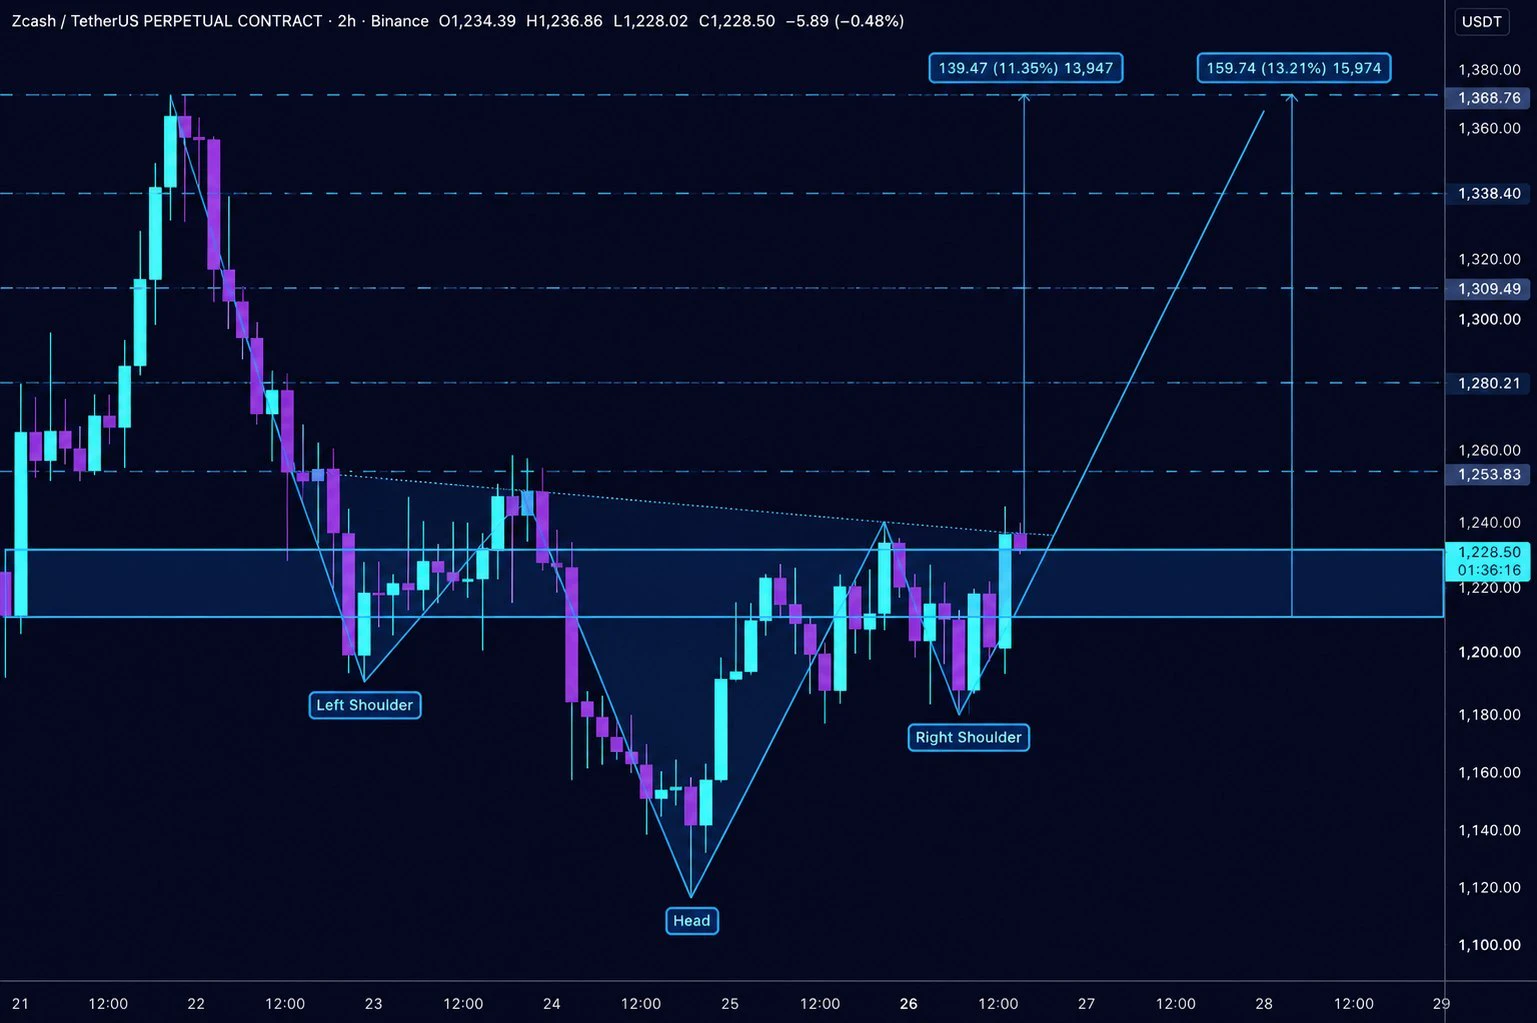
It gave me the impression that it may be forming an inverse H+S in this area
post-image
MARA-2.41%
$ARB Signal】1H pullback to EMA20 + 4H bullish continuation
$ARB 1H pullback to EMA20, current price 0.18475; the 4H MACD histogram at 0.0032 is narrowing. Order book imbalance is -4.41%, 1H RSI 55.35 is neutral, funding rate is 0.0065%, OI is stable, and short-term leverage is not crowded. The 1H MACD negative histogram is contracting, with price consolidating between 0.1805-0.1850.
🎯Direction: Long
⚡Entry/Limit Order: 0.1841957 - 0.1847500
🛑Stop Loss: 0.1755125
🚀Target 1: 0.1986063
🚀Target 2: 0.2055344
🛡️Trade Management:
- Execution Strategy: After reaching Target 1, reduce the positio
ARB+10.24%
#Gate60MillionUsers
60 MILLION USERS.
60 MILLION STORIES.
BUT TODAY, I WANT TO TELL YOU MINE. 💙🔥
When Gate officially reached the incredible milestone of 60 MILLION global users, I didn't see it as just another number on a celebration banner.
I stopped for a moment and thought about what that number actually represents.
60 million people.
60 million different journeys.
60 million different reasons for entering crypto.
60 million different dreams, mistakes, lessons, opportunities and unforgettable moments.
Behind every account is a person.
Someone who discovered Bitcoin for the first time.
S
post-image
$RAYSOL 24-hour gain of 44.9%, but the current price of 1.2625 has already retraced 12% from the high of 1.4422—you think it’s an entry opportunity, but I’m telling you this big bullish candle is most likely a bull trap before a long squeeze. Trading volume of 400 million looks lively, but the retreat after the price spike shows that someone was aggressively selling above 1.44. There is no financial news supporting it today; it’s purely a sentiment-driven move. This type of coin is the most dangerous—the pump relies entirely on momentum, and once that momentum breaks, the price will cascade.
T
After $FARTCOIN rallied, I didn’t exit my entire position. I took 80% in profits first and moved the protective stop on the remaining position above breakeven. Just now, a quick pullback took out the remaining position, locking in the profits smoothly.

The entry reason was simple: on the hourly timeframe, price pulled back to the previous high without continuing lower, and instead reclaimed the area above the moving average on rising volume. This was a textbook pullback confirmation. After going long, I kept my stop loss below the lower boundary of the small range.

After the pullback took
post-image
FARTCOIN+3.15%
SNDK+1.18%
ZEC+22.69%
Clippers are already earning on MMM
if you're a clipper and know how to make content go viral
my DMs are open
post-image
ETHFİ alltime high hype ath pump pump bigpump let’s go
post-image
HYPE+2.67%
PUMP+0.81%
BIGPUMP-3.96%
Everyone is staring at ADA’s green 15-min RSI, but the 4h tape just whispered something darker.

$ADA /USDT - SHORT

Trade Plan:
Entry: 0.2212 – 0.2224
SL: 0.2274
TP1: 0.2176
TP2: 0.2148
TP3: 0.2105

Why this setup?
Why now? The daily trend is range-bound, which means mean reversion is the game. RSI(15m) at 63 is a local overheat, not a breakout signal. ATR(1h) is thin at 0.0023, so the short squeeze fuel is low. We’re sitting at 0.2218 with a clear invalidation at 0.2133. If we reject 0.2224, the path to TP1 (0.2176) and TP2 (0.2148) is a straight line down. The 55 confidence score says "p
post-image
ADA+0.50%
[New Streamer] Market Prediction
live-cover
LIVE61
This trend is so obvious I don’t even need to think—the account is dancing on its own💃 I had just opened the charts this morning and saw $APT make another surge, but that move clearly lacked momentum. Every rebound stalled at the same level, while volume kept shrinking—classic clear overhead resistance. This kind of move isn’t a breakout; it’s looking for short sellers to take the other side👍
I placed a short order before the market had fully started, entering at 0.9133. It’s now at 0.6162, with +2309.76% secured, brothers. This move wasn’t about luck—it was about spotting at a glance that i
post-image
APT+0.26%
ETH+0.73%
ZEC+22.69%
Everyone is focused on Bitcoin’s weekly close $BTC
, while I’m focused on taking profits in altcoins 💲🤑
The idea of all coins forming a new bottom has become a distant dream
You took the bait, my bear-market friend... you took the bait 😘
post-image
BTC+0.01%
#BTC Morgan Stanley is quietly buying Bitcoin, while market makers are opening short positions—which side are you on?
On one side, traditional financial giants are adding to their Bitcoin holdings with real money; on the other, crypto market makers are aggressively opening short positions on-chain. The same market, two completely opposite bets.
On September 5, these two pieces of news emerged almost simultaneously, once again putting the question of whether institutions are actually bullish in the spotlight.
① Morgan Stanley: 355 BTC bought in 4 days According to on-chain monitoring, Morgan St
post-image
BTC+0.01%
ETH+0.67%
HYPE+2.66%
ASST+1.21%
BMNR-5.48%
Most traders just bought MARSCOIN at 0.18987—that’s exactly why I’m not touching it yet.

$MARSCOIN /USDT - SHORT

Trade Plan:
Entry: N/A – N/A
SL: N/A
TP1: N/A
TP2: N/A
TP3: N/A

Why this setup?
Why the hesitation?
- 1D trend is a *range*, not a breakout—so upside is capped.
- 4h bias flips SHORT at 55% confidence: the market is telling us longs are late.
- RSI 15m at 54.47 shows a weak bounce, not momentum—buyers are exhausted.
- Entry ref is 0.18987, but with no TP/SL defined, you’re gambling on hope, not edge.
The "why now?" is simple: range tops punish aggressive entries. Wai
MARSCOIN-21.53%
Load More

Join 40 M users in our growing community

⚡️ Join 40 M users in the crypto craze discussion

💬 Engage with your favorite top creators

👍 See what interests you

View More