Share your thoughts
placeholder
Article
$PI , keep it up. Wait another 10 years.
post-image
PI+1.36%
Most likely #BTC Elliott Wave interpretation imo, is:
W completed $59,930.
X completed near $82,833.
Wave A of Y completed near $58,000.
The current rally toward $82,000 is wave B of Y.
Wave C of Y would then be the next decline, potentially only travelling toward the lower channel boundary.
The rejection area is strengthened by three factors:
Price is testing the upper boundary of the descending channel.
The rally appears corrective and overlapping.
Price has made a lower high while weekly RSI has made a higher high being consistent with hidden bearish divergence.
post-image
BTC+0.03%
BTC and ETH Enter a Tight Range! A Major Break Could Be Coming Next
live-cover
LIVE372
Core Inflation Stays Firm, Could Traders Reassess The Timing Of Future Fed Policy Changes?
live-cover
LIVE675
$TA Signal】Long + 1H pullback to EMA20 confirmation
$TA 1H pullback to EMA20_1H, 4H MACD histogram expanding at 0.0013, with a bullish short-term structure. Current price 0.05885, 24h gain 23.92%, funding rate 0.0092%, OI stable. RSI 1H at 63.30 and 4H at 61.29, with hot-coin momentum still intact. The 1H MACD histogram is narrowing, and momentum for chasing gains is weakening. The order book buy/sell ratio is 0.94, with depth imbalance at -3.30%, so downside buying support does not have an absolute advantage. The risk-reward ratio at this level is 1.50, with the stop loss approximately 1.0%
post-image
TA+22.69%
BTC+0.03%
ETH-0.72%
SOL+0.66%
Went on a little hike today ☀️
I was just about to go to the forum and rant, but then I saw my balance and decided to forget it—the market is always right🙏.
Since the topping process began, I’ve been watching $BTR . Every intraday push fell just short, and the volume visibly shrank, making it obvious that overhead resistance was heavy. A few afternoons ago, I decisively opened a short at 0.20941 and reminded everyone not to chase longs. When I opened the chart this morning, the price had already dropped to 0.04975, with floating gains of +1500.83%. Nailed the rhythm on this one🎯.
Take profits when it’s time. I closed 80% f
post-image
BTR-4.64%
LAB-13.83%
BTC+0.07%
Everyone is ignoring this bearish setup on $H /USDT right now.

$H /USDT - SHORT

Trade Plan:
Entry: 0.08168 – 0.08274
SL: 0.08730
TP1: 0.07839
TP2: 0.07584
TP3: 0.07202

Why this setup?
Why now? The daily trend is bearish, the 1h price sits at 0.08220, the 15m RSI is 38.37, the 1h ATR is 0.002122 and the entry zone sits at 0.08221. The bearish trend sets the macro direction, the low RSI shows momentum is already weak and the 1h ATR tells us the recent volatility is small enough to target a clean move. The entry zone gives the precise trigger, TP1 at 0.07839 and TP2 at 0.07584 define the pr
H+0.61%
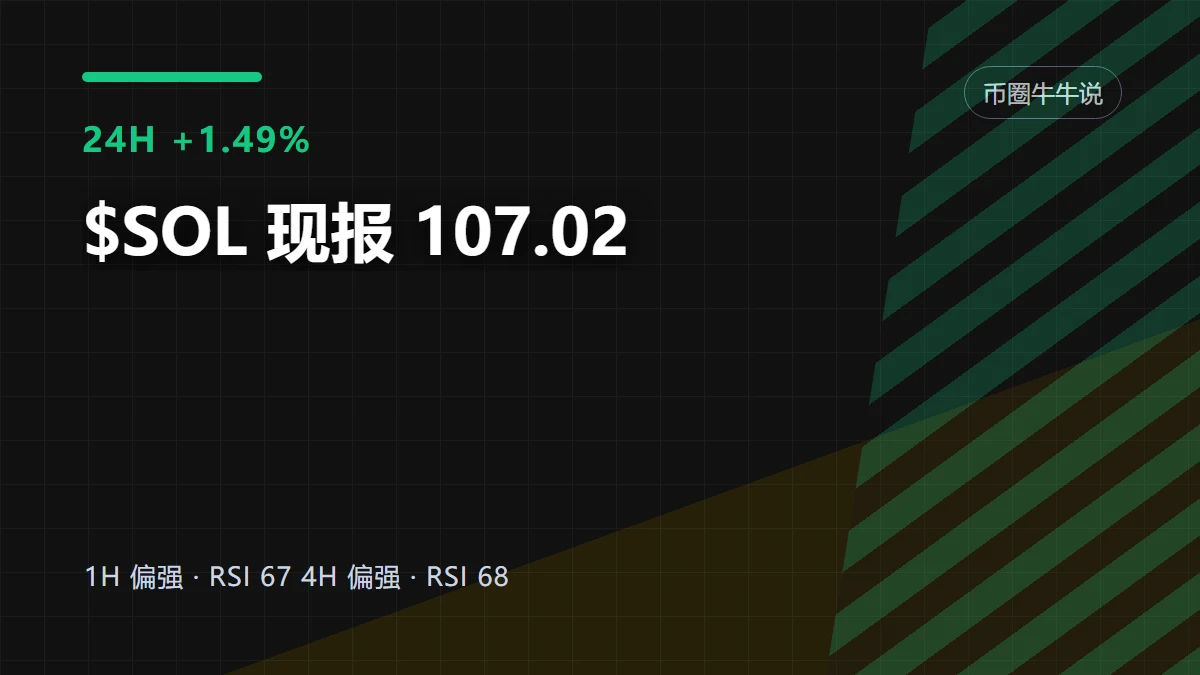
$SOL I’m bearish on this move. The retail long/short account ratio rose from 2.0637 to 2.3411, while large-holder positioning declined from 2.0765 to 2.0624 over the same period: retail traders are adding longs during the sideways action, while large holders are quietly reducing longs. The funding rate fell from 0.0051% to 0.0015% over three periods; more traders are long, yet no one is willing to pay for leverage. $810 million in open interest is crowded into the narrow 100.3–103.11 range. If the lower bound breaks, retail longs will be the fuel. Conditions for turning bullish: large-holder p
post-image
SOL+0.71%
Long-term #Bitcoin investors are signaling an impending major breakout.
According to our research, the Long-Term Supply Price (LTH SOPR) is holding around 1.2, which is similar to previous phases where Bitcoin entered a re-accumulation phase after major corrections.
Historically, when this indicator falls to around 1, profit-taking pressure from long-term holders weakens significantly, with some supply even being sold below cost.
On the other hand, LTH SOPR breaking out of lows and beginning a recovery often precedes new price expansion phases.
If LTH SOPR continues to recover and surpasses 1.
post-image
BTC+0.03%
🐋 WHALE WATCH : BTC price sits below its previous peak. Open Interest has recovered to cycle highs. Volume hasnt followed.
Thats a lot of leverage building under a price that hasnt broken out. Long or short one strong move forces mass position closures and amplifies whatever direction BTC picks.
The market is coiling. The direction is unknown. The volatility when it comes wont be.
post-image
BTC+0.07%
#SenateReleasesNewCLARITYAct
The CLARITY Act is entering the week where the headline matters less than the vote count.
The U.S. Senate has released an updated version of the CLARITY Act, and the next major checkpoint is the September 15 procedural vote.
For crypto traders, this is important for a simple reason: the bill needs 60 Senate votes to move forward. Republicans hold 53 seats, which means the legislation cannot advance on Republican votes alone. Democrats would need to provide enough support for the bill to cross that threshold.
That immediately turns the story into a question of bipa
BTC+0.03%
TOKEN-3.16%
The Fed decision is only half the story. Liquidity is the real signal.
A hike could put short-term pressure on $BTC toward/below $76K. No hike could help the current uptrend continue.
But watch what happens next:
DXY + yields ↑ → liquidity tightens → BTC faces pressure.
DXY + yields ↓ → liquidity improves → risk assets gain support.
$76K is a scenario, not a guaranteed floor.
For $BTC , the real question is: what happens to liquidity after the Fed decision?
#Bitcoin #BTC #Crypto
post-image
BTC+0.03%
  • 1
No operation, no analysis, just sheer luck—an order I placed a few days ago actually filled itself. At the time, I saw $SOL rebound to a key level and stall; volume failed to follow through, and support was insufficient. With this kind of trend, even if it doesn’t fall, it won’t rise. I set the stop-loss before bed and executed according to plan, entering a short position. Now at 101.98, the unrealized profit is +130.33%. I’m embarrassed to even mention this result. It really wasn’t because I read the market correctly—it was a gift from the market. I’ll take most of the profits off the table
post-image
SOL+0.71%
BNB+0.66%
BTC+0.07%
$SOL Signal】Long|1H pullback support, 4H upper band awaiting breakout
$SOL 1H-level pullback confirmed, trading above the 4H middle band at 101.1155. Order-book depth imbalance +20.21%, Bid/Ask 1.51, with clear support at 101.64-101.95. 4H MACD histogram +0.2707, with the two lines converging below the zero axis; 1H MACD histogram -0.0356 expanding, with short-term selling pressure still present. Funding rate 0.0028%, OI Stable, low leverage crowding. This pullback offers a favorable risk-reward ratio. Set the stop-loss at 100.9305, with the first target near the 4H upper band at 103.5646. Do
post-image
SOL+0.71%
TA has low circulating supply. There is no event today that can independently explain it; the gainers list is overflowing.
$TA
post-image
TA+22.69%
A few days ago, the stop-loss I nervously canceled looks like it spared me today.
A few days ago in the afternoon, $TUT 's rebound was weak, volume failed to follow, and no one was buying into the rise. I watched the chart and judged that the highs were under pressure, entering a short at 0.034866.
It ground all the way down to 0.020092, yielding +420.52%. That was a satisfying bite of profit.
Managing risk upfront is called rationality; cutting after taking losses is called bravely severing a limb.
Staying out of the market is not a sin; opening positions recklessly is the mistake.
Close 80%
post-image
TUT+0.92%
XRP+1.16%
ADA+1.57%
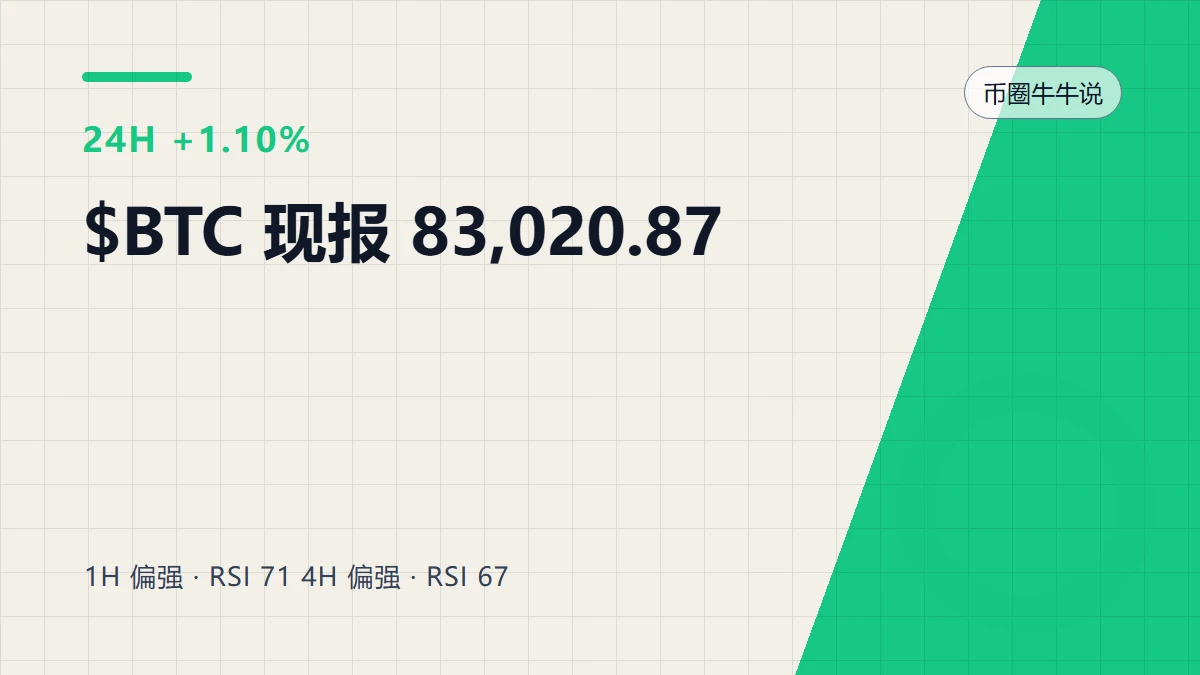
$BTC Signal】1H under pressure + order-book selling pressure, bearish attack
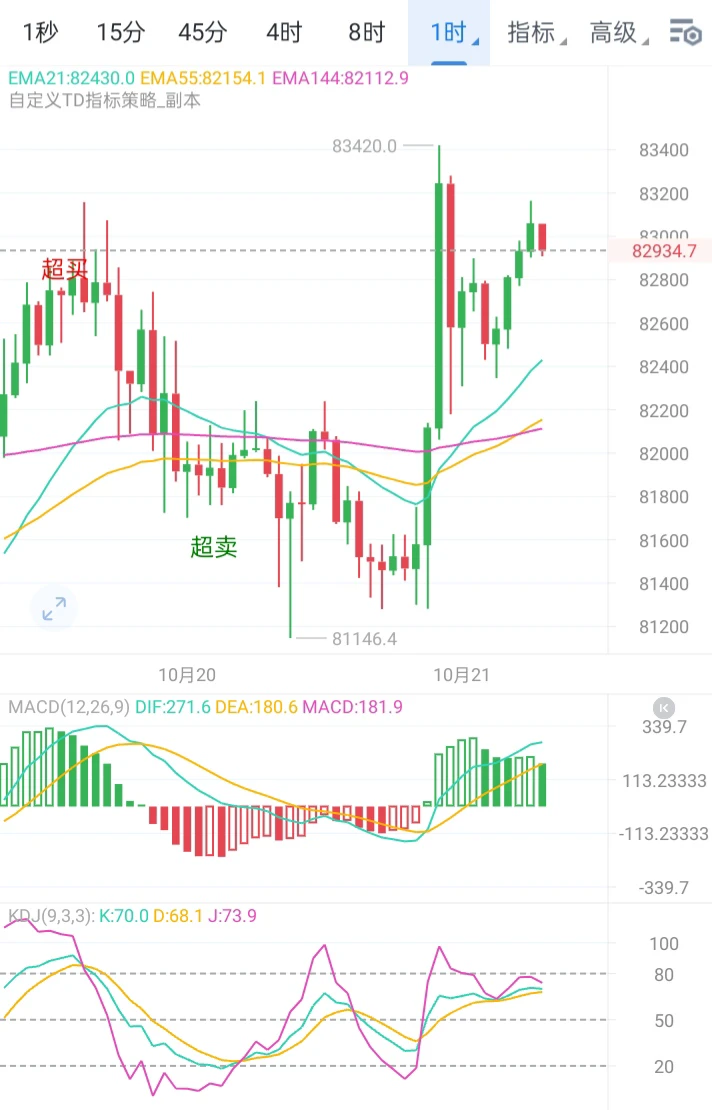
$BTC 1H Bollinger Bands narrowing, price hugging the lower band at 77128.3506, RSI 44.23, 1H MACD bearish crossover, histogram -3.2052. The 4H MACD histogram shortened to 53.8022, with bullish momentum fading. Order-book Bid/Ask 12.70, depth imbalance 85.40%, buy-side limit orders are thick, but the price cannot be pushed higher, while selling pressure continues to fill orders. The 4H candle closed at 77153.6, buy/sell ratio 0.39, late-stage 1H buy/sell ratio 0.33, with active selling prevailing. EMA20 1H at 77293.794
post-image
BTC+0.07%
Could this unexpected inflation uptick completely derail the recent momentum across crypto markets? Honestly, I was expecting a softer inflation reading, but August Core CPI coming in at 0.3% hotter than expected caught me off guard. That unexpected bump puts potential rate hikes back on the table according to recent signals from Fed Chair Kevin Warsh. 🚨 I have been watching $BTC closely over the past few hours, and you can clearly feel the tension as traders scramble to adjust their risk models. When macro liquidity gets threatened, crypto tends to feel the squeeze first. Whether this turns
post-image
BTC+0.03%
Nobody is talking about the quiet setup forming in SOXL right now.

$SOXL /USDT - SHORT

Trade Plan:
Entry: 122.19 – 122.59
SL: 124.32
TP1: 120.95
TP2: 119.98
TP3: 118.54

Why this setup?
Why now? The 1h price sits at 122.39 inside a tight entry zone between 122.19 and 122.59, and the 1h ATR of 0.802559 signals compressed volatility that often precedes a sharp move. The 15m RSI at 48.72 shows neither overbought nor oversold, leaving room for a directional break. The daily trend is range, which means a breakdown from this entry zone has a high probability of accelerating toward the first tar
SOXL+0.20%
Load More

Join 40 M users in our growing community

⚡️ Join 40 M users in the crypto craze discussion

💬 Engage with your favorite top creators

👍 See what interests you