Share your thoughts
placeholder
Article
#交易機器人 I’m using the DOGEUSDT futures grid bot on Gate—come copy-trade with me!
post-image
$SOL Signal】1H breakout + fund flow confirmation
$SOL The 1H candlestick broke through 104.37, with volume expanding simultaneously. The MACD bullish histogram continues to expand, RSI is hovering around 58, and the funding rate remains normal at 0.0032%. Buy orders account for 56% of the order book, with a depth imbalance of 6.07%, giving bulls the initiative. The 4H Bollinger upper band at 105.69 provides a breakout reference, while EMA20/50 support is moving higher. The current price is close to the target range.
🎯Direction: Long
⚡Entry/limit order: 103.5584 - 103.8700
🛑Stop-loss: 102.83
post-image
SOL+1.87%
BTC+0.17%
ETH+0.88%
I only meant to snag a free breakfast, but the market ended up making dumplings out of me for half a year.
When $BE was grinding along around 200.9 intraday, it stayed flat long enough to nearly put me to sleep, but there was clearly buying support below and the low-volume selling couldn’t push it down. I judged that the bottom was solidified and entered a long position directly, without hesitation.
I just checked the chart, and the price has already surged to 265.1, +1537.65%. This bite of meat feels great—those already on board should have woken up laughing.
Take 80% off the table first, an
post-image
BE+7.02%
ZEC-0.74%
SNDK+3.22%
This week brought new releases from OpenAI (GPT-6 Astra), Anthropic (Claude Fable 5.1 and Mythos 5.1), and Google (Gemini 3.8 Flash), expanding what AI can do in coding, research, cybersecurity, and tool use.
Working with AI saves time and lets us attempt things we could hardly tackle alone.
Yet a photograph of a sunset rarely feels like being there. It keeps the colors, but not the breeze, the silence shared with someone beside us, or the feeling that made us stop. The photo is not wrong. It just cannot hold the whole evening.
Something similar can happen when we work with AI. We get faster,
post-image
TOWN+1.80%
  • 1
  • 1
Everyone is long LINK while the 4h chart whispers a different story.

$LINK /USDT - SHORT

Trade Plan:
Entry: 12.056 – 12.108
SL: 12.401
TP1: 11.843
TP2: 11.684
TP3: 11.445

Why this setup?
Why now?
- 1D trend is bullish, but the 4h signal says SHORT with 84% confidence—that’s a serious divergence.
- RSI on the 15m is at 62.54, showing short-term momentum is cooling off right at the 12.082 resistance zone.
- ATR (1h) at 0.102 means tight stops—we’re coiling, and the first target is 11.843, a quick 2% move if the rejection holds.
- The setup is waiting, not triggered—so the risk/rewa
LINK+2.85%
I just casually hit refresh, and it went up on its own, leaving me in a very passive position. $BCH was incredibly decisive this time. After placing the order at 247.31, I barely checked it. The last time I looked before bed, it was still moving sideways, but now it’s directly showing 257.68, with a +294.29% profit. It feels like the market is chasing me to feed me.

I noticed it during the repeated intraday swings: someone stepped in to buy every dip, and the key levels were gradually moving higher. If that wasn’t a shakeout, what was it? I even specifically mentioned at the time: the more s
post-image
BCH+1.34%
BNB+7.68%
ETH+0.89%
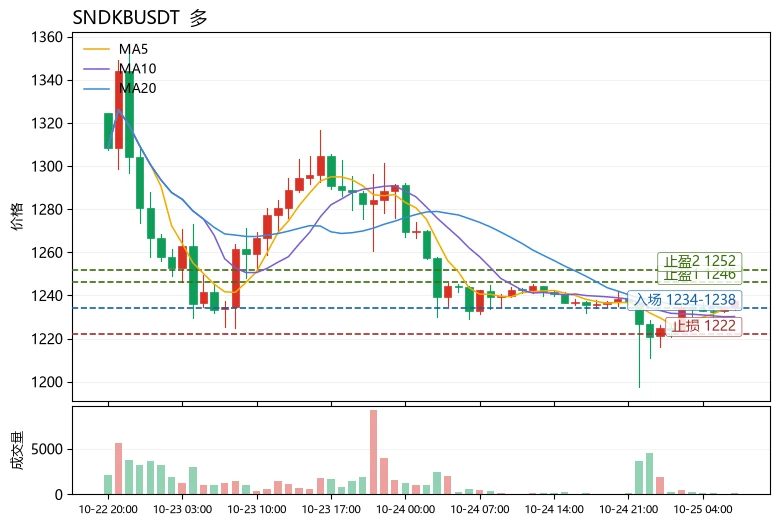
Everyone’s long SNDK, but the 4h chart just whispered a secret the crowd missed.

$SNDK /USDT - SHORT

Trade Plan:
Entry: 1762.72 – 1768.80
SL: 1794.96
TP1: 1743.86
TP2: 1729.26
TP3: 1707.36

Why this setup?
- RSI 15m at 62.25 shows fading momentum, not strength.
- ATR 1h at 12.16 means volatility is tight—waiting to snap.
- Price pinned at 1765.76 with TP1 at 1743.86: a clean 1.2% drop zone, no noise.
- Why now? Range-bound 1D trend + SHORT bias = mean reversion is the only game in town.

Debate:
Is the 1768.80 high the bull trap that sends us to TP1, or do we fade the fade?

⚠️ Pe
SNDK+3.22%
Everyone’s long XRP at 1.42, but the 15-minute RSI just screamed 72—who’s the exit liquidity?

$XRP /USDT - SHORT

Trade Plan:
Entry: 1.4192 – 1.4238
SL: 1.4432
TP1: 1.4052
TP2: 1.3944
TP3: 1.3781

Why this setup?
XRP is stalling inside a 1D range, and the 4h signal flips SHORT at 1.4215.
- RSI (15m) at 72.61 = overheated, ripe for a snap-back.
- ATR (1h) is razor-thin (0.009) → volatility is coiling; the first push often fails.
- Entry zone 1.4192–1.4238 is a magnet, but TP1 at 1.4052 offers a 1.1% scalp *before* the daily trend decides.
Why now? The clock says 18:14 UTC—liquidity
XRP+1.06%
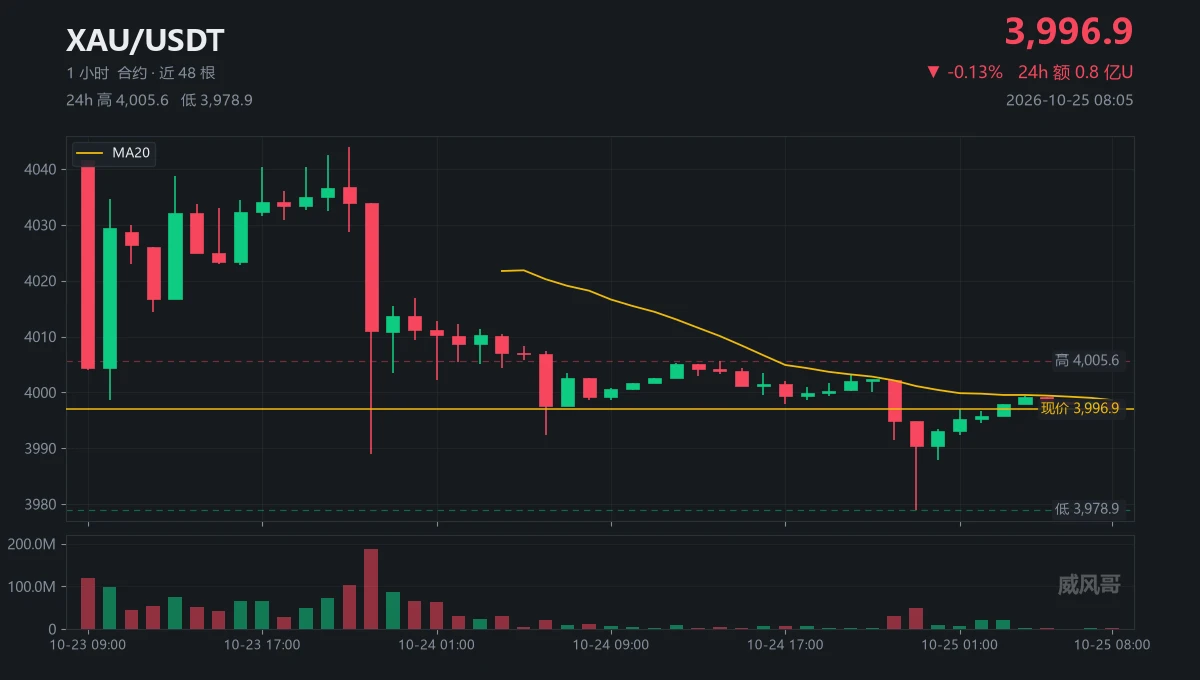
Everyone’s watching gold, but the 4H chart just whispered a secret $XAU /USDT trade nobody’s tweeting yet.

$XAU /USDT - SHORT

Trade Plan:
Entry: 4438.00 – 4441.62
SL: 4457.23
TP1: 4426.74
TP2: 4418.03
TP3: 4404.97

Why this setup?
- The bias is SHORT at 55.4 confidence, but the 1D trend is still *range* — this isn’t a breakout, it’s a trap door.
- RSI on the 15m is at 59.75 — not overbought, but the bounce is losing steam right below the 4439.81 reference.
- ATR (1h) at 7.25 means the move is fast — waiting for a lower-high rejection at 4441.62 gives you 3 targets down to 4404.97 befo
XAU+0.14%
WHO IS READY FOR THIS?
post-image
Financial News, Crypto Updates, Real-World Strategies
live-cover
LIVE1,242
$SOL Signal】Long on 1H spike followed by pullback support
$SOL 1H surged to 104.37 before falling back to 103.86. RSI 1H at 63.78 is not overbought, while the 4H MACD histogram continues to expand. Buy limit orders in the order book are actively providing support, funding rate is 0.0032%, and OI is stable.
🎯Direction: Long
⚡Entry/Limit order: 103.5584 - 103.8700
🛑Stop-loss: 102.8313
🚀Target 1: 105.4281
🚀Target 2: 106.2071
🛡️Trade management:
- Execution strategy: Take 50% off at Target 1 and move the stop-loss up to breakeven. If the price falls back to the entry level, exit automaticall
post-image
SOL+1.91%
solana:9BB6NFEcjBCtnNLFko2FqVQBq8HHM13kCyYcdQbgpump, I think this is good for a long playing the range.
Sweep + deviation below the RLs and VAL. followed by the reclaim and retest,
Clear invalidation with stops below the deviation low.
post-image
SOL+1.87%
$DOGE This trade was entered during the overnight session a few days ago. At the time, the chart printed several consecutive small-bodied candlesticks, gradually moving higher, but without any obvious increase in volume or acceleration. I judged this to be a typical slow bullish advance with at least some short-term room to extend, so I opened a long position in the direction of the trend.

After entry, the price did not move straight up. It went through a period of narrow-range consolidation, with much of the unrealized profit fluctuating back and forth. It would be impossible to say my mind
post-image
DOGE+7.09%
ZEC-0.74%
XRP+1.06%
What position will #4 get? I have no idea.
post-image
Oil Prices Stay Near Important Technical Levels as Supply Conditions Remain Uncertain
live-cover
LIVE1,065
This move doesn’t even require me to think—the account is dancing on its own. $DELL Just holding it and it hit a new high; I really didn’t see that coming.

I just checked the account: entry price 453.65, current price 522.51, return +731.52%. The profit rhythm was timed perfectly. Don’t ask me how I managed to hold it—when the logic is solid enough, your hands won’t shake. This wave has been a very satisfying big win, and the patience earlier wasn’t wasted.

I actually had my eye on it when the market was grinding along the bottom. Volume expanded but the price didn’t rise, clearly showing
post-image
DELL+0.94%
LAB+1.60%
ZEC-0.74%
Everyone’s staring at the 1D chart—but the 4h just whispered a secret about ESPORTS that most will ignore.

$ESPORTS /USDT - SHORT

Trade Plan:
Entry: 0.01471 – 0.01479
SL: 0.01515
TP1: 0.01445
TP2: 0.01425
TP3: 0.01395

Why this setup?
- 1D trend is **bearish**, and the 4h structure is aligning with a 95% short confidence—this isn’t a coin flip.
- RSI on 15m sits at 46.15, giving sellers room before any oversold bounce traps late longs.
- Entry zone (0.01475) is tight: TP1 at 0.01445, TP2 at 0.01425—that’s a 3.4% drop if momentum holds.
- ATR (1h: 0.000167) shows low volatility—meani
ESPORTS+0.07%
Everyone’s buying XRP at 1.42, but the 4h tape just whispered something else.

$XRP /USDT - SHORT

Trade Plan:
Entry: 1.4184 – 1.4228
SL: 1.4415
TP1: 1.4049
TP2: 1.3944
TP3: 1.3787

Why this setup?
- The 1D trend is *range*, not breakout—so chasing longs here is gambling on noise.
- RSI on 15m is hot at 64 while price stalls at 1.4206, a classic bull trap setup.
- ATR is tight (0.0087), meaning the next 4h candle decides direction—my model leans SHORT with TP1 at 1.4049 and TP2 at 1.3944.
- Why now? The stop at 1.4415 is far, but invalidation at 1.4049 is close—risk/reward favors the
XRP+1.06%
A few days ago I was still calculating whether I had enough money for instant noodles this month; this morning I was already wondering whether to add sausage. This wave of $OPENAI really delivered, rising from an opening price of 1206.57 to 1407.34 now, giving +327.5% in gains—truly a lifeline.

Looking back, that glance before bed a few days ago still showed a low-volume sideways move. I judged that the bottom structure had already been fully established, with only one bullish candle needed to confirm the direction. It opened today with a direct surge on heavy volume, and the long positions
post-image
OPENAI+2.61%
ETH+0.89%
ADA+3.47%
Load More

Join 40 M users in our growing community

⚡️ Join 40 M users in the crypto craze discussion

💬 Engage with your favorite top creators

👍 See what interests you

View More