
Square
Following
Hot
News
Profile
Share your thoughts
placeholder
Article
After the Sharp Drop in Memory Chip Stocks, a Golden Opportunity or a Valuation Trap?
A sudden sharp decline in Japanese and South Korean stocks has put the semiconductor sector under renewed pressure. The Nikkei 225 fell 4.90%, the Korea Composite Stock Price Index (KOSPI) fell 7.56%, and memory chip stocks have also become a market focus. For investors who have long been bullish on the AI supply chain, is this correction a rare buying opportunity or the start of further risk unwinding?
SK hynix and SanDisk have drawn attention because of the memory demand driven by artificial intelligence. A
META-3.68%
$ETH Evening outlook: 10.17.
If ETH can stay above the trendline on the hourly chart, the corresponding price is 2432, and ETH still has a chance to push up to 2493. Conversely, if ETH breaks below 2432, it will retest support at 2382.
A break below 2382 would mean another retest of the previous low. If it holds above 2382 and stays within the 2432–2382 range, the decline won't deepen. If it breaks below 2382, ETH is in trouble again. The only way to stop ETH from continuing to drift lower is to stay above 2432. Then it must break above 2493 and hold there to stop the continued drift lower. Fo
ETH-1.91%
Trenches
AGT
A
bade
b
AGT
0x5d...e274
Market Cap
$.
Change
.
24h Vol
$.
Holders
.
CNPY
C
bade
b
CNPY
0xc6...ddd2
Market Cap
$.
Change
.
24h Vol
$.
Holders
.
FOLIO
F
bade
b
FOLIO
0x5f...e411
Market Cap
$.
Change
.
24h Vol
$.
Holders
.
FTR
F
bade
b
FTR
DFMt...pump
Market Cap
$.
Change
.
24h Vol
$.
Holders
.
DOPE
D
bade
b
DOPE
0xf9...8899
Market Cap
$.
Change
.
24h Vol
$.
Holders
.
Even if something I make doesn’t make money, I still feel pretty happy as long as people use it often.
I’m increasingly able to understand those open-source programmers.
post-image
#美股存储板块跌幅扩大
The core question is whether this represents a healthy correction following a rally driven by artificial intelligence (AI), or the beginning of a deeper repricing process within the storage sector. Rather than buying simply because prices have fallen, it would be more prudent to focus on earnings expectations, memory pricing, and whether each company can maintain its profit margins.
My perspectives on storage sector stocks:
* Micron (MU): Monitor demand for DRAM and HBM, memory growth linked to AI, and gross profit margin forecasts. Strong AI demand could bolster earnings, though
post-image
MU-5.66%
SNDK-6.90%
WDC-6.91%
STX-7.45%
DRAM-3.39%
$AVAX
Price is grinding around 9.882, with the long/short ratio still showing 60% longs. The nearly 5% drop over seven days just won't let up😤. Trading right on support doesn't make it a solid floor—it gives bears a ladder. If price can't get above 10.4, a break below 9.882 could trigger a flush. If it can't hold, the trend is set to shift.
post-image
AVAX-3.87%
Gm from my millionaire cutie 💓
Happy Week Fam
post-image
Young people don't play fair—they really know how to twist the knife 🤣
post-image
BULLISH 🚀🚀🚀: $ASTER is a must-have in a portfolio
$6-9 is a good price target, the structure looks obvious to me, it will go up all at once in almost a straight line. That is what has happened more often than not with structures like these ones.
post-image
ASTER-1.39%
Japanese and South Korean stock markets plunge together: Could memory chips present a buying opportunity?
Japanese and South Korean stock markets plunged together, putting semiconductor and memory chip stocks back in the spotlight. The Nikkei 225 fell 4.90%, while South Korea's KOSPI fell 7.56%, as risk aversion rose markedly. Amid this market turmoil, the performance of SK Hynix and SanDisk has naturally drawn significant attention from traders.
Odaily reported that CoinGlass data shows SK Hynix accounts for 15.8% of open interest on Gate, ranking second across all platforms; the figure for S
GER40-0.05%
MICRON TECHNOLOGY $MU REJECTING MOVING AVERAGE RESISTANCE ARE BEARS TARGETING $855.67 NEXT?
Pair: $MU /USDT
Direction: SHORT
Entry Price: 883.94
Target Levels (Take Profit)
TP 1: 873.34 1.20%
TP 2: 866.27 2.00%
TP 3: 855.67 3.20%
Stop Loss
SL: 898.08
Technical Breakdown
MU ($884.02) faced notable sell-side rejection after an attempt to push higher, leaving upper wicks that indicate active seller defense near structural resistance. This behavior confirms persistent overhead supply and sets up a continuation move toward lower liquidity targets.
Price action remains constrained beneath ke
MU-2.92%
Are Overvalued Storage Stocks the Key to This Round of Pullbacks?
Previously, AI computing power became a major theme in the capital markets, and memory chips, high-performance flash storage, and data center hard drives also attracted investor interest. As stocks such as Kioxia, SanDisk, Western Digital, and Seagate have pulled back one after another, the market has begun to reassess a question: Was the previous rally built on actual earnings, or overly optimistic expectations?
AI development does indeed require large amounts of data storage, but investors cannot simply equate demand growth wi
NVDA-1.42%
#BitcoinTops$82K
#ShareWeekly
**BTC Market Analysis: Inflation Shock, the $80K Test, and the Next Move**
Bitcoin has spent the past week trading in a tight, nervous range, and the reason is inflation. Hotter-than-expected US CPI data on Wednesday (October 14) pushed traders to price in a higher-for-longer Fed. BTC rose to about $84,000 right before the print, then sold off. It briefly dipped below $80,000 as rate-hike fears and a global tech selloff hit risk assets. It then rebounded toward $82,000 on Friday, October 16, helped by easing Treasury yields and softer oil. Even so, BTC was still
BTC-1.40%
  • 2
Today’s core assessment: ETH is currently in a post-decline consolidation and recovery phase, with a cautious-to-bearish short-term bias. The priority is to wait for signals to short a rebound, while keeping a breakout-long plan in reserve. Blindly chasing rallies or selling off at current levels is not recommended.
The latest market reports show ETH at approximately $2,413–$2,460 on October 17, with quote times varying by source; BTC is trading around $81,000. Whether ETH can regain and hold $2,450–$2,480 will be an important indicator of whether the short-term rebound can continue.
The follo
ETH-1.83%
BTC-0.96%
NAS100-2.28%
MSCI-1.02%
#USMemoryStocksExtendLosses
#ShareWeekly
Memory chip stocks are in a sharp drawdown, and the selloff has now stretched across several sessions. Micron (MU), SanDisk (SNDK), Western Digital (WDC) and Seagate (STX) have all been sliding, but the damage is not evenly spread. Micron has fallen roughly 14% over the five sessions through October 14, even though it is still up about 97% over six months and about 191% year to date. That gap between recent weakness and the long-term run is the core of the debate right now. Below I walk through what is driving the move, where the key levels sit, and h
MU-5.66%
NVDA-1.42%
TSLA-2.17%
AAPL+0.43%
  • 1
“The S&P 500 should really be called the S&P 1,000.” I had to hear that twice before it clicked. The first time, I took it as a throwaway joke. The second time, it hit me: It’s called the 500, but its weighting looks more like “the top 100 set the direction, while the rest just tag along.” The biggest weights among the top 100 pull the index along, while the other 900—using “1,000” as a metaphor—are basically just scenery. For example, in 2023, the market-cap-weighted S&P 500 gained about 24%, while the equal-weight version gained about 14%. In 2024, the top ten constituents at one point made
post-image
SPYX-1.09%
NVDA-1.42%
AAPL+0.43%
MSFT-1.94%
AMZN-1.87%
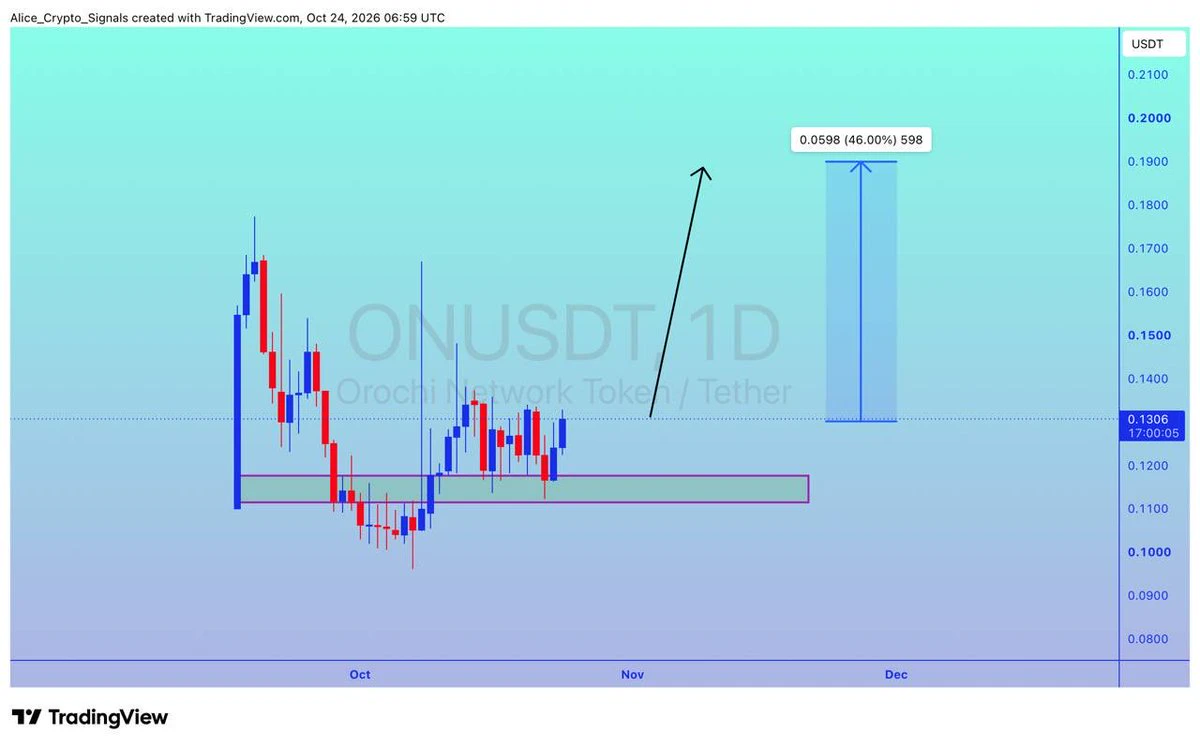
$NIL #NIL
Trying to break Bullish Pennant.
Successful Breakout could provide 45-50% bullish rally ✍️
NIL+4.78%
🔹 Is Tesla’s “flying sports car” safe? Musk: If safety is your top priority, don’t buy it
live-cover
LIVE2,353
  • 2
$DELL UPTREND OVER?
Broke through a cluster of support, Diagonal trendline, then SMA50 and EMA55 and then 0.236 fib. Ideally 0.382 fib at 410 should be next.
post-image
DELL-4.41%
market updates on today $BTC & $XAU
live-cover
LIVE558
BTC had already wicked above 80,000 on October 9, and continued to wick above 80,000 afterward. The only time it was above 79,000 was also a wick into the gap near 80,000. This means the 79,500–80,200 area has already been tested and completely filled. The wick on the 15th completed the sweep of stop-loss orders and liquidity below, after which price rebounded. We can therefore consider this logic fairly reliable. However, the 82,000–83,300 daily-chart support-resistance flip zone remains a major resistance area. We can still treat 82,000 as the primary target, then assess how price responds t
post-image
BTC-1.37%
ETH-1.83%
Load More

Join 40 M users in our growing community

⚡️ Join 40 M users in the crypto craze discussion

💬 Engage with your favorite top creators

👍 See what interests you

Trending Topics

USSeptemberPPIBeatsExpectations

91.35k Views1.92k Discussing

US September PPI came in at 6.3% YoY, well above the 5.3% market expectation, pointing to renewed producer-side inflation pressure. Weekly jobless claims were 199K, broadly in line with forecasts. Could hotter inflation further reduce room for rate cuts, and what does it mean for $BTC, US stocks, and gold?

GateWCTCS9GlobalTradingCompetition

37.87k Views6.62k Discussing

GateBTCAndETHFuturesVolumeRanksTop3

53.8k Views1.77k Discussing

View More