Share your thoughts
placeholder
Article
#TIA LTF Analysis:
celestia:native is holding the bottom of its ascending channel nicely, with buyers stepping in around the trendline support. This area could provide the base for the next move higher, especially if celestia:native continues to hold the channel.
If support keeps holding, celestia:native looks ready for a move toward the upper boundary of the channel.
post-image
TIA+0.69%
Which will MM grab first?
Bitcoin $75K or $81K?
$BTC
post-image
BTC-0.38%
In those beautiful moments of life, I only wish time went as slow as the Uber clock when waiting for a pickup… when 6 minutes is actually 20
post-image
[$SOL Signal] Short + 1H bearish momentum contraction, order-book selling pressure weighs
$SOL 1H RSI 32.71, order-book depth imbalance -6.26%, Bollinger lower band 99.2418 nearby. 4H MACD bearish crossover, histogram -0.0616, with limited bullish rebound strength. Sell orders are suppressing price; bid/ask 0.88, with insufficient bids below. Funding rate -0.0054%, OI stable, short crowding not high, so short entries require price discipline. Current price 99.77 is close to the upper edge of the entry zone.
🎯 Direction: Short
⚡ Entry/Limit Order: 99.4707 - 99.7700
🛑 Stop-loss: 100.7677
🚀
post-image
SOL-1.52%
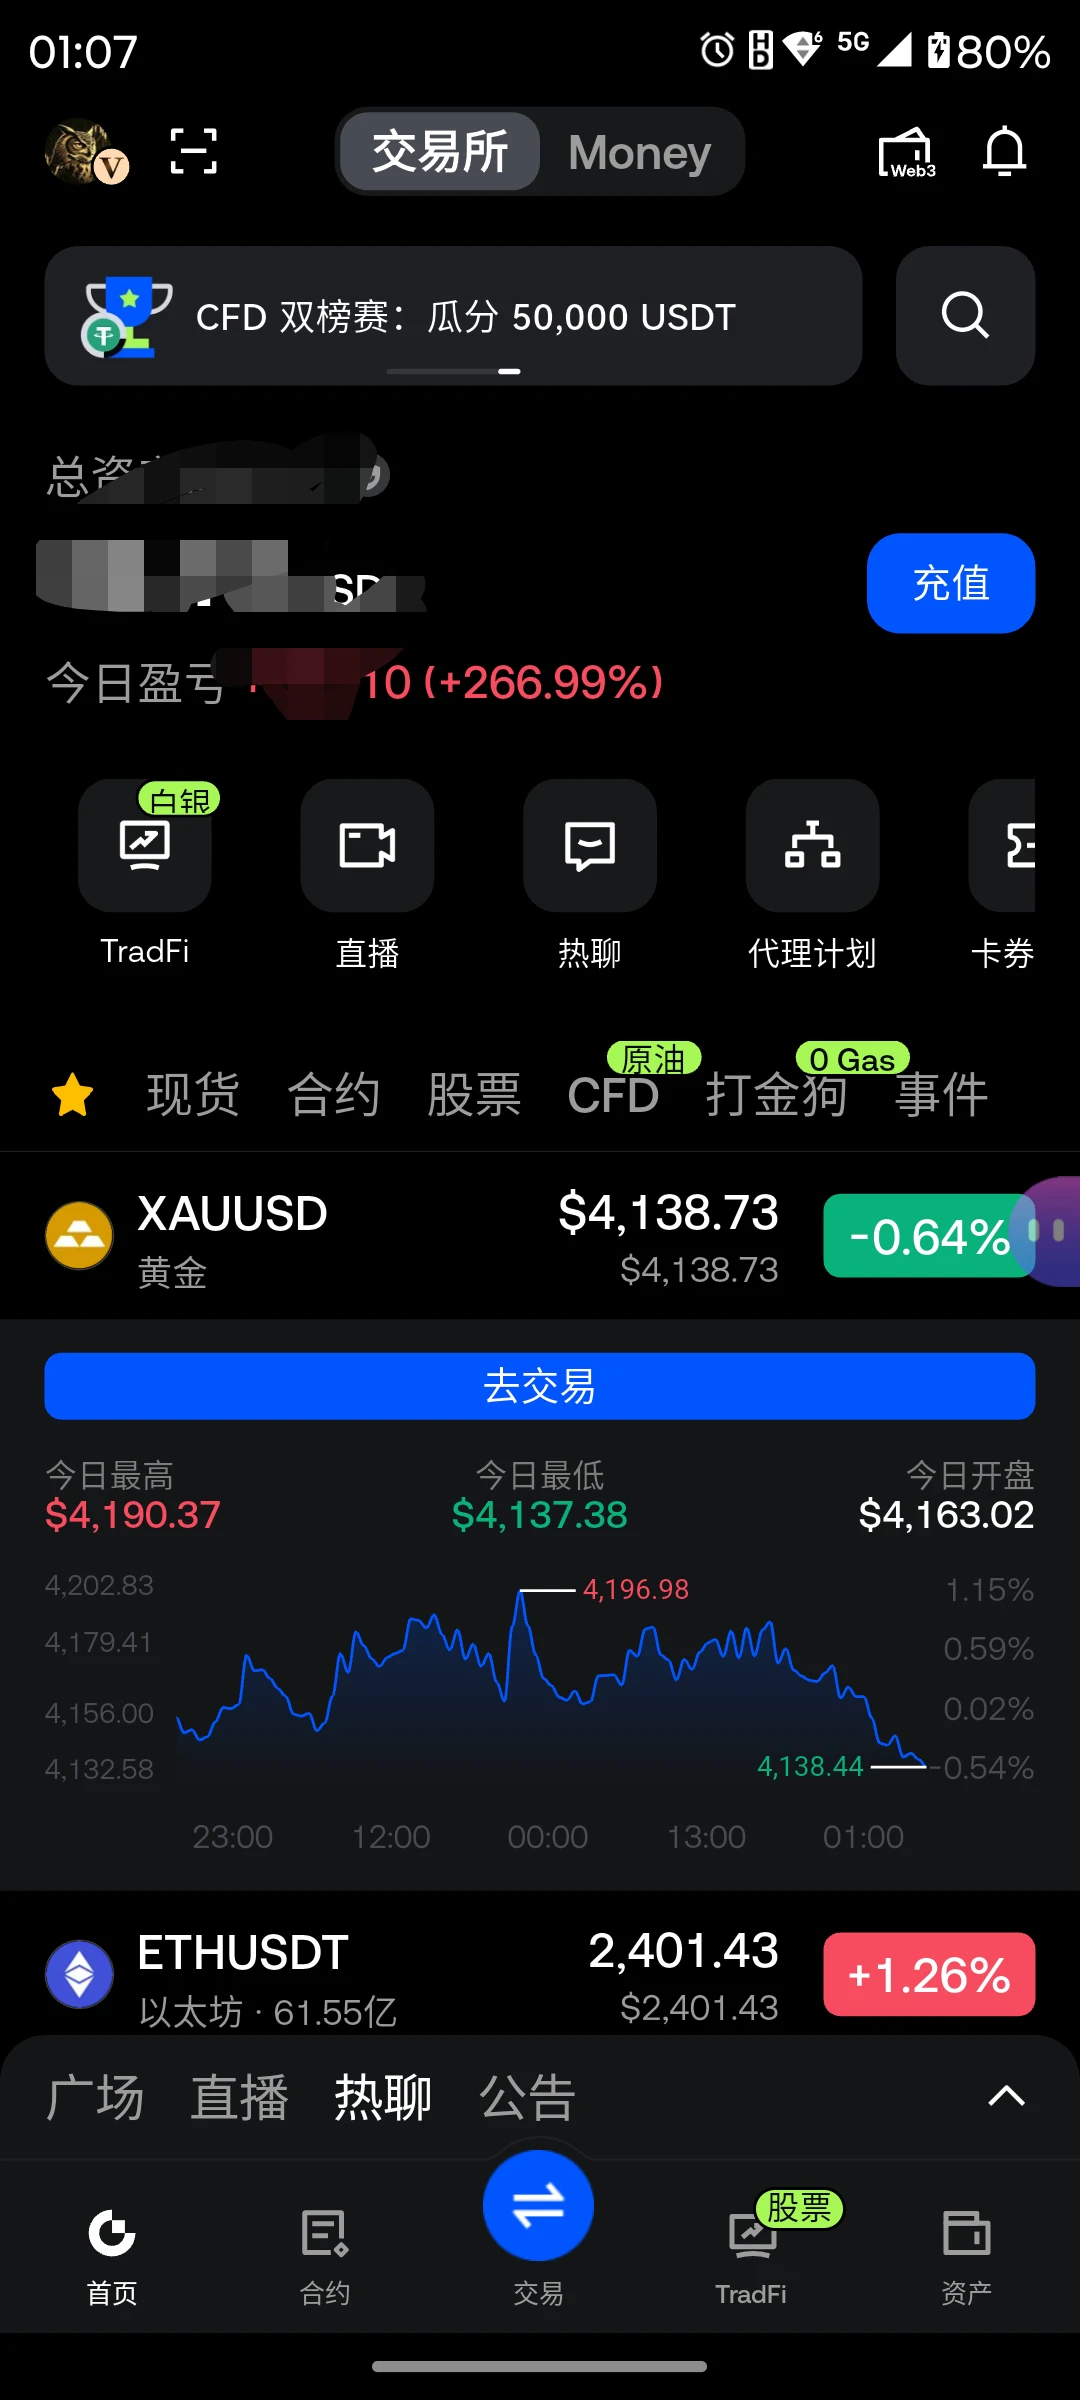
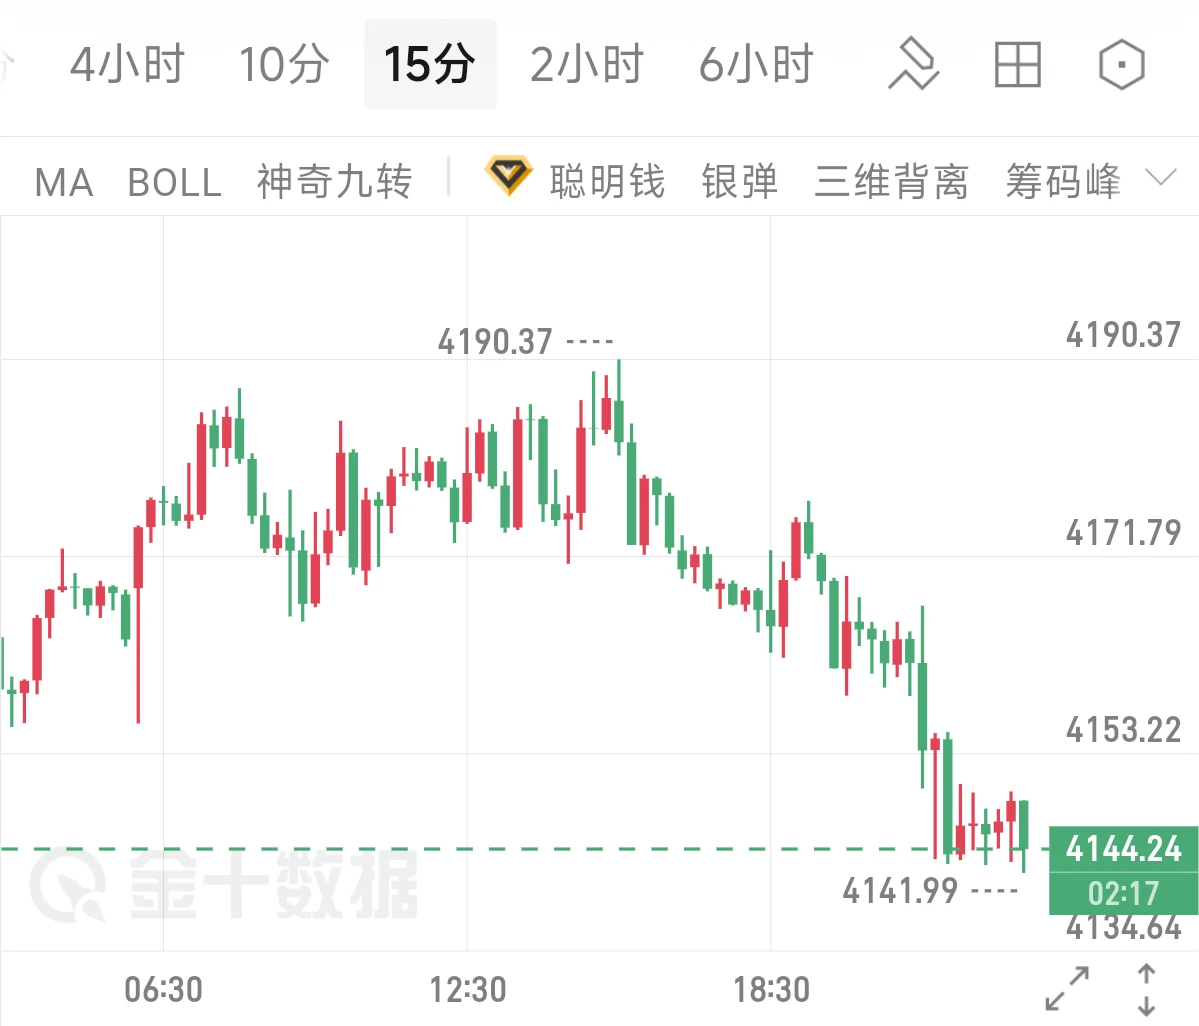
This Week’s Gold Market Strategy Summary:
Gold experienced wide-range whipsawing and consolidation this week, with long and short positions switching rapidly and daily fluctuations exceeding 100 points. Blindly chasing trades could easily lead to losses in both directions. Throughout, we adhered to a strategy of positioning around key levels, neither chasing highs nor selling lows, locking in market turning points in advance and accurately capturing the transition between long and short positions.
During the evening session on September 7, we identified 4380 as the support line and suggested a
ETH-2.10%
BTC-0.36%
A whale splashed $10,000 on coin buying and flooded the screens, but RAY's chart turned ice-cold
$RAY has been pushed back onto the trending list by a whale again—a RAY whale spent $10,000 buying STONK an hour ago, which is barely a ripple against its 228.4M market cap. I’m not chasing longs here: trim on a rebound to 1.5951/1.5979, and exit fully if it breaks below 1.4621.

The hype is here, but the money hasn’t arrived—that’s the key point. After the event, RAY ground down from 1.4902 to 1.4821 (-0.54%), while the volume ratio fell to just 0.173, showing that follow-on buyers did not enter
RAY-6.50%
Insiders are quietly stacking $AKE /USDT while the 1h ATR screams low volatility.

$AKE /USDT - LONG

Trade Plan:
Entry: 0.014545 – 0.014945
SL: 0.012823
TP1: 0.016187
TP2: 0.017148
TP3: 0.018590

Why this setup?
Why now? The daily trend is bullish with a 95% confidence score, and the 1h price is sitting at 0.014745, right inside the entry zone between 0.014545 and 0.014945. The 15m RSI at 48.73 shows room to run before overbought, while the 1h ATR of 0.000801 signals an imminent breakout from this tight range. Targets are locked at TP1 of 0.016187 and TP2 of 0.017148, but the line in the s
AKE-2.76%
  • 1
#CoinDeskRevealsGateRWAPerpetualsTop3Globally
RWA PERPETUALS ARE NO LONGER A SIDE STORY
The latest CoinDesk August Exchange Review gives the RWA perpetuals market a number that is difficult to ignore.
Gate’s RWA perpetual trading volume surged to approximately $64.7B in August, rising 158% month-over-month and pushing its market share from 5.32% to 12.6%. That was enough to move Gate into the global top three centralized exchanges for RWA perpetual trading. Meanwhile, the overall CEX RWA perpetual market reached a record $602B, up 2.37% from July.
For me, the most important part is not simpl
post-image
Jiaa_Insights
#CoinDeskRevealsGateRWAPerpetualsTop3Globally Gate’s RWA perpetuals market is becoming one of the most interesting developments in the connection between traditional finance and crypto derivatives.
According to the latest CoinDesk-related market coverage, Gate ranked among the global top three exchanges for RWA perpetual trading, with August volume around $64.7B–$64.8B and a sharp month-over-month increase of roughly 158%. This growth shows that RWA derivatives are moving rapidly from a niche concept toward a much larger trading segment.
For me, the most important point is not simply the $64.8B volume. It is the speed at which this market is expanding.
RWA perpetuals can give traders exposure to themes connected with stocks, commodities, indices and other real-world assets while using crypto-native derivatives infrastructure. That creates a much closer relationship between traditional financial markets and the digital-asset market.
My Current Global Market View
BTC around $77.3K
$BTC
Bitcoin remains my primary market-direction indicator. Current market data puts BTC around $77.3K, with the broader market still highly sensitive to macroeconomic developments.
My key short-term zone is $76K–$80K.
If BTC holds $76K–$77K and starts reclaiming $78K, I would look for another attempt toward $79K–$80K. A clean breakout and sustained trading above $80K would strengthen the bullish structure.
On the other hand, a decisive loss of $76K would make me more defensive and could open the door toward lower support.
My preference is not to chase BTC in the middle of the range. I would rather wait for confirmation around major levels.
ETH — around $2.53K
Ethereum is currently around $2.53K based on the latest available market data.
ETH remains highly dependent on BTC direction and overall liquidity. For my trading approach, I want to see ETH reclaim and hold important resistance before aggressively increasing long exposure.
If BTC strengthens above $78K–$80K, ETH could receive additional momentum. If BTC loses $76K, I would expect ETH to remain vulnerable to stronger downside volatility.
Gold — around $4.35K–$4.37K
Gold remains an important RWA reference asset.
Recent data showed spot gold reaching approximately $4,363/oz, while another market close was around $4,366.20.
The important factor for me is the relationship between Gold, inflation and Treasury yields.
August U.S. CPI increased 0.4%, and expectations for a Fed rate increase have strengthened. Higher yields can pressure non-yielding Gold, while geopolitical uncertainty can continue supporting defensive demand.
Oil — WTI around $100, Brent around $104.6
Oil is now one of the most important macro variables for my market map.
WTI recently settled around $100.05 while Brent settled around $104.61.
Elevated oil prices can increase inflation expectations and create additional pressure on interest-rate expectations. That matters for technology stocks, crypto and RWA derivatives because liquidity conditions can change quickly.
U.S. Equity Market
S&P 500 — around 7,657
The S&P 500 recently rebounded strongly, but the broader weekly structure remained under pressure.
For me, the important question is whether buyers can maintain the recovery or whether another rejection appears at higher levels.
Nasdaq Composite — around 26,333
The Nasdaq remains extremely important for crypto traders because technology and growth stocks are highly sensitive to Treasury yields and liquidity expectations.
If Nasdaq continues recovering, it could support broader risk appetite.
If technology stocks start selling off again while BTC is already below support, I would become more cautious with leveraged positions.
Dow Jones — around 52,573
The Dow also recovered strongly in the latest session.
This tells me that the recent rebound was not limited to technology stocks, but I still want to see follow-through before calling it a confirmed trend reversal.
Technology Stocks and RWA
NVIDIA remains one of the most important stocks on my watchlist.
NVDA is trading around the $218 area after recent selling pressure.
Micron has also experienced significant volatility, while Apple has shown comparatively stronger behavior following its recent product event.
For me, this is exactly why RWA perpetuals are becoming interesting.
Crypto traders cannot look only at BTC and ETH anymore.
Liquidity moves between crypto, equities, commodities, bonds and macro markets.
When Treasury yields rise, technology valuations can come under pressure.
When oil rises sharply, inflation expectations can increase.
When Gold strengthens, defensive positioning can become more important.
When U.S. indices recover, risk appetite can improve.
All of these relationships can influence crypto.
Why Gate’s $64.8B RWA Volume Matters
The $64.8B August figure is significant because it demonstrates meaningful demand for RWA perpetual exposure.
The reported growth of approximately 158% month-over-month is even more important to me than the absolute number.
It means the market is developing quickly.
If this growth continues, RWA perpetuals could become an increasingly important part of crypto derivatives trading.
The potential opportunity is large because traders can use one market environment to express views on multiple traditional-market themes.
But volume growth does not mean guaranteed profits.
Perpetual trading still involves leverage, funding costs, liquidation risk, volatility and execution risk.
That is why my focus remains on risk management.
My Trading Plan
My first rule is simple:
I want to understand the underlying asset before trading an RWA perpetual.
If the underlying is an equity, I watch the equity.
If it is Gold, I watch Gold, yields and the dollar.
If it is Oil, I watch energy supply, geopolitical risk and inflation expectations.
If it is an index, I watch the broader equity market.
Then I compare that information with BTC and overall crypto liquidity.
I prefer confirmation rather than prediction.
For bullish setups, I want to see price reclaim resistance, hold the breakout and preferably confirm with stronger volume.
For bearish setups, I want to see support break, failed recovery and continued selling pressure.
I also prefer partial entries instead of entering the full position immediately.
If the market confirms my thesis, I can scale gradually.
If the thesis becomes invalid, I exit without allowing one trade to become a major account loss.
My BTC Levels
$80K — major bullish breakout area
$78K — first important reclaim level
$76K–$77K — key support zone
Below $76K — increased correction risk
Above $80K with confirmation — stronger bullish continuation potential
My preference is to avoid forcing a trade while BTC remains trapped inside the middle of this range.
Bullish Scenario
If BTC holds $76K–$77K, reclaims $78K and breaks $80K with volume, I would become more bullish.
If Nasdaq and S&P 500 continue recovering at the same time and oil begins cooling from elevated levels, risk appetite could improve further.
That would create a better environment for crypto, technology stocks and RWA perpetuals.
In that scenario, I would look for confirmed breakouts rather than chasing the first green candle.
Bearish Scenario
If BTC loses $76K decisively while Nasdaq and S&P 500 weaken again, oil remains above $100 and Treasury yields stay elevated, I would reduce risk.
The combination of falling crypto, weak equities and elevated oil could create a difficult environment for leveraged RWA positions.
In that situation, capital preservation becomes more important than catching every move.
My Risk Management
I never want leverage to become the reason a good market idea turns into a bad trade.
My approach is:
Controlled position size
Defined stop-loss
Clear invalidation
No all-in trades
No FOMO entries
Partial profit-taking
Confirmation before adding
I would rather take a smaller confirmed trade than a huge position based only on a prediction.
My Final View
Gate RWA Perpetuals: Bullish long-term narrative
August RWA Perpetual Volume: ~$64.8B
Global Ranking: Top 3
Reported Monthly Growth: ~158%
BTC: ~$77.3K
BTC Key Range: $76K–$80K
ETH: ~$2.53K
Gold: ~$4.35K–$4.37K
WTI: ~$100
Brent: ~$104.6
S&P 500: ~7,657
Nasdaq: ~26,333
Dow Jones: ~52,573
NVIDIA: ~$218
My overall view is bullish on the long-term development of RWA perpetual markets, but I remain selective on short-term leveraged trades.
The most interesting part of this trend is the growing connection between crypto liquidity and traditional financial markets.
BTC gives me the crypto risk signal.
Nasdaq gives me a technology and liquidity signal.
S&P 500 gives me a broader risk-appetite signal.
Gold gives me a defensive and inflation signal.
Oil gives me an important inflation and geopolitical signal.
Together, these markets can help build a much stronger trading framework for RWA perpetuals.
For me, the opportunity is real, but discipline is more important than excitement.
I want confirmation, controlled leverage, defined invalidation and proper position sizing.
RWA perpetuals may become a major bridge between TradFi and crypto, and Gate’s rapid growth in this segment is something I will continue watching closely.
@Gate_Square
#Gate #RWA #perpetuals
filecoin:native flipping $0.80.
Next: 1D 200EMA.
Flip that → $1.20–$1.50.
#FIL #Filecoin #Crypto #Altcoins
post-image
FIL+11.31%
#SenateReleasesNewCLARITYAct
U.S. CRYPTO REGULATION JUST ENTERED ANOTHER CRITICAL STAGE
The Senate has released a revised version of the CLARITY Act as lawmakers prepare for a crucial procedural vote on September 15.
This is much bigger than another Washington headline.
The CLARITY Act is designed to establish a clearer federal framework for digital assets, including how responsibilities are divided between the SEC and CFTC. The revised 630-page version also introduces new provisions aimed at determining when certain non-decentralized DeFi protocols would need to
post-image
BTC-0.36%
ETH-2.10%
NDAQ-0.64%
$STEEM Signal】Go long + 1H pullback/negative funding rate short squeeze
$STEEM 1H pullback recommended entry zone, with negative funding at -0.7642% and high short costs. 1H RSI is 58.61, with price holding above EMA20 at 0.0639. The MACD red bars have narrowed to 0.0005, while bullish momentum remains intact. Order book depth imbalance is -24.89%, with a Bid/Ask ratio of 0.60 and dense sell orders creating heavy pressure. The Bollinger middle band at 0.0615 provides support. OI is stable, funding remains deeply negative, and shorts continue paying. With a stop-loss radius of less than 1% and
post-image
STEEM+44.76%
Held firmly since September 9.
  • 2
$ETH Signal】Bearish alignment suppresses; target shorts at the 1H lower band
$ETH The 1H RSI is 30.89, with the price trading along the lower Bollinger Band at 2474.67, while bullish buying interest continues to weaken.
The Bid/Ask ratio is 0.63, and order-book depth is imbalanced by -22.64%, with selling pressure dominating. The 4H MACD histogram is expanding at -3.82, while the EMA20 and EMA50 lines are both suppressing price, with a complete bearish moving-average alignment.
The 1H MACD histogram is contracting at -5.62, indicating a slight weakening of short-term downward momentum, while
post-image
ETH-2.12%
This week’s account-doubling results:
In just five trading days, it rose from $10,000 to $21,270, for a cumulative net profit of $11,270 and a trading win rate of 80%.
The gold market is never short of fleeting opportunities, but what is even more valuable is the discipline to avoid blindly bottom-fishing or following the crowd. Staying on the sidelines is not conservative timidity, but leaving room to act when high-certainty opportunities arise; trading with the trend is not mindlessly following the crowd, but steadily securing profits by following the trend.
#黄金: #Gate主流CEXTop4 $ETH $BTC
post-image
ETH-2.10%
BTC-0.36%
Recently, major coins, zec, and SanDisk have all fallen! Will they continue to drop? Tonight, let’s take a closer look at the market outlook.
First, the blond guy’s side has gone all-out and shown no mercy! An Iranian merchant ship was sunk again today. Trump, you bombed our merchant ship, so we’ll send you some fireworks too! This has left Iran completely stunned. So the question is, will BTC continue to fall?
The answer is, of course, yes! However, next week’s market volatility may not stop there, because the probability of the bill passing on September 15 is only around 30%. If it fails to
post-image
ZEC-4.16%
SNDK-3.49%
BTC-0.36%
ETH-2.10%
[New Streamer] Bullish on crypto over the next 12 months
live-cover
LIVE2,225
Insiders are quietly loading $MU /USDT while the 1h RSI screams oversold.

$MU /USDT - LONG

Trade Plan:
Entry: 931.93 – 934.15
SL: 919.13
TP1: 943.47
TP2: 950.43
TP3: 960.87

Why this setup?
Why now? The 4h trend is range-bound but the 1h RSI has crashed to 18.29, signaling a potential exhaustion of sellers. The 1h ATR of 4.459256 tells us volatility is still high enough to fuel a sharp move. Entry is sitting at 933.04, a level where the 1h price is currently trading between 931.93 and 934.15. Targets are stacked at 943.47 for TP1 and 950.43 for TP2, offering a clean two-tier reward struct
MU-3.73%
  • 1
BTC Update
live-cover
LIVE1,467
The first screenshot is my friend’s, and the second is mine. He didn’t even know what Bitcoin was, and he previously lost 50,000 on the World Cup. I got him into prediction markets, and this is what happened… He made $1,000 in a week. Does the newbie protection period really exist? 😒
BTC-0.36%
Holding positions through the weekend. To prepare for the weekend and guard against a gap-up open, I’ve already withdrawn the principal.😂 Is anyone else holding positions through the weekend like me?#XAU#ZEC跌超13%
XAU-0.08%
ZEC-4.16%
Load More

Join 40 M users in our growing community

⚡️ Join 40 M users in the crypto craze discussion

💬 Engage with your favorite top creators

👍 See what interests you