Square
Following
Hot
News
Notifications
Profile
Share your thoughts
placeholder
Article
🔹Democrats Sweep Congress: Is a Major Shift Coming for Crypto? Tighter SEC Oversight and Prediction
live-cover
LIVE2,558
  • 1
11.9 BTC Silk Road
$BTC
Market Analysis

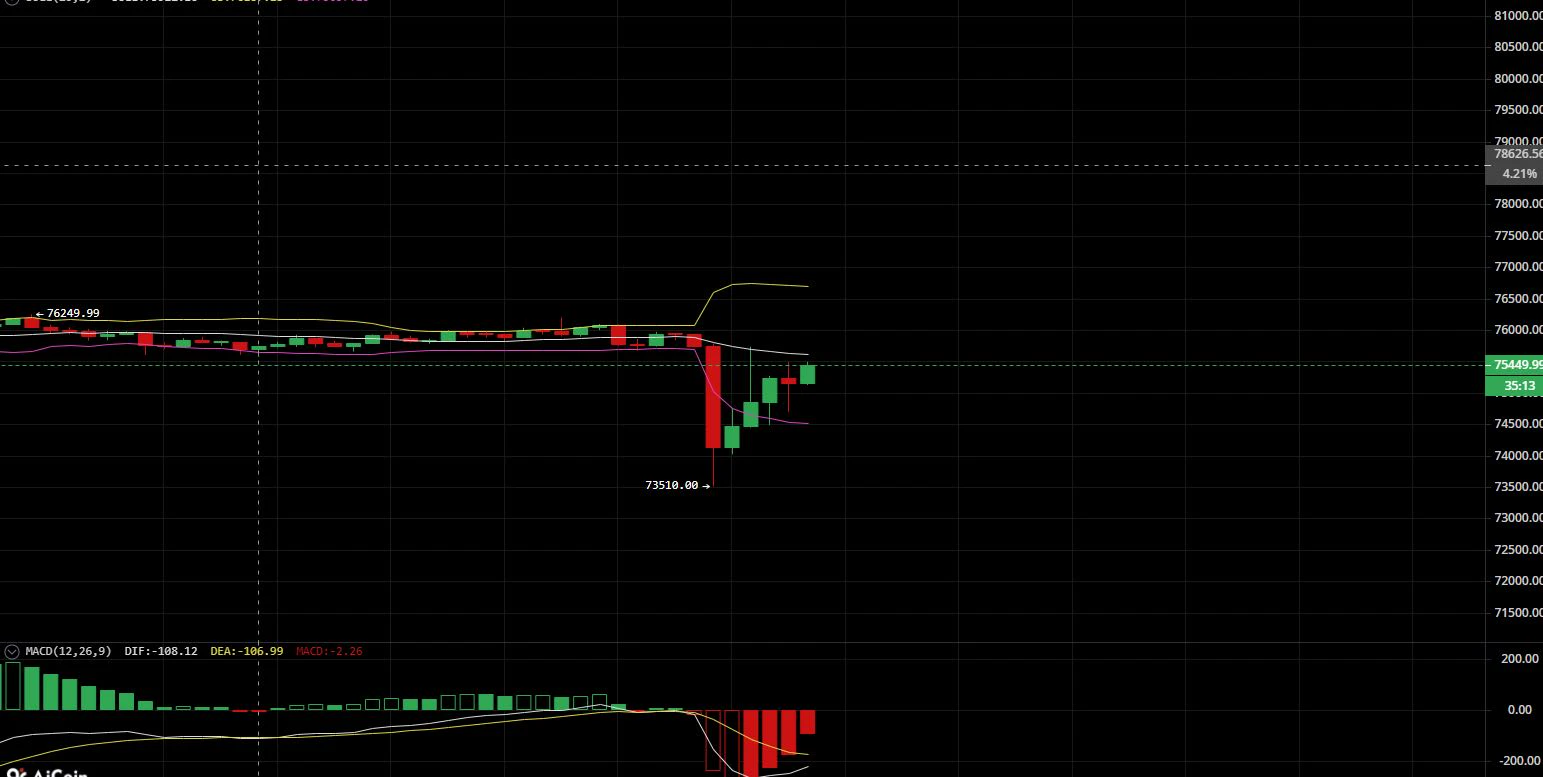
After moving sideways within the 76249 range, the market broke down on increased volume, reaching a low of 73510 and completing a concentrated wave of selling. The current move is an oversold recovery bounce following the breakdown, with the price returning to around 75300. Support at the low has held for now, but the previous consolidation platform and moving averages overhead combine to form dual resistance. Following a deep decline, bearish momentum on the MACD has contracted and signs of recovery have emerged, but the primary downtrend structure
post-image
BTC-0.65%
Trenches
ZIG
Z
bade
b
ZIG
0x8c...1145
Market Cap
$.
Change
.
24h Vol
$.
Holders
.
BTC
B
bade
b
BTC
C5xp...pump
Market Cap
$.
Change
.
24h Vol
$.
Holders
.
STONK
S
bade
b
STONK
6GmA...UNgx
Market Cap
$.
Change
.
24h Vol
$.
Holders
.
ANSEM
A
bade
b
ANSEM
9cRC...pump
Market Cap
$.
Change
.
24h Vol
$.
Holders
.
CLAUDIA
C
bade
b
CLAUDIA
2j5S...W2ZM
Market Cap
$.
Change
.
24h Vol
$.
Holders
.
How Much Longer Can the Honeymoon Between BTC and U.S. Stocks Last?

Recently, Bitcoin and U.S. stocks have been like a couple sharing both good times and bad. When the Nasdaq rises, BTC is happy; when the Nasdaq falls, BTC feels down too. But here's the question: how long can this relationship last?
From a market-structure perspective, the stronger correlation between BTC and the Nasdaq is mainly driven by institutional participation, changes in macro liquidity, and shared risk appetite. Especially when large funds allocate to both tech stocks and digital assets, they may reduce positions in
SPCX+8.74%
  • 1
Is BTC increasingly like the Nasdaq’s twin brother? Why is it always the first to follow when U.S. stocks fall?

People used to call Bitcoin digital gold. Now, many investors have found that sometimes it looks more like a tech stock that trades 24/7. The Nasdaq falls, and BTC plunges along with it; U.S. stocks rebound, and BTC quickly recovers too. This display of brotherly affection has gold wondering: “I’m the safe-haven asset—why are you two acting like family again?”
Actually, it’s no surprise that BTC and U.S. stocks have become more closely correlated. As institutional capital, spot ETFs
MU+4.71%
  • 1
BTC keeps falling toward 74,000, and everyone’s exhausted from watching the charts. Strategy founder @saylor is actually posting an AI rap video.....
The caption says just one thing: AI can make me rap. It can't print Bitcoin.
His company is sitting on 849,327 BTC, and even with the price down this much, he still has the mood to play around with AI rap. After seeing red candles these past few days, I can’t even eat my lunch.
AI really can’t print Bitcoin, but it can’t save my portfolio either😭
post-image
BTC-0.67%
After Jensen Huang admitted having an affair, a whale opened a 10x short on 30,000 $NVDA ($5.44M) on Hyperliquid.
NVDA-0.35%
The FBI knew about this Jensen Huang thing a year ago.
It only broke today, alongside the sharp drop—did someone short it?
post-image
A Brief Analysis of BTC’s Short-Term Trend Based on Dow Theory, Chan Theory, Elliott Wave Theory, Volume-Price Relationships, Order Flow, and Price Action (Strategy Recommendations)
综合研判? Need translate all. Oops final must English. Ensure line count. Let's formulate. "Comprehensive assessment".

Dow Theory confirms 74,791 has been broken, with the bearish trend entering its final acceleration
Chan Theory: the downward stroke continues, the consolidation zone is moving lower, and there are no buy signals
Elliott Wave Theory: subwave ③ of wave C’s fifth wave is extending, already exceeding the
BTC-0.67%
Price Breaks Below 74,000—Will It Keep Falling?

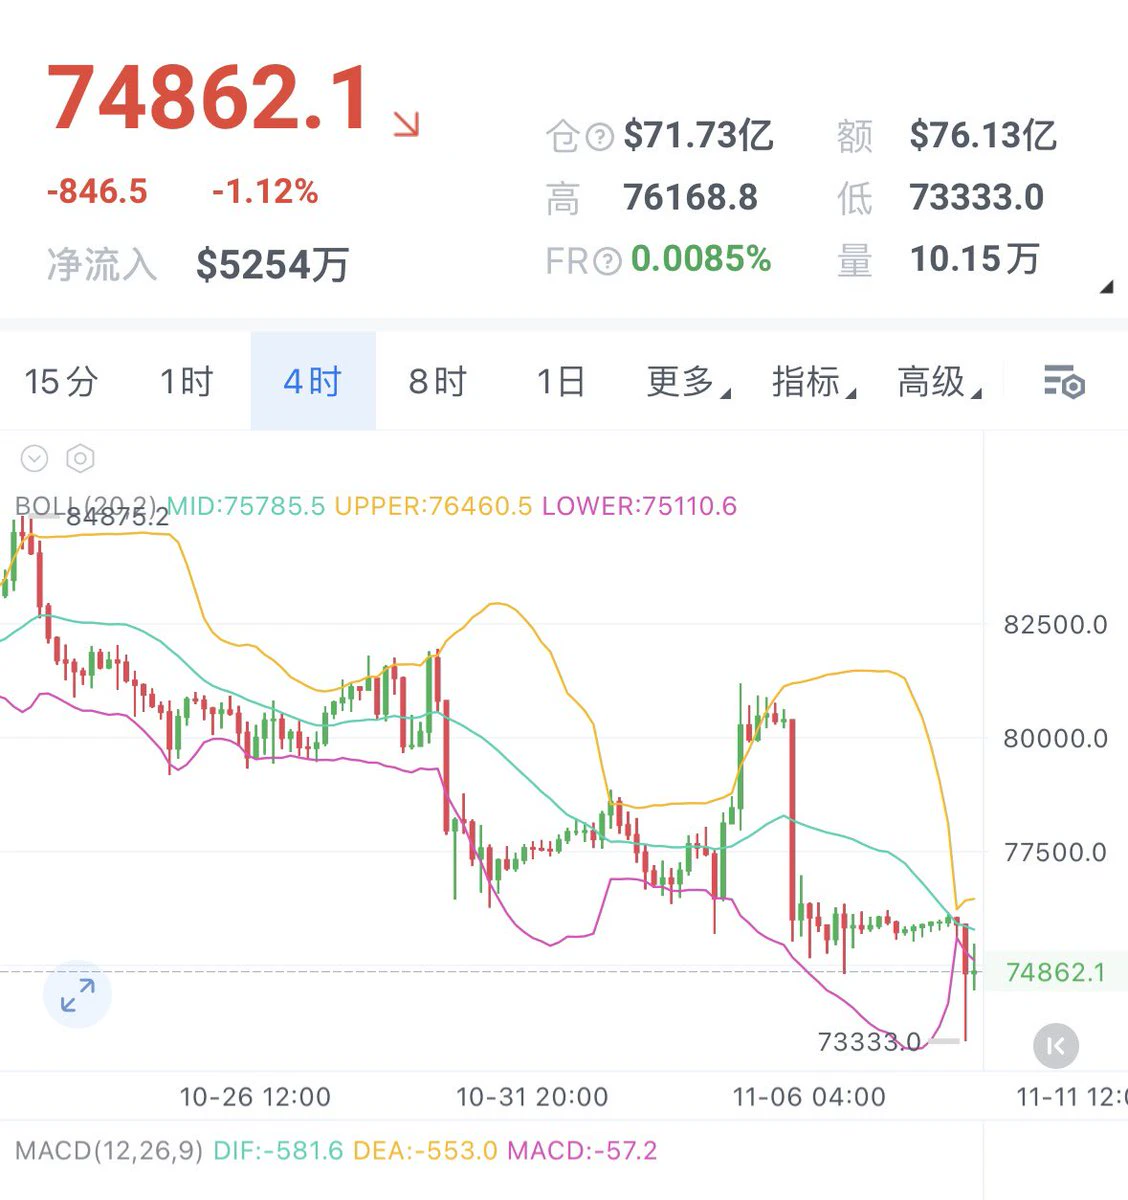
Prices broke below 74,000 in the early hours of the morning, then quickly recovered. They’re currently trading around 75,000. There have been too many exchange incidents lately, sparking panic among many people. Then, in the early hours, news broke that NVIDIA CEO Jensen Huang had an affair, triggering a dramatic $650 billion reversal in the U.S. stock market in just seven minutes.

In terms of price action, this pullback has been deep enough. Technically, the price broke below the key 74,000 support level, triggering stop-losses on a large numb
post-image
NVDA+2.80%
🪙 Black swan clouds have yet to clear; BTC is consolidating in a narrow range, looking for a breakout! Precise short-term strategy incoming
Against the backdrop of macro sentiment affected by heightened geopolitical tensions, coupled with market concerns over compliance and security incidents, global risk assets are highly volatile. After BTC saw a cascade of long liquidations in the early morning and wicked down to touch strong support at 73,420, it quickly staged an oversold rebound and is now in an extremely tight triangle consolidation phase within the 74,500 - 75,500 range.
Looking at th
BTC-0.65%
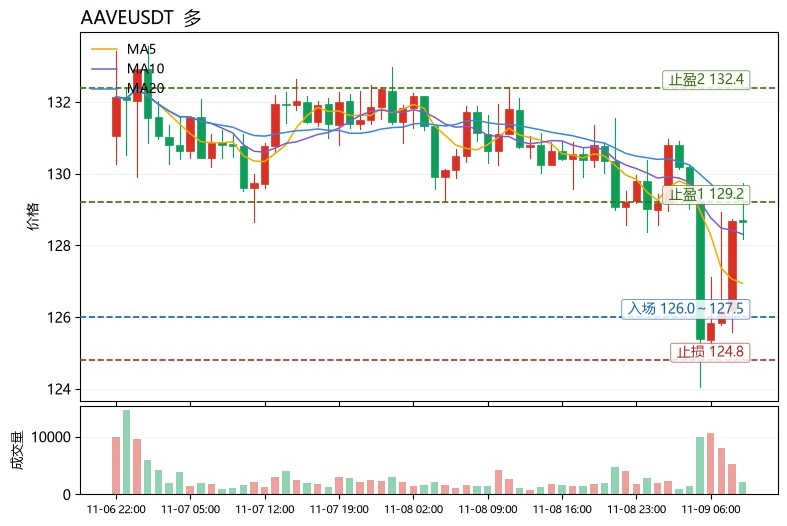
$AAVE Current price 128.65, 24h -1.85%, trading volume 9.9M USDT; MA5=126.944 is below MA20=129.228, RSI=47.0 is neutral, MACD histogram=-0.1332 is bearish but converging, Bollinger range [126.027, 132.429], funding rate +0.0067% is positive. Compared with other active coins over the same period: $DOGE has an RSI of just 36.1 and a funding rate of -0.0035%; $ADA has an RSI of 41.7 and a rate of -0.0039%. Both are at the edge of oversold territory, with shorts paying funding, while $AAVE still has a positive rate and an RSI nearly 11 points higher, showing clear relative strength—the shorts
post-image
AAVE-1.22%
DOGE-0.22%
ADA-1.48%
Why Do Altcoins Often Fall Harder After BTC Crashes?

Whenever the cryptocurrency market sees a sharp decline, many investors notice a pattern: Bitcoin falls by a few percentage points, while some altcoins may drop by double digits. Why do different coins perform so differently during the same market correction?

First, liquidity differs. BTC has deeper market liquidity and broader institutional participation, while many altcoins have relatively limited trading depth. When concentrated selling hits the market, even smaller sell orders can trigger larger price swings.

Second, risk appetite dif
post-image
BTC-0.67%
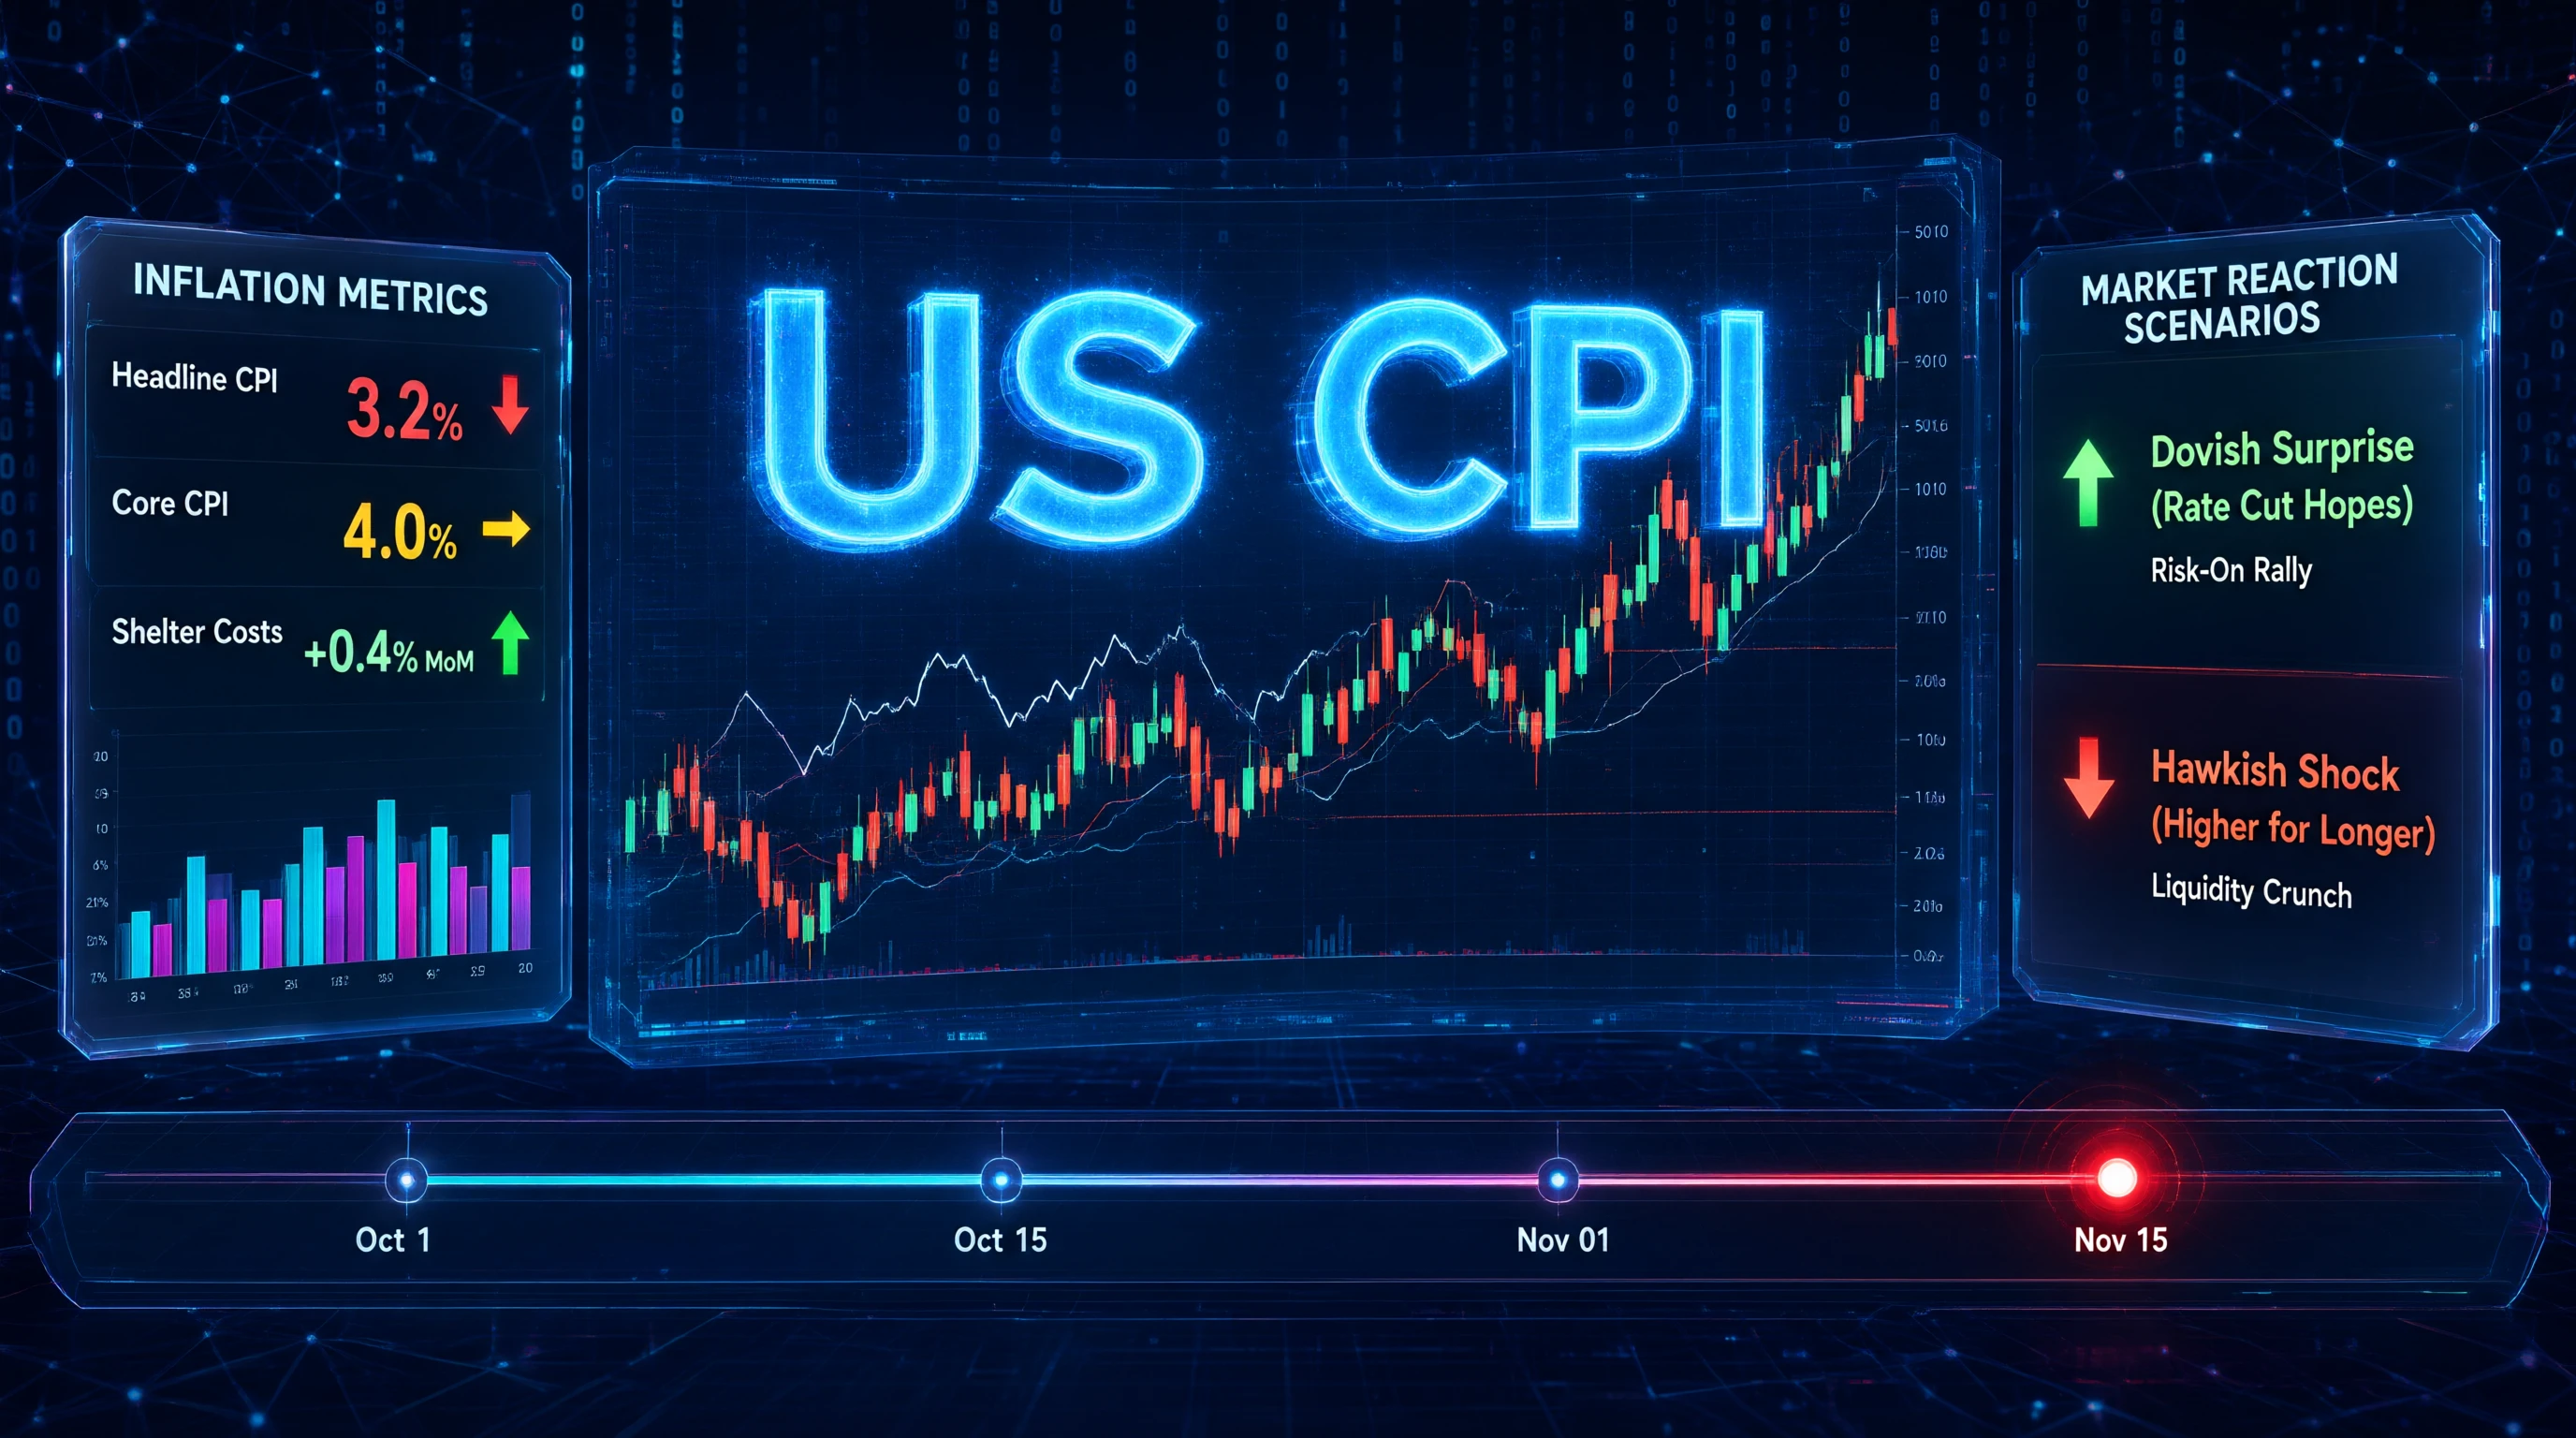
The Consumer Price Index is no longer merely an economic statistic; it is the single most volatile catalyst in global financial markets.

As the next U.S. CPI data release approaches, markets are bracing for a definitive read on the inflation trajectory. In the current economic cycle, the Federal Reserve’s policy path remains strictly data-dependent. A deviation from consensus expectations does not just adjust interest rate probabilities; it triggers immediate, violent repricing across every major asset class. The era of forgiving inflationary prints is over. The market now demands empirical p
post-image
BTC-0.65%
XAUT+0.34%
  • 2
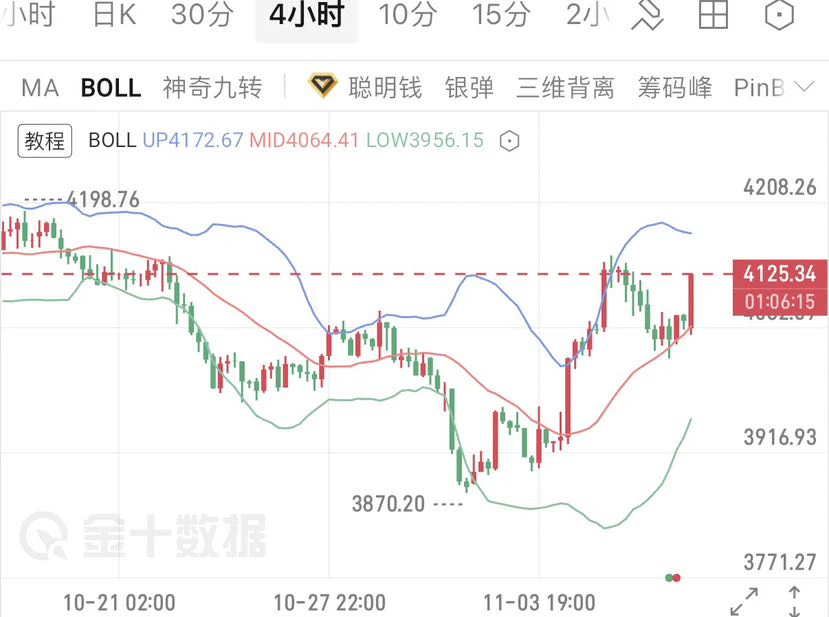
Multiple bullish catalysts converge, solidifying gold’s uptrend

On the four-hour timeframe, the Bollinger Bands are opening upward, with prices continuing to rise along the middle band. RSI remains in the strong zone, and the solid bottom formation has opened an upward channel for this rebound.

On the news front, the outcome of the U.S. midterm elections has introduced uncertainty around policy expectations, stoking market risk aversion and driving sustained inflows into safe-haven assets. Meanwhile, expectations for the pace of the Federal Reserve’s future adjustments have shifted, further
post-image
XAU+0.38%
$ETH Machi Big Brother has gone crazy! After getting liquidated this morning, he quickly went long again. Entry price: 2129, liquidation price: 2027😂
post-image
ETH-1.26%
$BTC
Recap of past live trading calls: a bottom-fishing long held from start to finish
We anticipated the support around 758 in advance and advised students to scale into long positions to trade the rebound, with entries precisely near the 75783 low. At 770, they took partial profits, then held the remaining position with a breakeven stop-loss. They ultimately closed the entire position for profit at the strong resistance level of 77838.
#美国10月CPI即将公布
A student’s 188x leveraged long earned 481.33% in a single trade, capturing nearly 2,000 points of the rebound.
When trading on their own, man
BTC-0.67%
The washout is completely over, and the main rally could ignite at any moment. Don’t hesitate any longer, folks🤩
Current strategy: Go long directly🔥🔥
First target: 0.21 Second target: 0.25 Third target: 0.3-0.5 Stop-loss level: 0.141
$JCT $AIOT should also remain on your watchlist.
Risk warning: The above is solely my personal market opinion and does not constitute investment advice. Contract trading carries extremely high risk, so please be sure to manage your position size.
post-image
GTC
GTC芝麻币
Gate.Fun
MC:$0.1Holders:1
0%
JCT-3.26%
AIOT-2.28%
  • 1
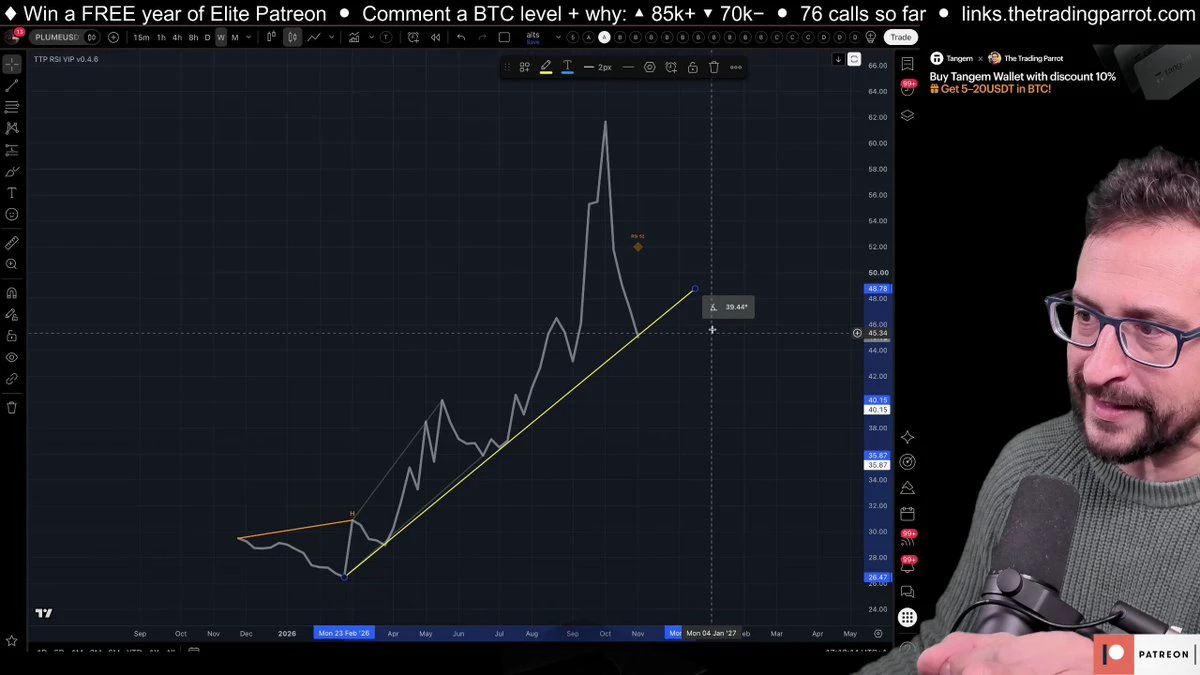
Plume: on the weekly, the RSI looks like a clean retest of its support, while the daily chart is losing the level. Mariano covers the RSI at 62, longs vs shorts at 65, and what a reclaim of support would mean. At 8:07 in the video.
#Plume #Crypto #Altcoins #TechnicalAnalysis
post-image
PLUME+3.05%
Why Does Higher Trading Frequency Make Profits Easier to Erode?

Some traders believe that constantly looking for opportunities can increase their chances of making a profit.

But in reality, every trade can incur new costs. The more trades you make, the more easily these costs accumulate.

Even a strategy that is fairly good at predicting market direction may ultimately fail to deliver the desired net returns if it trades too frequently.

I. Fees: Small Each Time, But They Can Add Up

Suppose the combined cost of buying and selling each time is 0.10% of the trade's notional value.

If the not
post-image
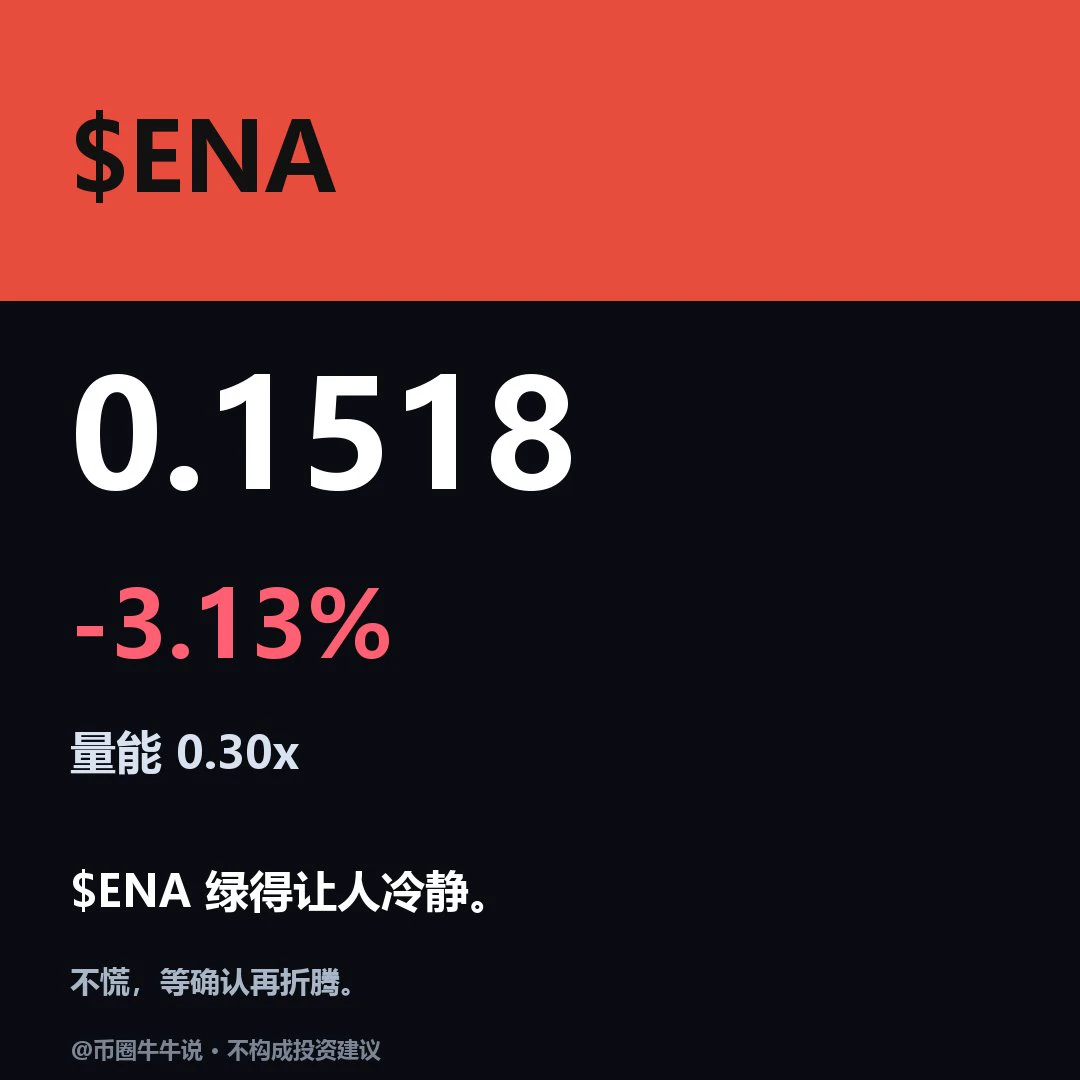
$ENA Current price: 0.1518, down 3.13% over 24H. 1H is weak: RSI 42.3/EMA20 0.1529, support 0.1441/resistance 0.1561; 4H is weak: RSI 22.7/EMA20 0.1594, support 0.1441/resistance 0.1826. For an upside move, price needs to hold above the 0.1561 resistance; on the downside, watch for a break below the 0.1441 support. Review whether 0.1561 holds and whether price can recover after losing 0.1441; the setup is invalidated if price breaks below 0.1441 and fails to recover. The market is highly volatile; for observation only.
post-image
ENA+8.04%
Load More

Join 40 M users in our growing community

⚡️ Join 40 M users in the crypto craze discussion

💬 Engage with your favorite top creators

👍 See what interests you

Trending Topics

USCPIDataIncoming

21.09k Views1.72k Discussing

The U.S. October CPI report will be released on November 10 at 8:30 a.m. ET. September CPI came in at 3.7% year over year, and markets will be watching closely for signs that inflation is cooling, especially in core CPI. A softer-than-expected reading could strengthen rate-cut expectations, while hotter inflation may pressure risk assets through higher Treasury yields and a stronger dollar. How do you think this CPI print will move $BTC, U.S. stocks and gold?

BTCFlashCrash

11.44k Views66.01k Discussing

USAIStocksHitHard

31.15k Views3.75k Discussing

View More