Share your thoughts
placeholder
Article
[New Streamer]Whales Move in Sync!
live-cover
LIVE1,090
$HYPURR GOING 10 millions mcap
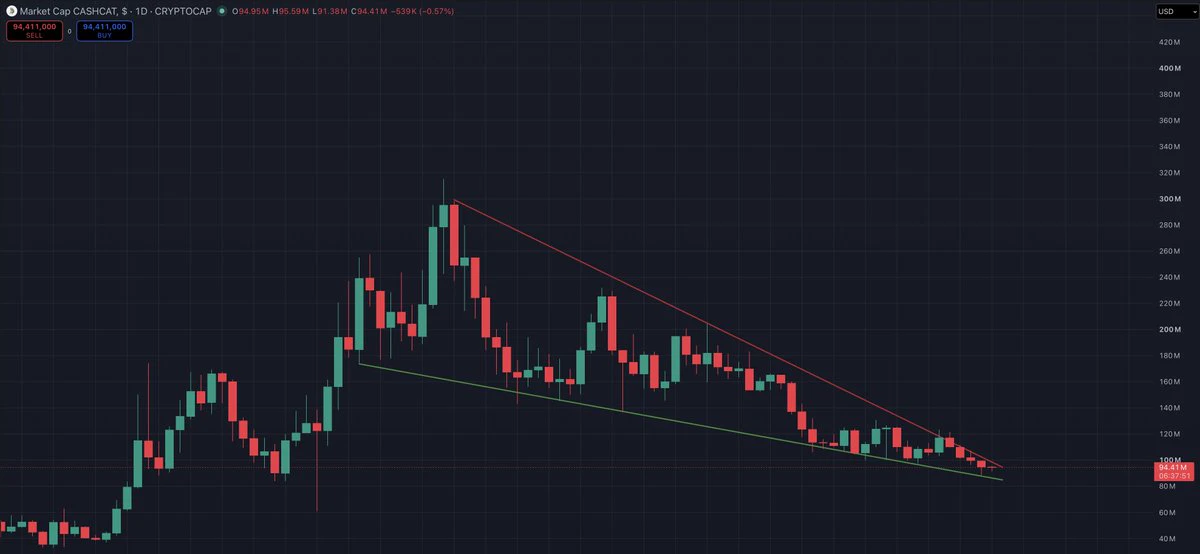
$HYPE $CAT $CASHCAT
post-image
HYPE-1.67%
CAT+1.72%
CASHCAT-4.07%
Here’s something surreal:
U.S. diesel prices have hit a record high of $5.85 per gallon.
On top of that, WTI crude oil has jumped nearly 10% this week.
But then U.S. Treasury Secretary Bessent publicly said that oil prices could fall as low as $40 once the war ends.
What’s even more interesting is that our Art said: Keep going after Iran! It’s all small stuff.
So, can I short oil from up here?🤔
post-image
  • 5
  • 2
Don’t become exit liquidity for hot coins! The whales have already left, and there’s no meat where everyone is crowded. I lurked in the $USELESS USDT corner, watching it move sideways and shake out weak hands. The Wyckoff theory confirms that smart money is accumulating.
I opened a 50x long in line with the trend, and the price took off! On the USELESSUSDT contract, I entered at 0.15986, and it surged to 0.23485, delivering +2260.71% profit in one move!
Livermore said that making big money depends on waiting, but high leverage is like walking a tightrope—one wave can snap the line. Don’t overs
USELESS-2.89%
BTC-1.44%
ETH-2.23%
GPT6 Astra analyzed and fixed it in one sentence,
reducing my intensive computing program's CPU usage directly from 87.91% to 55.33%.
post-image
BTC & ETH Break Above Short-Term Resistance! Can the Move Hold Through the Weekend?
live-cover
LIVE1,110
Gate is being popular world wide. $TSLA
post-image
TSLA-5.96%
Violent whipsaw after nonfarm payrolls overnight, ETH surged and plunged—how should we respond now?💛
Last night, after the nonfarm payrolls data was released, the market went on a roller-coaster ride.
ETH quickly plunged from 2547 to a low of 2431, then rapidly recovered after the sharp drop. It is currently oscillating within the 2440‑2460 range.

The one-hour EMA has formed a death cross, and the short-term rebound continues to face resistance at 2465.
The liquidation heatmap clearly shows that heavy selling pressure has accumulated in the 2480‑2500 area above, making it a strong resistanc
post-image
ETH-2.23%
$MSTR IS BACK TO THE TOP 500 companies of the WORLD
🚀🚀🚀🚀
post-image
MSTR-1.49%
JUST IN: Iranian media report a missile strike near Kharg Island on an oil tanker; no casualties yet, details still unclear. Kharg is Iran’s key crude export hub—a potential supply risk to watch. $IRAN?
post-image
🇸🇬 BITFUFU ADDS 59 BTC TO TREASURY!
Singapore's public company BitFuFu has added 59 new Bitcoins.
Now they have a total of 1,373 $BTC | $108.4 million.
BTC-1.44%
Everyone’s chasing gold’s新高—but XAUT just flashed a 4h SHORT signal nobody sees coming.

$XAUT /USDT - SHORT

Trade Plan:
Entry: 4425.2 – 4431.0
SL: 4455.8
TP1: 4407.3
TP2: 4393.4
TP3: 4372.6

Why this setup?
Why now?
- Price pinned at 4428 with a 1D “range” tag—not a breakout.
- RSI (15m) at 51.6 = zero momentum; ATR (1h) 11.56 says volatility is shrinking, not expanding.
- Entry zone 4425–4431 is a trap door: TP1 at 4407, TP2 at 4393—that’s a 0.8% drop before the real move.
- Confidence 55 is low, but the structure says “short the rip, not the dip.”

Debate:
If gold stalls here,
XAUT-0.68%
$NEAR Pumping hard and reversing from support with huge volume.
Expecting a quick Rally towards 5$ and higher in coming days. Also best pick for longterm hold.
post-image
NEAR+14.14%
Right now, I would be very cautious about opening new short positions.
Over the past 24 hours, liquidated positions across the entire market have exceeded $400M.
And approximately 90% of the losses were incurred by those betting on a decline.
This is no longer simply a typical case of “shorts getting it wrong.”
When such a massive volume of short positions is forcibly liquidated, those positions directly turn into fuel for an upward move.
What’s most interesting?
Some people are still continuing to short.
The market has already made the trend clear, yet they are still fighting against it.
post-image
  • 2
Yang Guang bit | September 5 $BTC Precise Strategy
Today's Plan
Entry timing: Enter short positions on a rebound in the 80000—80300 range
Stop-loss: Above 80700
Take-profit in stages
First target: 79000—79200
Second target: 78300—78600
Key Conclusion
Geopolitically, Trump said the US military is "intermittently striking" Iran and threatened to strike its nuclear facilities soon. Iran's military announced a shift to a "preemptive strike" mode and vowed to maintain control of the Strait of Hormuz, but BTC's safe-haven characteristic has remained inactive, with the geopolitical conflict having a
post-image
BTC-1.44%
$BTC
Lululemon plunges 20%!
Can’t sell yoga pants anymore?
The new CEO isn’t taking over a company
but a complete mess😂
Lululemon once made even a pair of yoga pants feel like a luxury product
but this time, the fall really hurts
The stock plunged about 20% at one point on Friday
hitting its lowest level since 2018
The reasons are simple
performance was not good enough, guidance was cut again, and core products are not selling
Lululemon’s second-quarter revenue was approximately $2.42 billion, down 4% year on year
Same-store sales fell 9%
What hurts even more is that sales of its signature l
post-image
BTC-1.44%
Who could have imagined $SNDK would deliver tenfold returns!
The chips at the market bottom appear firmly held, incremental capital continues to flow in, and market sentiment is recovering, so a bullish positioning strategy is suggested.
The price has already priced in part of its near-term upside, while KDJ is at high levels. Volatile profit-taking is highly likely to follow. Do not blindly chase the highs; prioritize locking in the profits already secured. $AKE #HYPE突破88美元创新高
post-image
SNDK+11.51%
AKE+29.72%
#GateTops7DayNetInflowsGlobally
GATE CROSSES $300M IN 7-DAY NET INFLOWS
Gate has recorded approximately $300.43 million in net capital inflows over the past seven days, placing it among the top three globally according to the latest DeFiLlama-based data. The figure is significant because it shows that capital movement toward Gate has remained strong even while the broader crypto market is dealing with elevated volatility and changing macro expectations.
WHAT DOES $300M+ NET INFLOW ACTUALLY MEAN?
Net inflow is not simply the amount of money entering an exchange. It represents the difference b
post-image
Falcon_Official
#GateTops7DayNetInflowsGlobally
Gate is making a strong statement through capital flows. According to DeFiLlama data, Gate recorded approximately $273.72 million in net capital inflows over the past 7 days, placing it among the top three centralized exchanges globally. For an exchange, this is more than just a large number on a dashboard—it shows that a significant amount of capital has moved onto the platform after accounting for outflows.
The important word here is “net.” If users deposit $500 million but withdraw $226 million during the same period, the net inflow is roughly $274 million. That means the headline figure is measuring the difference between money coming in and money leaving, rather than simply counting deposits. This makes a sustained positive seven-day figure a useful indicator for understanding where exchange liquidity is building.
A seven-day window is particularly interesting because it filters out some of the noise that can appear in a single day. One large transfer can make a 24-hour ranking look impressive, but maintaining strong net inflows across an entire week suggests broader activity. Capital may be arriving for spot trading, derivatives, portfolio repositioning, new listings, hedging or simply to keep funds ready for opportunities.
There is another reason this number deserves attention. Exchange inflows should never be interpreted as an automatic bullish signal for the entire crypto market. Coins moving onto an exchange can eventually be used for buying, but they can also be deposited for selling or hedging. The stronger interpretation comes when capital inflows are combined with trading volume, price action, stablecoin liquidity and user activity. In other words, inflow tells us where capital is moving; market behavior tells us what that capital is actually doing.
Gate's broader flow picture also adds context. DeFiLlama data cited by Gate showed approximately $520.45 million of net inflows over the past month, ranking Gate third among centralized exchanges globally. The seven-day figure therefore fits into a larger story of meaningful capital movement rather than appearing as an isolated one-day event.
For traders, this is the part I find most interesting. If strong net inflows continue while trading activity expands, liquidity becomes an increasingly important part of the Gate ecosystem. More available capital can support deeper market participation and provide traders with greater flexibility when volatility creates opportunities. But if inflows rise while prices weaken sharply, the interpretation becomes more complicated because those funds could be positioned for selling or defensive strategies.
The recent data also shows how quickly rankings can change. Another September 3 snapshot from DeFiLlama placed Gate's seven-day net inflow at $78.19 million and ranked it first among global centralized exchanges, highlighting that exchange-flow figures can move rapidly as deposits and withdrawals change. The key takeaway is therefore not to treat one snapshot as permanent, but to watch whether positive capital-flow momentum continues over multiple periods.
For Gate, the $273.72 million seven-day net inflow is still a notable milestone. It puts the exchange firmly on the global capital-flow radar and gives the community another metric to watch beyond simple trading volume. If the next weekly readings remain positive and are accompanied by stronger activity, that would make the trend considerably more meaningful.
Capital follows opportunity, but the smartest signal is not simply seeing money arrive. The real signal is seeing whether that capital stays, participates and contributes to sustained market activity.
@Gate_Square
repost-content-media
BTC-1.44%
  • 5
Everyone’s cheering NEAR’s 1D uptrend—but the 4h clock just struck midnight.

$NEAR /USDT - SHORT

Trade Plan:
Entry: 2.2167 – 2.2435
SL: 2.3973
TP1: 2.1047
TP2: 2.0211
TP3: 1.8956

Why this setup?
- 84% confidence says SHORT while the daily narrative stays bullish—that’s the divergence trap.
- RSI 15m at 54.85 shows no panic yet; price is still hovering at the 2.2301 reference.
- With ATR 1h at 0.0536, we have room to slide—TP1 at 2.1047 is a 5.6% drop from entry.
- Why now? The “waiting” status means the setup hasn’t fired, but the invalidation at 1.9720 is far below—safety net is w
post-image
NEAR+14.11%
Arbitrum ethereum:0xb50721bcf8d664c30412cfbc6cf7a15145234ad1 bridge TVL just hit an ATH at $23B
post-image
ARB-2.59%
ETH-2.28%
Load More

Join 40 M users in our growing community

⚡️ Join 40 M users in the crypto craze discussion

💬 Engage with your favorite top creators

👍 See what interests you

View More