


Share your thoughts
placeholder
Article
[Price Trend Analysis]
1. Candlestick Patterns:
- On the 4-hour chart, the candlestick at 20:00 on September 11 was a small-bodied bullish candle, with the closing price near the high, indicating that upward momentum is continuing, although the gains have narrowed.
- On the 1-day chart, the candlestick for September 11 was a huge-volume bullish candle that almost entirely erased the losses from the previous few days, reaching a high of 2666, showing extremely optimistic market sentiment, while the long upper shadow also indicates resistance above.
2. Technical Indicators:
- MACD: On the 4-hour
BTC+0.64%
ETH+2.73%
  • 7
Insiders are quietly stacking shorts on $SKHYNIX /USDT while the 1h price sits at 1369.85 and the daily trend stays range-bound.

$SKHYNIX /USDT - SHORT

Trade Plan:
Entry: 1366.71 – 1373.03
SL: 1400.19
TP1: 1347.13
TP2: 1331.97
TP3: 1309.23

Why this setup?
Why now? The daily trend is range, which means the asset is coiling and a directional breakout is overdue, and the 1h ATR of 12.63299 shows that the average hourly move is large enough to make a short entry at 1369.87 meaningful. The 15m RSI at 55.95 is neutral, not overbought, so a short bias is not fighting momentum but waiting for a
SKHYNIX+3.93%
XRP is trapped in a range but smart money is already placing short trades.

$XRP /USDT - SHORT

Trade Plan:
Entry: 1.3446 – 1.3540
SL: 1.3949
TP1: 1.3151
TP2: 1.2923
TP3: 1.2581

Why this setup?
Why now? The 1h price sits at 1.3493 inside a tight entry zone of 1.3446 to 1.3540, giving a precise trigger for the short bias. The 15m RSI at 41.14 confirms bearish momentum is building without being overextended, so the move has room to run. The 1h ATR of 0.018998 tells us volatility is compressed enough that a breakout in either direction could be explosive, but the daily trend remains range-bou
XRP+1.10%
#AugustCPIDropsTonight
August CPI: The Market Is Waiting for One Number
The U.S. August CPI report is scheduled for September 11 at 8:30 AM ET, and this is one of the most important macro events for BTC, stocks, Treasury yields and Federal Reserve expectations. The previous July CPI showed a 0.1% monthly increase and 3.4% annual inflation, while the current consensus expects August headline CPI at around 0.4% MoM and 3.4% YoY. Core CPI is expected around 0.2% MoM and 2.4% YoY, compared with 2.5% previously.
The key point for traders is simple:
The market will react to CPI relative to expectat
post-image
BTC+0.59%
GAS-3.30%
#eth Current market analysis: Focus especially on 8 a.m. If it really prints a wick of more than 100 points, as we said in last night’s livestream, then that would undoubtedly be a liquidation-driven liquidity sweep. This is probably a temporary high. For longs around 2509, watch 2529-48 on the rebound, with 2567-2581 as the extreme range. Holding above these levels would be bullish; failing to hold above them would be bearish. Deep shakeout!! Current market analysis: 2509-2490-2483 is still fine as long as it does not break lower; if 2433 breaks, then this is not the low. Be prepared to prot
ETH+2.73%
  • 2
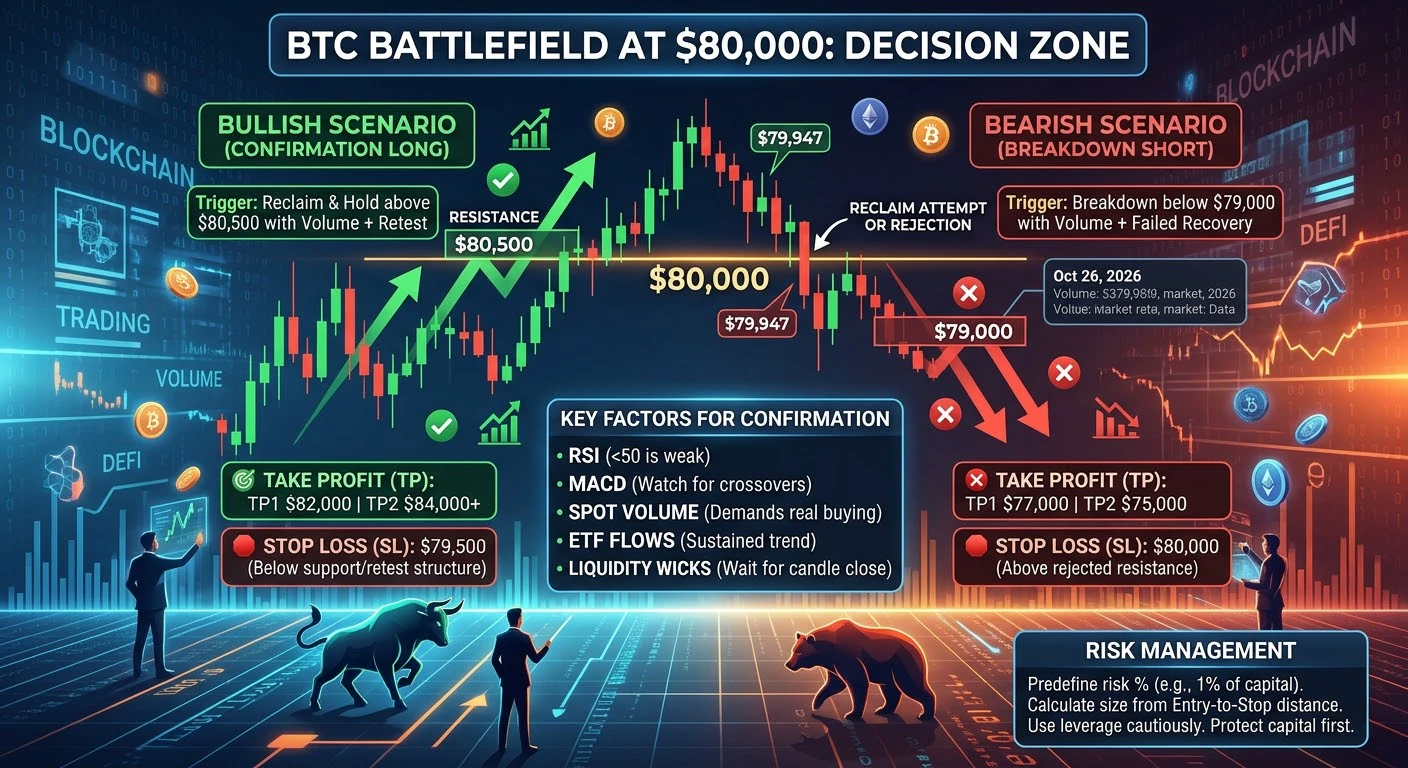
Yang Guang bit | September 12 $BTC CPI surges and retreats like a roller coaster, 77000 level fluctuates ahead of FOMC
【Today’s Idea】
Entry timing: Enter short positions on a rebound into the 77500—77700 range
Stop-loss: Above 78000
Tiered take-profit:
First target: 76600—76800
Second target: 75900—76100
Core conclusion
Geopolitically, the US-Iran conflict is trending toward a protracted confrontation, and Brent crude prices remain elevated. However, BTC’s safe-haven attribute has never been activated; high oil prices instead reinforce inflation and rate-hike expectations, creating indirect be
post-image
BTC+0.59%
keep farming and locking nest-2:native
the most asymmetric bet on hyperEVM, onchain equities, and DeFi
33 cents
post-image
The midnight bearish outlook has once again been validated—shorting was the right call! September 12 BTC/ETH outlook
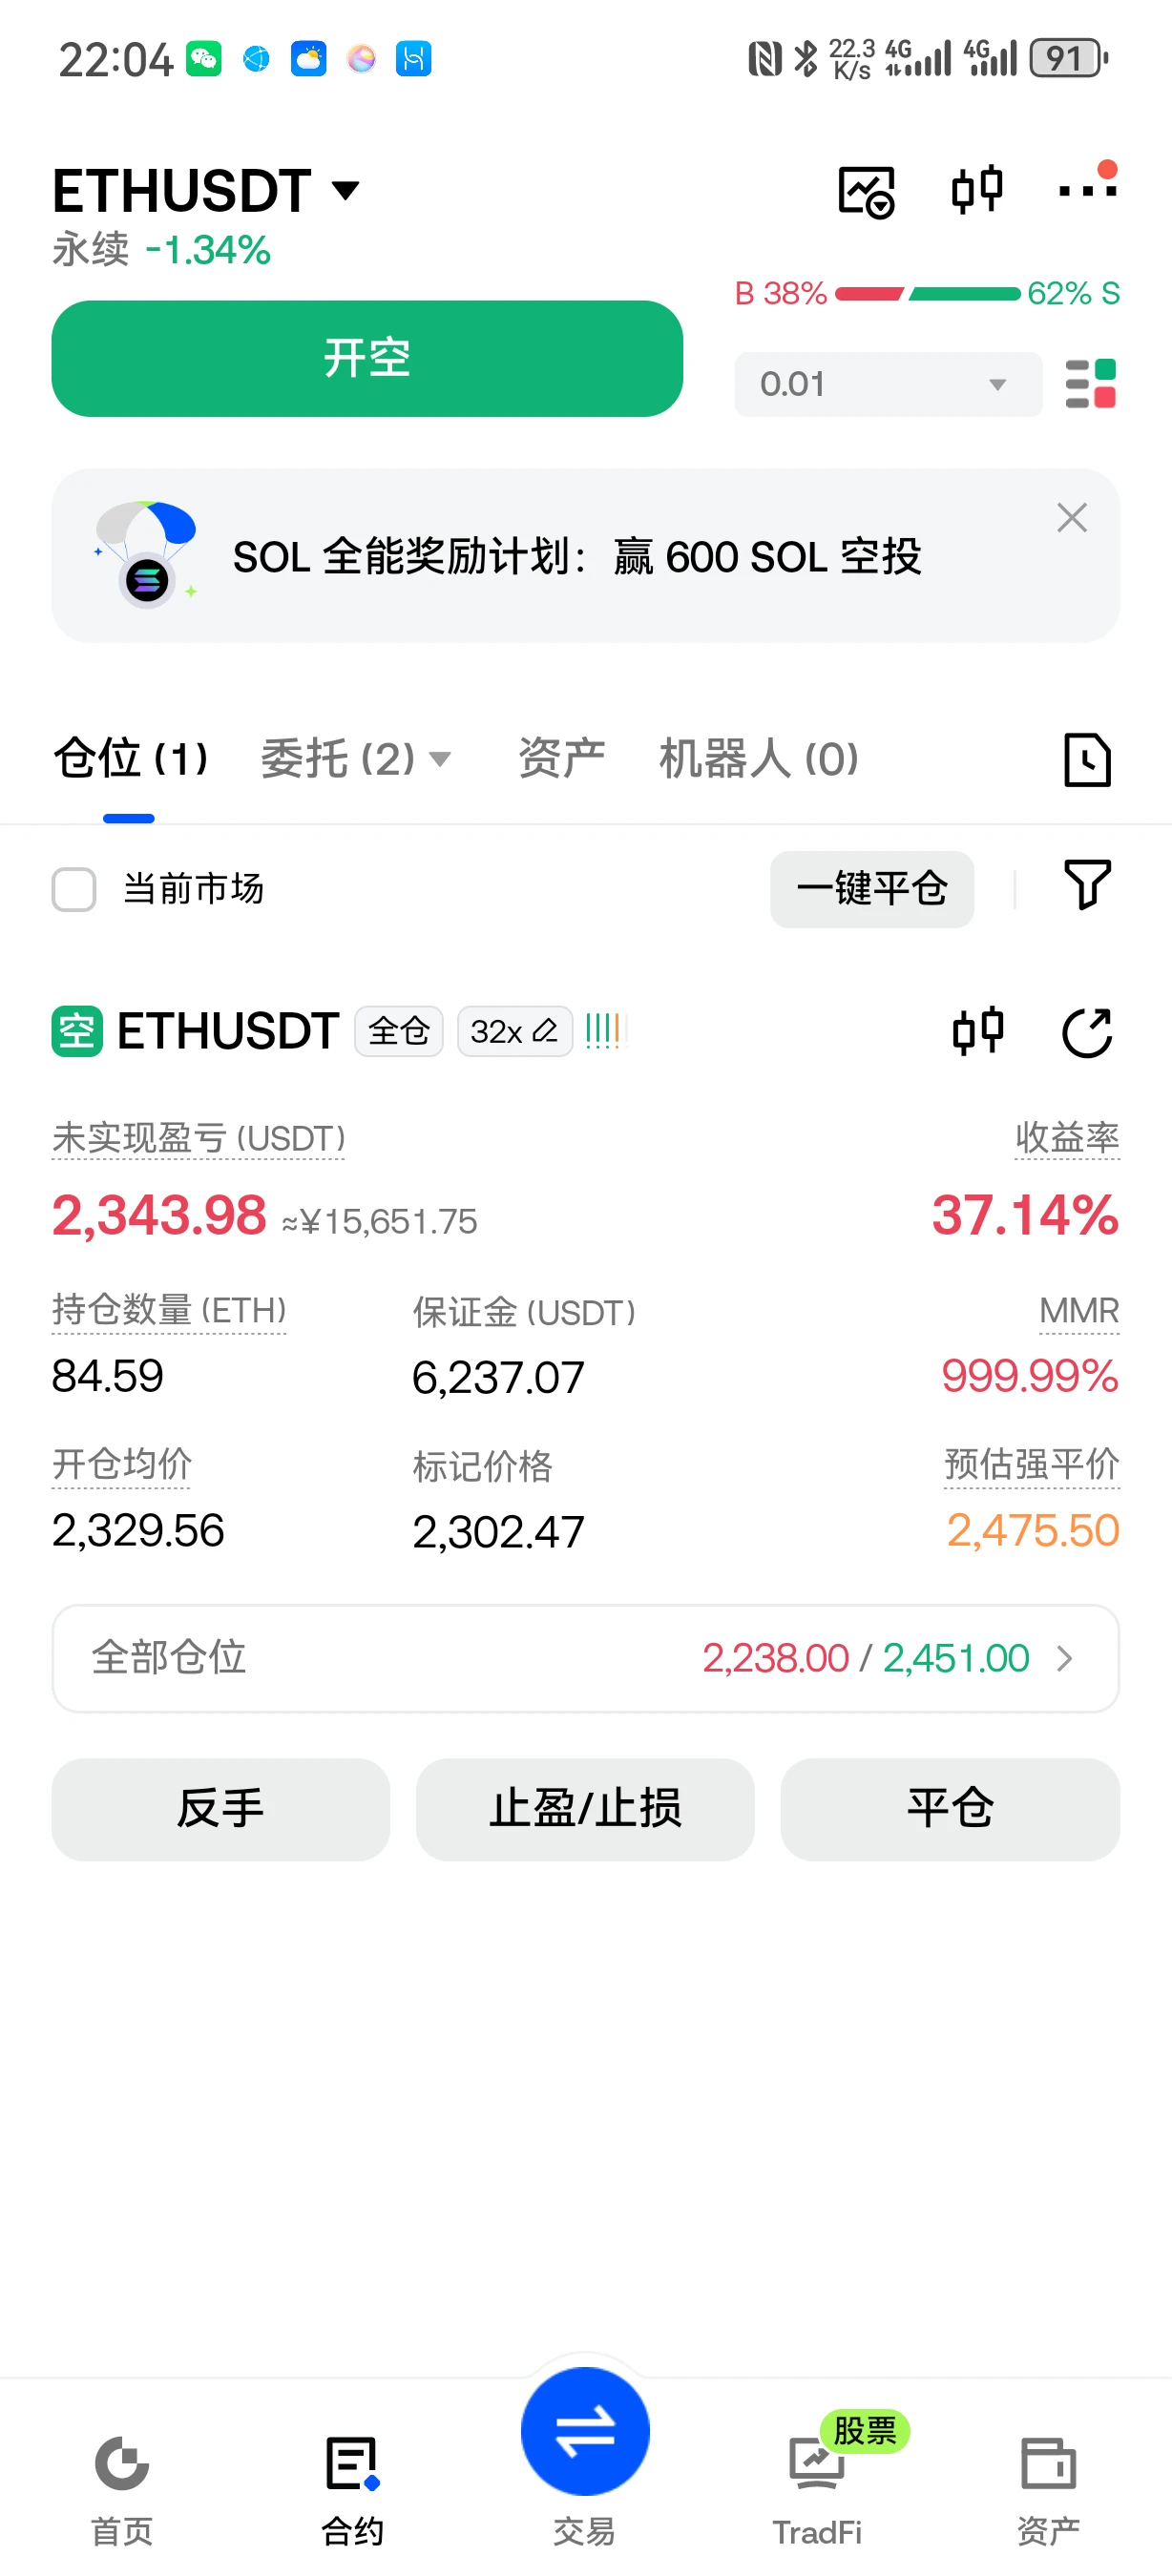
Although Ethereum spiked upward yesterday and stopped out one position, the firm bearish outlook remains unchanged. Continuing to short has already brought huge profits: Ethereum has gained over 100 points again, while BTC has gained 2,000 points. Following along means reaping profits! Those already in can move their stop-losses to lock in gains, while those who missed the entry can simply wait for a rebound and continue lying in wait!
September 12 BTC/ETH outlook
Short BTC agai
ETH+2.73%
BTC+0.64%
  • 1
Insiders are calling $ESPORTS /USDT a trap after the 1h spike.

$ESPORTS /USDT - SHORT

Trade Plan:
Entry: 0.01069 – 0.01081
SL: 0.01133
TP1: 0.01031
TP2: 0.01002
TP3: 0.00958

Why this setup?
Why now? The daily trend is bearish, the 1h ATR is just 0.000243, the 15m RSI sits at 55.76, and the entry zone holds at 0.01075. The tight 1h ATR means volatility is compressed before a potential explosive move lower, while the RSI shows room to run without being overbought. The entry zone at 0.01075 aligns perfectly with the short bias, and the target TP1 of 0.01031 offers a clean first reward. TP2
ESPORTS+0.65%
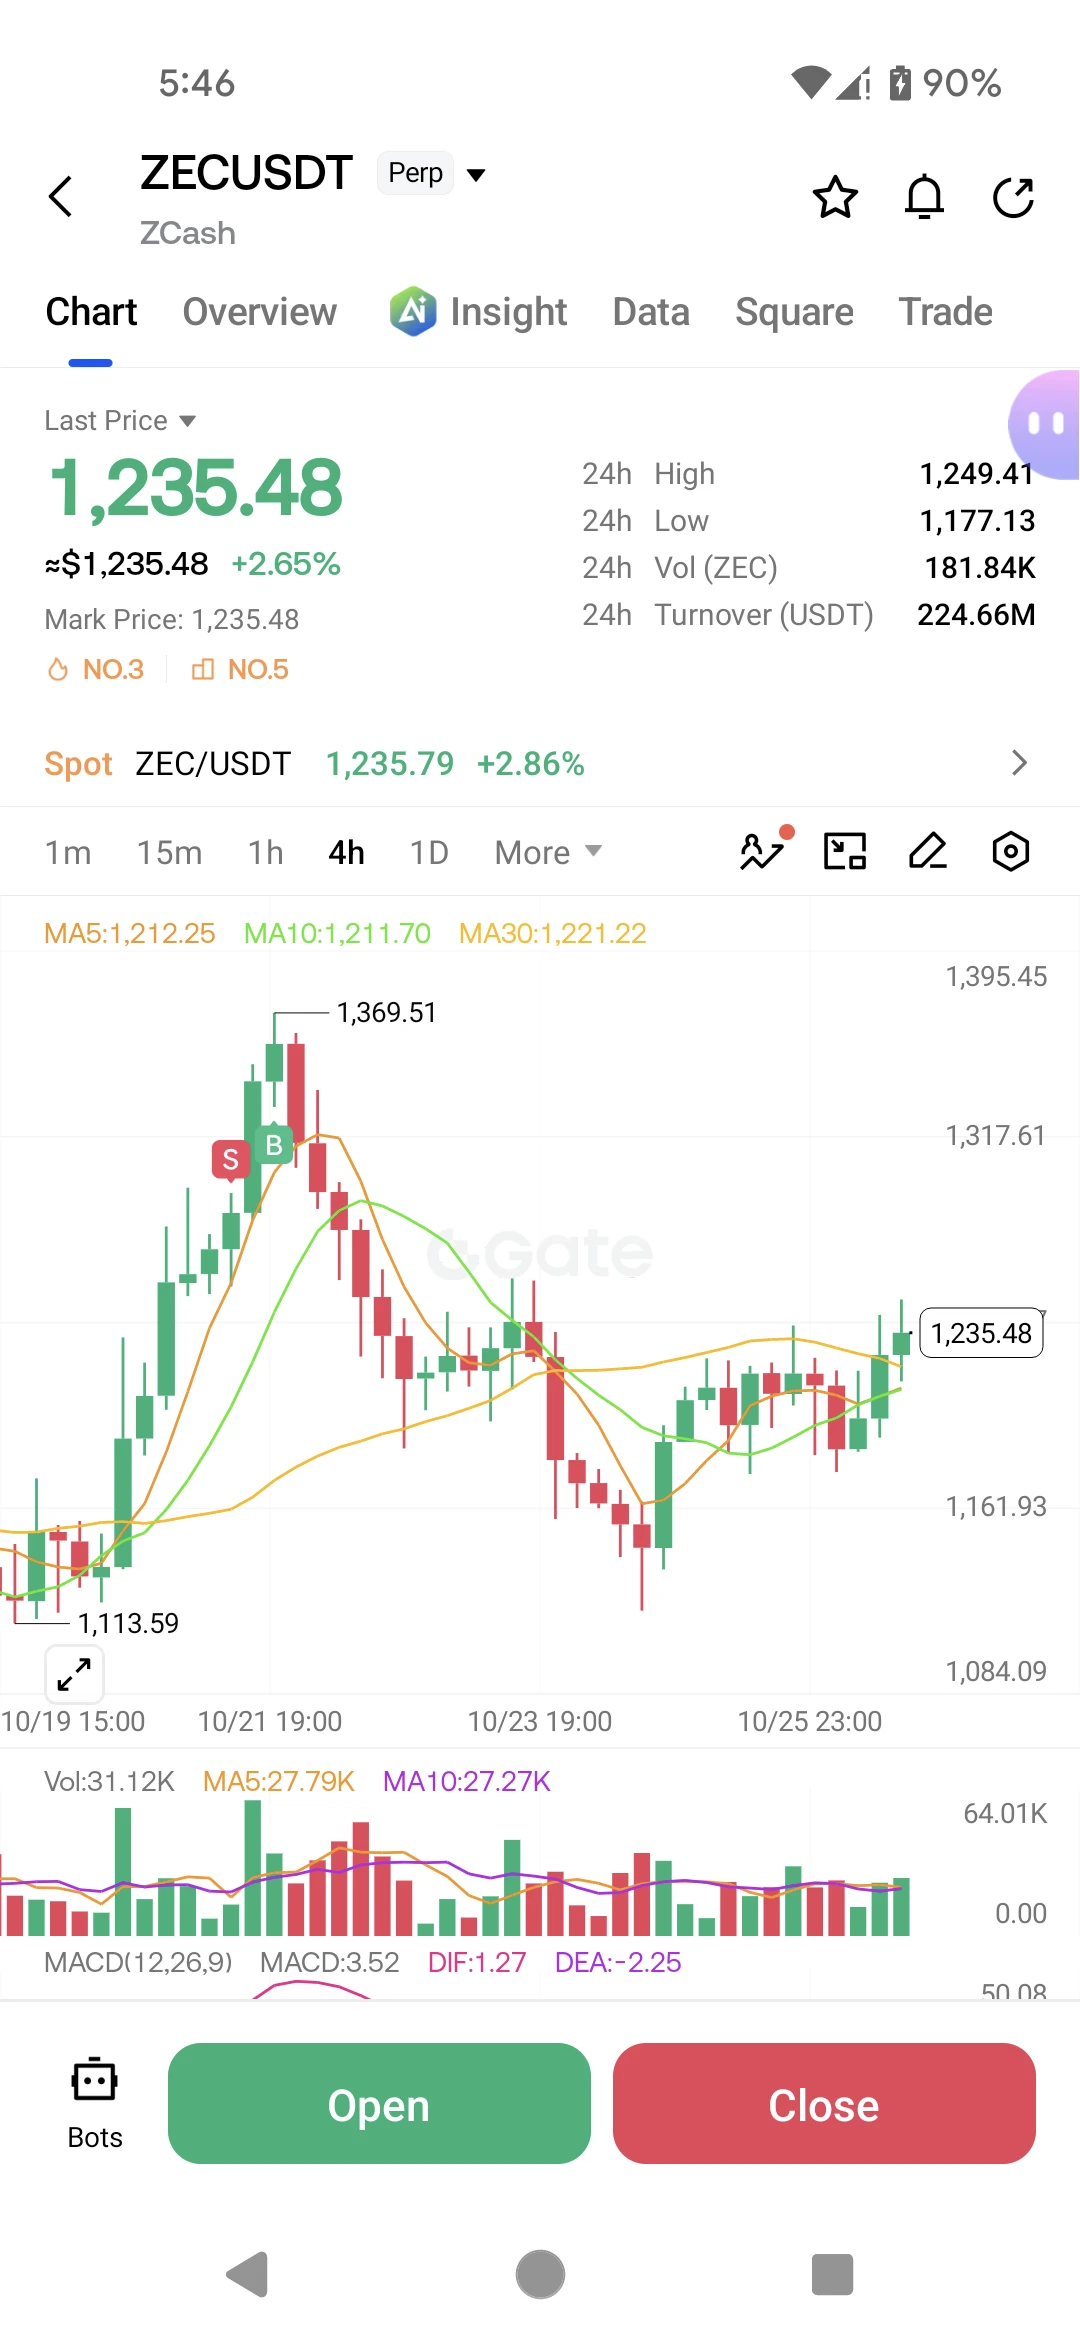
With this price action, I don’t even need to think—the account is dancing on its own. During the intraday bottoming process, $ZEC repeatedly tested 857.01 without breaking below it. I watched for a few minutes: the key level held, buying pressure was still strengthening, and it was obvious someone was accumulating through the volatility. My call at the time was simple: a pullback is an entry opportunity, not an escape signal.
The market rewards patience, and profits come from holding.
The candlesticks gradually started moving higher, and just now they touched 1161.03 directly, bringing the po
post-image
ZEC+6.66%
SNDK-2.62%
SOL+3.32%
I wasn’t watching the charts or even thinking about it—it was jumping around on its own, like it was working overtime for me.
When the market first dumped in the morning, $FOLKS looked heavily like a bull trap, with insufficient buying support, so I flagged a short around 1.972. It went straight down to 1.957, locking in +31.74%. Feels good, brothers.
Take 80% off the table first, and protect the remaining 20% at the entry price. If it keeps dumping, let the profits run.
The market is here to cure all kinds of defiance, especially for those who think they’re the smartest one in the room. Even
post-image
FOLKS-12.54%
XRP+1.10%
ADA+0.10%
Which #memecoins should we accumulate during this dip?
Something else? I'm reading your comments 👇👀
post-image
  • 2
$BZ /USDT is quietly coiling for a move most traders will miss

$BZ /USDT - SHORT

Trade Plan:
Entry: 100.38 – 100.86
SL: 102.93
TP1: 98.88
TP2: 97.73
TP3: 95.99

Why this setup?


Debate:
Are we cleanly hitting TP2 or is this range about to trap the shorts?

⚠️ Personal market analysis only. NFA — manage risk and DYOR.
Educational content, not investment advice or a recommendation to buy, sell, deposit, or withdraw any asset. No paid promotion or referral/affiliate links.
BZ-3.70%
The silence after the revelry: the price is still at the same level, but the positions are definitely not what they were before—some doubled their accounts in one trade, while others were wiped out in a single trade! There’s not much to see in the weekend market, so get some good rest. If you want to run short-term trades, just buy low and sell high between 778 and 765; making a little profit shouldn’t be a problem.
post-image
  • 1
Nobody is talking about the quiet move forming in $CL /USDT right now.

$CL /USDT - SHORT

Trade Plan:
Entry: 96.22 – 96.66
SL: 98.51
TP1: 94.89
TP2: 93.85
TP3: 92.30

Why this setup?
Why now? The daily trend is range, which means the market is coiled and waiting for a directional snap. The 1h ATR of 0.862668 shows enough hourly volatility to fuel a sharp breakdown from the entry zone near 96.44. The 15m RSI at 49.42 confirms neutral momentum, so a push below 94.57 would flip sentiment fast. TP1 sits at 94.89 and TP2 at 93.85, giving clear targets for a short play. The invalidation level at
CL-3.50%
Why is everyone ignoring the sell signal forming on $DOGE /USDT right now?

$DOGE /USDT - SHORT

Trade Plan:
Entry: 0.08402 – 0.08456
SL: 0.08684
TP1: 0.08238
TP2: 0.08111
TP3: 0.07920

Why this setup?
Why now? The 1h price is 0.08429 inside the entry zone between 0.08402 and 0.08456, and the 15m RSI sits at 48.65, showing weak momentum that favors the SHORT bias. The daily trend is range, so a break below 0.08402 could accelerate selling toward the first target at 0.08238 and the deeper TP2 at 0.08111. The 1h ATR of 0.001061 tells us the current hourly volatility is enough to reach those l
DOGE+0.96%
🇺🇸 U.S. Senate Updates the CLARITY Act — Crypto Regulation Enters a Crucial Phase
The U.S. Senate has released an updated version of the Digital Asset Market CLARITY Act, a major step toward creating a clearer regulatory framework for crypto and digital assets in the United States. (Senator Cynthia Lummis)
📜 Updated Senate text
🏛️ Clearer SEC & CFTC roles
₿ Digital asset market structure
📅 September 15 — Key Senate procedural vote
If the bill moves forward, it could become one of the most important pieces of U.S. crypto legislation and bring greater regulatory clarity to the industry.
Cry
post-image
BTC+0.59%
ETH+2.72%
#BonkGuyBullishOnUSELESS
USELESS Is Falling Hard — But Is This Capitulation or Distribution?
$USELESS is currently showing the kind of price action that deserves attention, not because a token is down sharply, but because the decline is happening alongside meaningful market activity.
The price is around $0.21127, down approximately 12.27%, while visible activity is around 8.94M. A double-digit decline combined with this level of participation tells me that there is real market engagement behind the move.
My current view is simple:
BEARISH / WATCH.
I am not treating this as an automatic buying
post-image
USELESS-8.62%
  • 1
Load More

Join 40 M users in our growing community

⚡️ Join 40 M users in the crypto craze discussion

💬 Engage with your favorite top creators

👍 See what interests you

View More