Share crypto content and earn up to 60% commissions through content mining.
placeholder
gatefun
$KOMA Making less is still better than getting liquidated 🤓
KOMA68.66%
View Original
post-image
post-image
post-image
  • Reward
  • 1
  • Repost
  • Share
太子炳:
Just go for it 👊
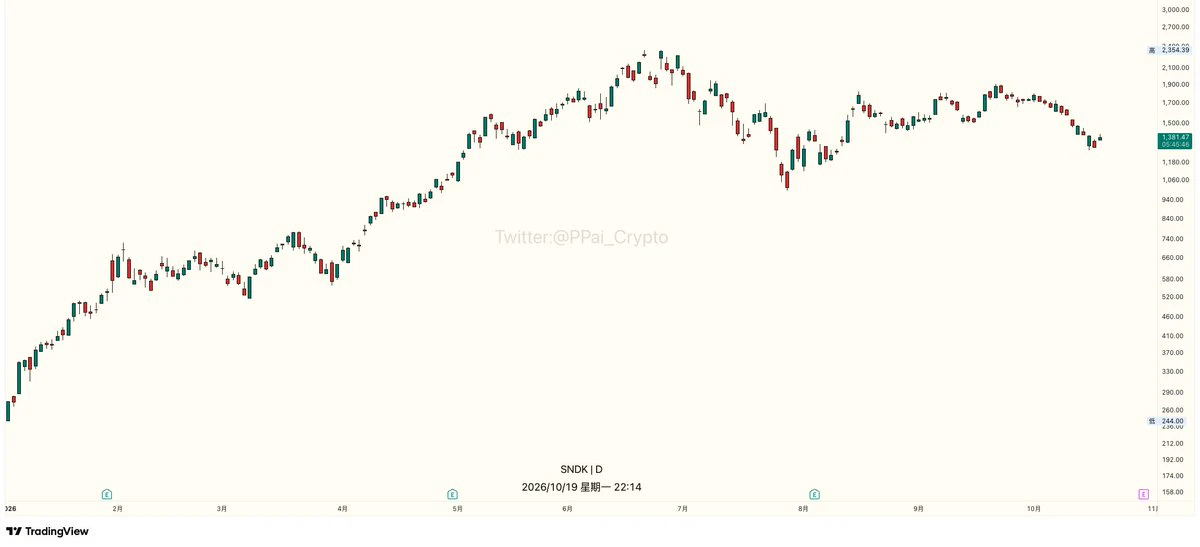
SanDisk recent price action structure:
It first surged to a peak of $1,696, then entered intense, high-level volatility; on July 29, it bottomed at $998, followed by a single-day explosive rebound to a high of $1,285, but then capital flowed out, and a long red candle dragged it back down.
Chip distribution features: the turnover rate has stayed above 14% for a long time, with extreme volatility. It’s a high-level trading tug-of-war type, with intraday gains/losses of a dozen-odd percentage points.
Major catalyst window: on August 5, Q4 earnings will be released. In the storage sector, capital
SNDK-5.11%
View Original
post-image
post-image
BTCUSDT
Long
Cross 200X
Return %
+80.7%
Entry Price(USDT)
62,667.7
Mark Price(USDT)
62,959.5
  • Reward
  • Comment
  • Repost
  • Share
Inscription “three-horse chariot” $RATS $SATS $ORDI pulls up the chart together, taking over the gainers leaderboard
Every so often, the inscription “three-horse chariot” has to stir things up
I remember last year it was $SATS that suddenly pumped several times!
Then it was $ORDI pumping several times over the past two months
Now it’s $RATS pumping several times
Why did I choose to DCA into inscriptions $ORDI ?
Because inscriptions are really like a centipede that dies but doesn’t stiffen—still lingering for a long time
At some point, it’ll hit you with a big one!!
As alway
RATS90.99%
SATS15.33%
ORDI8.74%
BTC-2.07%
View Original
post-image
  • Reward
  • 1
  • Repost
  • Share
My $budi
Gihvutvj8wvAFLrazDgoHewwfy75ozjv3bGGdr87pump
#crypto #altcoins $sol
SOL-1.61%
post-image
  • Reward
  • Comment
  • Repost
  • Share
Esports Prediction ( FOX 1 VS GEN ) league of legends
gate liveLIVE
620
  • Reward
  • Comment
  • Repost
  • Share
#BTC
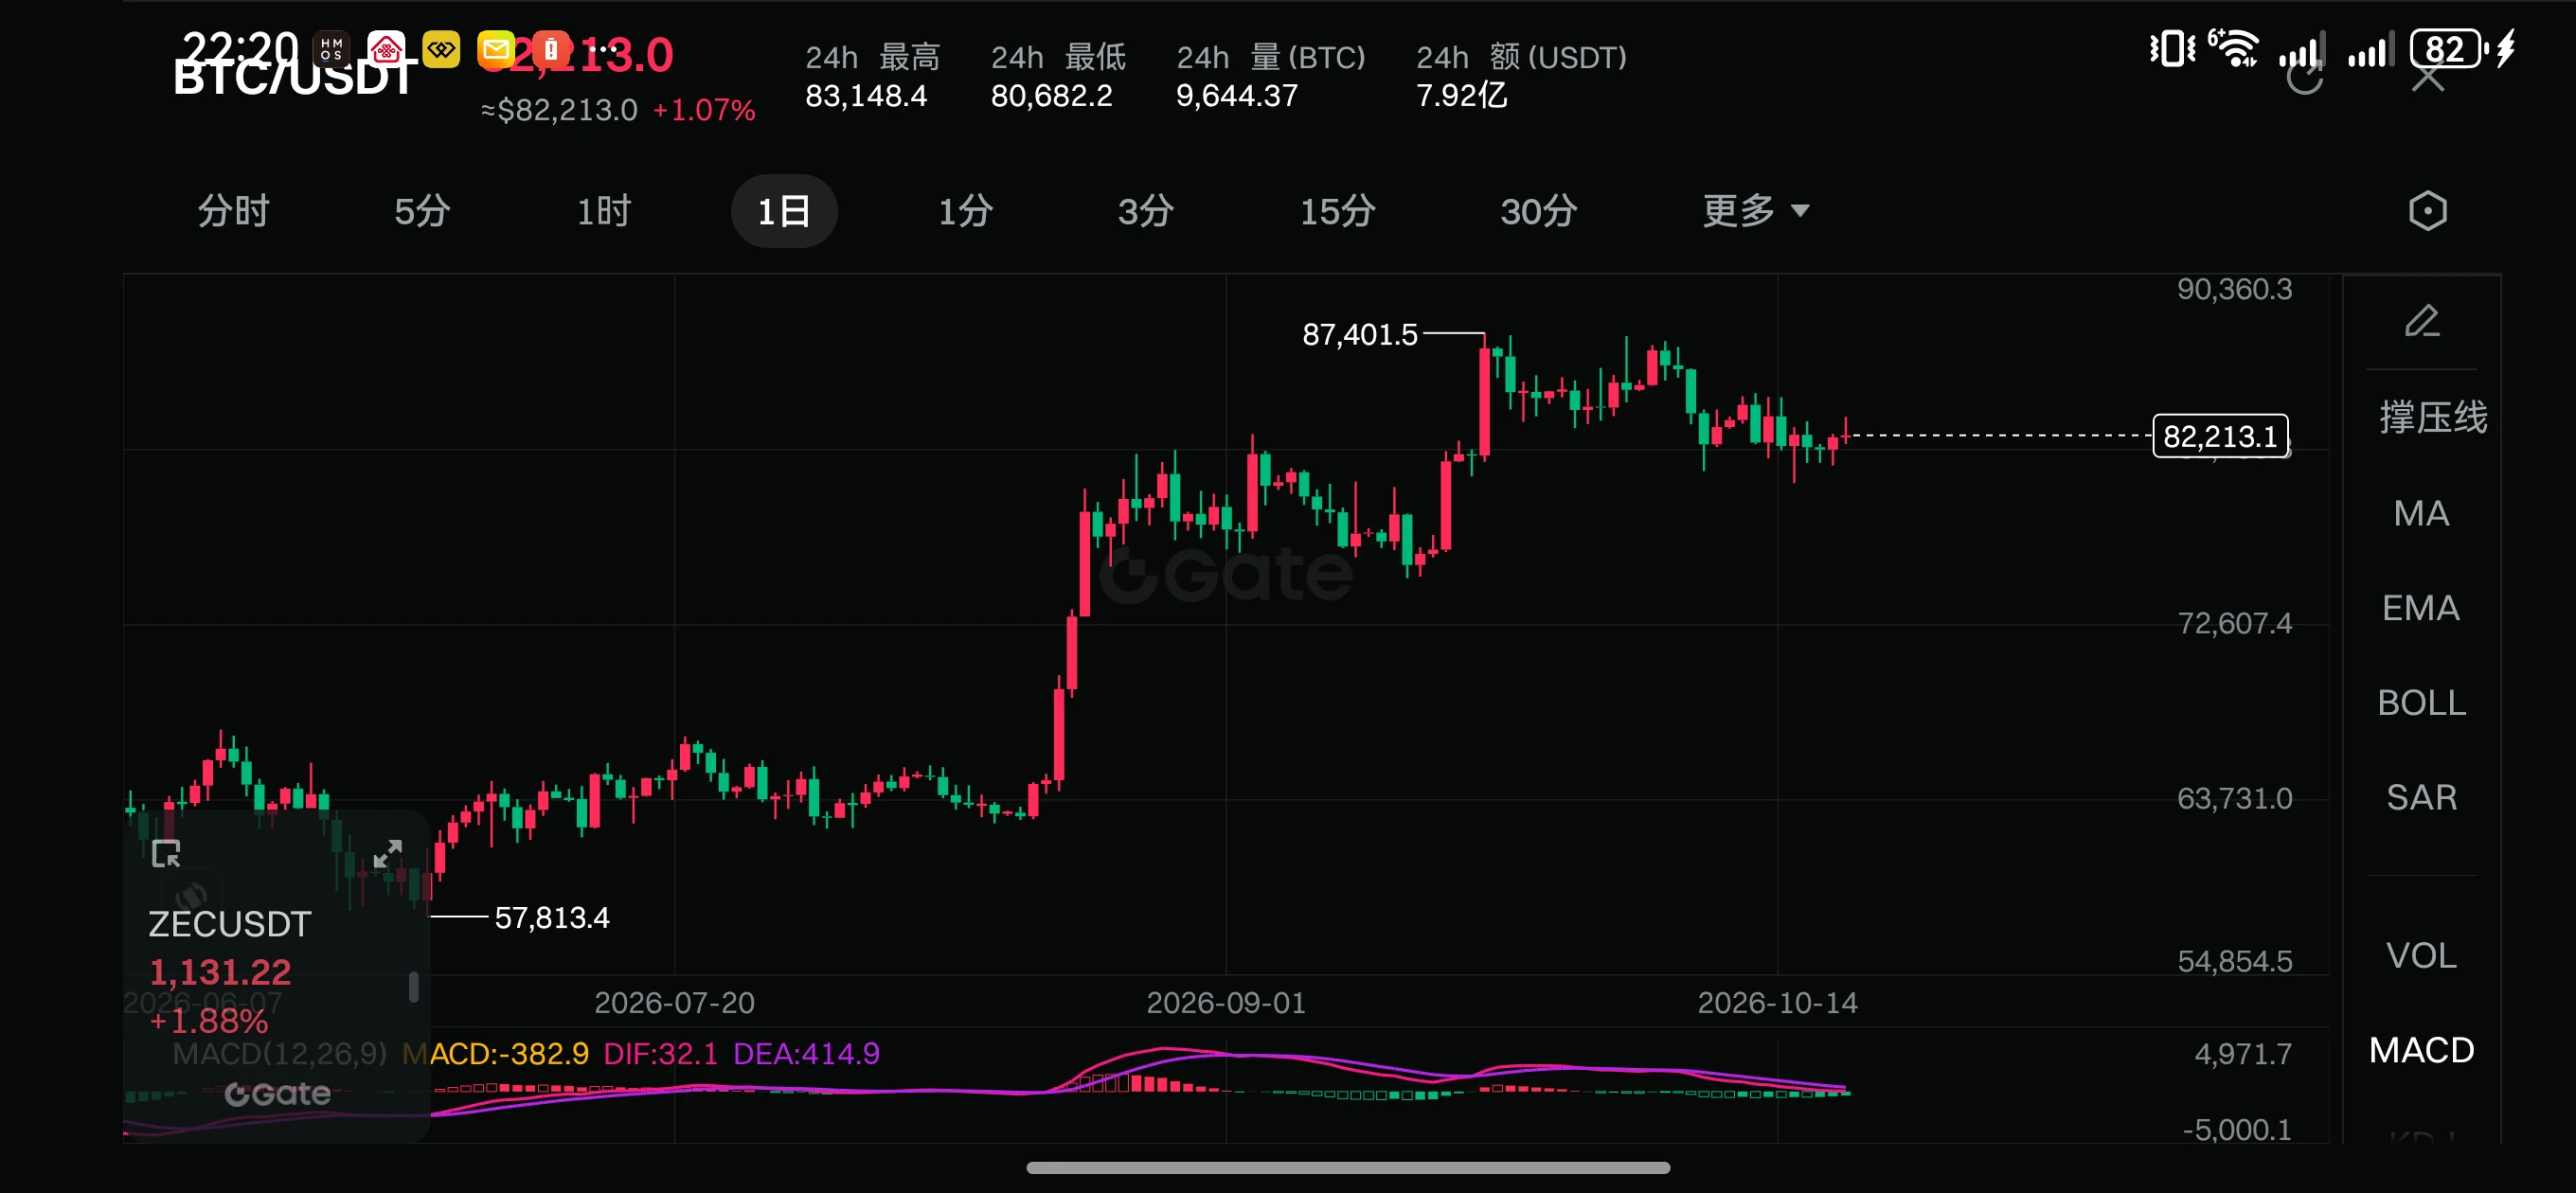
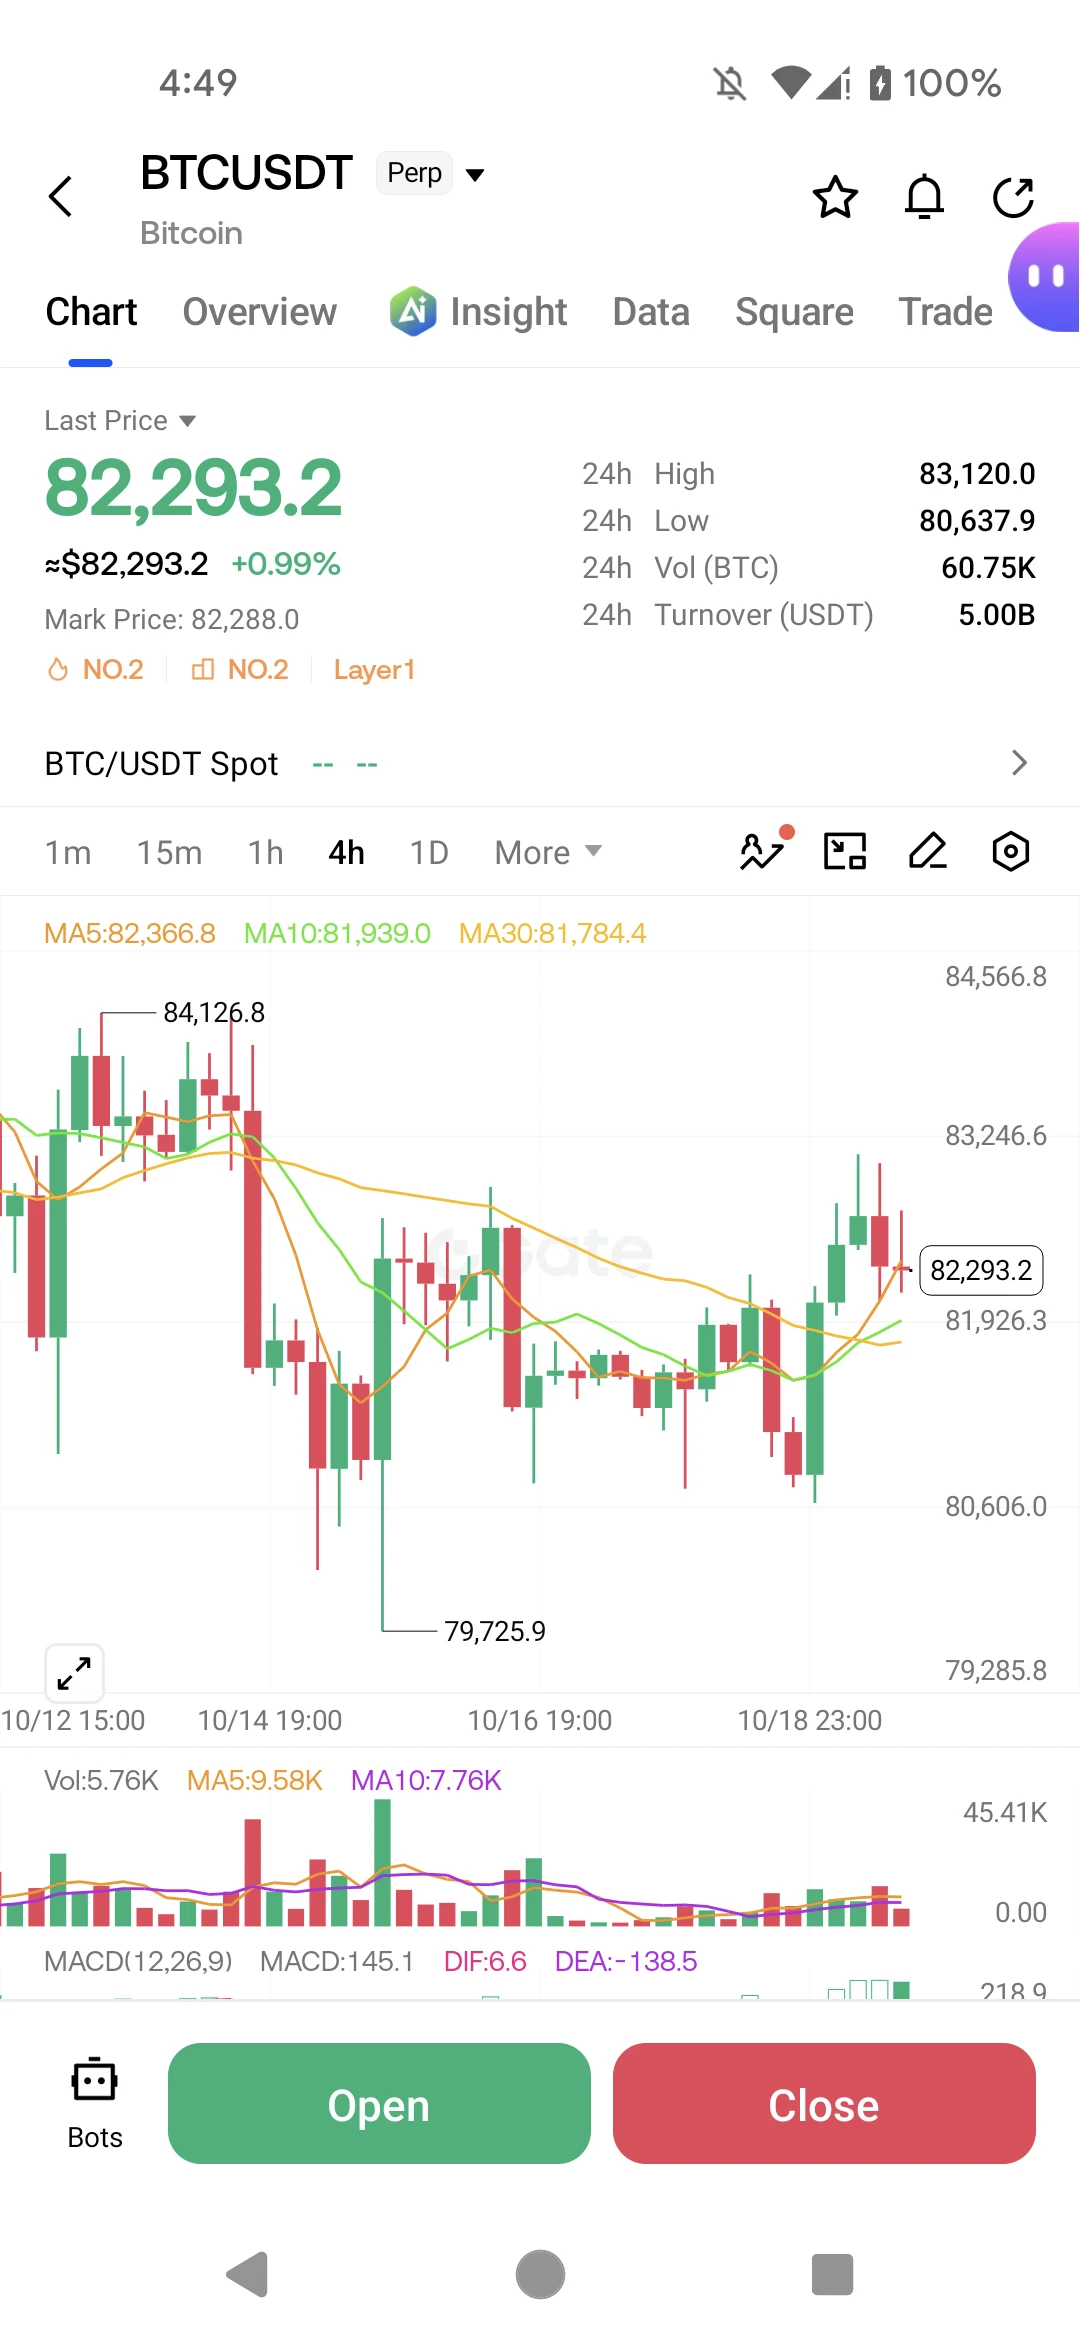
Three consecutive green candles hold steady! The concentrated washout by the bears has ended. The biggest risk for the market right now isn’t a drop, but differentiation.
On Friday, July 31, the crypto market continued its weak “repair” rhythm. Bitcoin made three small consecutive bullish candles, firmly holding the crucial $64,000 support. Many people think that three straight reds mean the trend will directly take off, but the actual order book is not that optimistic. The biggest feature of the market right now is: the index is recovering, but sentiment remains cold. Price stabilizes, y
BTC-2.10%
ETH-1.99%
SOL-1.61%
BNB0.00%
ADA-0.22%
View Original
post-image
post-image
ThisIsTranslateContent:
#BTC
Three consecutive green candles stabilize! The liquidation cascade by shorts has ended. The biggest risk in the current market isn’t a drop, but differentiation
On Friday, July 31, the crypto market continued its weak recovery rhythm. Bitcoin steadily printed three consecutive small bullish candles, successfully holding the crucial $64,000 support level. Many people see three straight reds and think the market will directly take off, but the actual tape isn’t that optimistic. The biggest features in the market right now are: the index is recovering, sentiment is cold, price stabilization remains while disagreements are extremely high. The Fear and Greed Index is still in the Fear zone. The long/short game is very tight—this is a typical structural differentiation market, not a broad-based bull market rebound.
1. True market condition: the overall market holds, but strength and weakness are completely split
As of the intraday tape, BTC was still consolidating around $64,800. It closed up slightly over the past 24 hours, firmly defending the $64,000 support zone. Near-term overhead pressure is concentrated around 65,000—65,300. In contrast, ETH is much weaker. It follows the market rebound in sync, but the rebound strength and capital recognition are far inferior to Bitcoin. Spot ETF inflows fluctuate repeatedly and it can’t break out into an independent trend—right now it’s entirely in a passive follow mode.
The most obvious feature of the market at the moment is extreme capital clumping. Top-chain assets with ecosystems and narratives like SOL, BNB, and ADA have very strong downside resistance; they base and turn stronger in an adverse environment. Meanwhile, the vast majority of altcoins—obscure “shitcoin” style coins with no deployed narrative—are basically seeing small gains with minimal follow-through. When the overall market doesn’t move, they go sideways and drift downward. A general advance rally has completely disappeared, and the era of mindlessly riding to profit is over. What’s most worrying now is: the overall market looks red-hot, but your own altcoins stay unmoving, wasting the time window of the rally.
2. On-chain liquidation: shorts exit in batches, near-term selling pressure
The main driving force behind this entire run of three straight green candles is a concentrated liquidation clearance from short leverage. Total liquidations across the whole network in 24 hours exceeded $147 million, with short positions liquidated at close to $93 million, accounting for more than 60%. Many short positions from earlier that bet on continuing to fall deeper have all been washed out in bulk. The passive bid buys lifted the market and helped it hold support.
But one misconception must be corrected here: washing out shorts doesn’t mean a straight-line, one-way surge. The biggest problem in the market now is that there’s no incremental retail capital entering. Market confidence is weak, and multi-layered trapped positions above are clearly suppressing price. Shorts have finished their run, but longs aren’t stepping in to take the relay. In the short term, it’s highly likely to keep oscillating within a range—grinding the market, rotating positions and exchanging chips. The institutional signals are relatively healthy: BTC spot ETFs have ended the streak of continuous outflows and have seen small amounts of return inflows. This suggests the adjustment is just a “shakeout and turnover” in the middle of a bull market, not a trend reversal into a bear market.
3. Macro + industry: a vacuum of negative catalysts, a clear main line
The reason the market has been able to hold up recently is that external negative catalysts are temporarily in a lull.
First, the US Federal Reserve’s July meeting kept rates unchanged. Inflation data cooled, rate-cut expectations warmed, and the US dollar weakened—providing a mildly supportive environment for risk assets to recover in the short term. There’s no macro sell-off trigger in the immediate period.
Second, the US CLARITY regulatory bill is nearing the parliamentary recess. It’s unlikely to land in the near term. The market’s main concern—regulatory tightening as a negative catalyst—is being partially alleviated as uncertainty materializes less.
Third, the real medium- and long-term main narrative is already very clear. Hong Kong financial reforms continue to roll out. The HKD-compliant stablecoin ecosystem is accelerating its formation, and the RWA tokenization narrative of real-world assets continues to strengthen. Traditional financial institutions are steadily moving in to set up positions in on-chain assets. This is the steadiest and most repeatable main track for the second half of the year.
4. Track selection: only do the leading mainline, stay away from pure hype garbage rallies
In the current choppy and differentiated market, choosing coins is more important than judging up or down.
✅ Focus on leading public chains and the RWA asset tokenization track. There’s policy support, institutions involved, and a continuous narrative—high capital recognition. In a range-bound market, it’s easier to develop an independent trend.
❌ Firmly avoid MEME, pure emotion-driven speculation, and “three-no” altcoins with no ecosystem, no deployment, and no capital. These coins’ rebounds are extremely short-lived. Chasing the pump means becoming the bag-holder, and the margin of error is very low. In addition, the DeFi sector is still cooling down. There are no signals of a rebound in on-chain activity. Continue to observe in the short term and don’t casually bottom-pick.
5. Outlook & trading approach: don’t bet on one-way moves, strictly control position size
BTC short-term range support: 63,600—64,000 resistance: 65,000—65,300
1、A valid breakout above the 65,300 resistance level breaks the consolidation structure, opens up room for the rebound, and you can add positions moderately in line with the trend;
2、A valid breakdown below the 63,500 support level means this corrective recovery is over, and the risk of the next pullback returns. You need to reduce positions in time to manage risk.
This article is only for market review and analysis and does not constitute any investment advice$BTC
  • Reward
  • 4
  • Repost
  • Share
ThisIsTranslateContent::
Go for it 👊
View More
#Market Analysis Today
Bitcoin Dives Below $63k at the Start of August, Nearly 100k Liquidations
On the morning of August 1, 2026, the crypto market hit a “black start” on the first trading day of August. Bitcoin fell below the $63k threshold, with a low around $62,400; Ethereum also slipped to around $1,850. Over the past 24 hours, the total liquidation amount across the entire network reached $362 million, and more than 90k investors were forcibly liquidated during the selloff.
Late on July 31, major crypto assets slid across the board. Bitcoin fell by more than 3%, Ethereum dropped 3%, and
BTC-2.07%
ETH-1.99%
DOGE0.04%
SOL-1.61%
XRP-1.53%
View Original
post-image
post-image
ThisIsTranslateContent:
#Market Watch: Today’s Analysis
The month of August got off to a “plunge” with Bitcoin dropping below $63k, and nearly 100k liquidations wiped out
On the morning of August 1, 2026, the crypto market hit a “black start” on the first trading day of August. Bitcoin fell below the $63k level, with a low near $62,400; Ethereum also slipped to around $1,850. In the past 24 hours, the total liquidation amount across the whole network reached $362 million, and more than 90k investors were forced out in the selloff.
At the night of July 31, major crypto assets were broadly hit by a sharp drop. Bitcoin fell more than 3%, Ethereum dropped 3%, and Dogecoin slid 2.31%. The probability of a Federal Reserve rate hike in September has jumped to about 82%, and macro headwinds have continued to pressure the valuations of risk assets. After a mild rebound for three consecutive days, the crypto market failed to hold the $65,000 level and kicked off August with a single bearish candle.
01 Market Overview: Bitcoin slips below $63k, Ethereum falls back to $1,850
As of the morning of August 1, Bitcoin saw a notable pullback. Data shows BTC/USD’s latest traded price is about $62,972-$62,980, down roughly 2.50%-2.73% over the past 24 hours, with an intraday range of $62,458-$65,258. Bitcoin has continued to decline since the July 31 high above $65,000, losing the $63,000 threshold. Ethereum also weakened in tandem. ETH/USD’s latest traded price is about $1,866-$1,867, down roughly 2.27%-2.30% in the past 24 hours, with an intraday range of $1,848-$1,933. Ethereum has broken below the $1,900 integer level; the 52-week low is around $1,385. Major altcoins are broadly down.
According to data from 东方财富 (Eastmoney), as of the evening of July 31, Solana fell 2.13% to $73.02, XRP fell 3.13% to $1.0597, Dogecoin fell 2.31% to $0.06894, and BNB fell 1.11% to $585.09.
02 Core drivers behind the decline: Macro headwinds plus technical resistance
First driver: Fed rate-hike expectations keep heating up, with September probability rising to 82%
At the macro level, the continued rise in rate-hike expectations is the most core variable pressuring the crypto market. CME FedWatch shows the probability of a September rate hike is up to about 82%. The logic chain is clear: Bitcoin produces no cash flows, so its valuation relies entirely on expectations for future liquidity. Once risk-free interest rates rise, capital is drawn toward assets with real yield, and Bitcoin is naturally sold first. With ongoing international instability and geopolitical conflicts pushing up oil prices, inflation pressure has returned, fully reversing the market’s earlier expectation of a rate-cut cycle in the first half of the year.
Second driver: Institutional capital continues to exit, and ETF inflow expectations are downgraded
Another major source of pressure is ongoing net outflows of capital. As of early July, Bitcoin spot ETFs had recorded net outflows for eight straight weeks. In Q2 2026, the total net redemptions of Bitcoin spot ETFs hit the largest quarterly outflow since the product launched in January 2024. Citigroup even took a pessimistic view, assuming that in the coming year there will be no record of net inflows into ETFs again. This extreme pessimism reflects institutions’ cautious stance on the crypto market’s medium-term outlook.
Third driver: Large-scale selling by miners worsens supply pressure In Q1 2026, publicly listed Bitcoin mining companies collectively sold more than 32,000 BTC—exceeding the total for all of 2025.
The root cause of the large-scale selling is that mining economics deteriorated sharply after the halving. After the April 2024 halving, the miner reward per block fell from 6.25 BTC to 3.125 BTC. Some mining firms’ production costs can be as high as $78,000, while the spot price is only between $63,000 and $65,000.
Fourth driver: Technicals hit a wall at the key resistance around $66,300
On the technical front, Bitcoin started to pull back after failing to break through the historic resistance at $66,300. Analysts said that once Bitcoin was rejected at this level, it opened the space for a downside test of the $60,800-$58,300 support area. Ethereum also turned lower after the $1,985 resistance level, with target supports pointing to $1,785, $1,700, and $1,535.
03 Liquidation storm: $362 million wiped out, and more than 90k get forced out
Over the past 24 hours, as the market broadly plunged, chase positions were hit by large-scale liquidation. According to CoinGlass, in the past 24 hours, the total liquidation amount across the entire network reached $362 million, including $236 million liquidated from long positions and $126 million liquidated from short positions. Longs were the worst affected side in this selloff. Globally, more than 90k investors were forced to close.
Key liquidation trigger zones: CoinGlass data shows that if Bitcoin falls below $59,951, the cumulative liquidation strength of longs on major CEXs would reach $951 million; conversely, if Bitcoin breaks above $66,155, cumulative liquidation strength of shorts would reach $63k. The $59,951-$66,155 range is the market’s most critical “liquidation trigger point” right now.
04 Technical analysis: $63,000 becomes a new resistance, and the $60k level faces a test
Bitcoin (BTC) current price: about $62,970-$62,980 Core support: $62,458 (intraday low); $60,800 (next support indicated by technical analysis); $59,951 (a break below triggers $951 million long liquidation) Resistance above: $63,800-$64,500 (short-term rebound resistance); $65,000 (July rebound high); $66,155 (break triggers $100k short liquidation) Technical structure: After being rejected at the key resistance around $66,300, Bitcoin continued to fall, dropping more than 3%. The 4-hour timeframe shows a clear “rally-failure and pullback” structure, with short-term bearish momentum dominant. Analysts believe that failing to break the historic resistance opens room for a retracement toward the $60,800-$58,300 area.
Ethereum (ETH)
Current price: about $1,866-$1,867 Core support: $1,848 (intraday low); $1,785 (next support indicated by technical analysis); $1,700 (strong support) Resistance above: $1,900 (already broken, now resistance); $1,950-$1,985 (strong resistance zone) Technical structure: Ethereum turned downward after starting from the $1,985 resistance level, with the daily close below $1,900. Analysts say that if it cannot hold $1,848, downside momentum could accelerate, targeting the $1,785 even the $1,700-$1,535 range.
Seasonal signals worth watching
Despite near-term pressure, the ETH/BTC ratio has shown signals worth noting. In the first seven months of 2026, ETH/BTC was negative in five months, down about 14.3% year-to-date, but as of July it is +8.3%. Based on historical seasonal data, August is the second-strongest month for ETH performance, with a median of +6.9% and an ETH outperformance rate of 60%. If ETH/BTC closes higher in July and the gain exceeds 5%, August historically tends to deliver positive returns as well. But the seasonal window closes starting in September—September’s median is -8.1%, October’s median is -12.0%, and the ETH outperformance rate drops to only 20%.
05 Outlook: The $60k level becomes August’s key line of defense
In the short term, August’s first trading day’s plunge breaks the prior three-day mild rebound rhythm. The strength of support below $63,000 is the key point to watch. If it holds the $62,458 intraday low, the market may enter a consolidation and repair phase in the $62,000-$64,000 range; if it breaks below, $62,000 and even $60,000 will face a test. For Ethereum, $1,848 is the first line of defense in the short run; if that level fails, the focus shifts to the $1,785-$1,700 range.
In the medium term, the macro headwind of a rising September rate-hike probability to 82% remains the market’s biggest uncertainty. Bitcoin has closed lower for two consecutive quarters—similar situations have only happened three times in history (2014, 2019, and 2022). Whether history can break this pattern depends on whether the macro environment improves at the margin.
On August’s first trading day, the crypto market saw a significant pullback under the double squeeze of macro headwinds and technical resistance. Bitcoin fell from above $65,000 to below $63,000, while Ethereum broke below $1,900. More than 90k investors were forced to liquidate during last night’s plunge, and $362 million was wiped out. $63,000 (BTC) and $1,850 (ETH) have become the most critical short-term defense lines for the start of August—holding would keep the choppy range intact; losing would put $60,000 and $1,700 under pressure. The Fed rate-hike outlook, selling pressure from miners, and technical resistance at $66,300 together form three layers of headwind suppressing the market. Until macro signals become clearer, staying cautious and tightly controlling positions remains the rational choice to protect principal.
repost-content-media
  • Reward
  • 5
  • Repost
  • Share
ThisIsTranslateContent::
Hurry up and get on board! 🚗
View More
🍬 #CandyDrop Airdrop for everyone—1,000 $SKHYG is being delivered hot and fast
Each user can receive up to 1.5 $SKHYG ≈ 230 $USDT
Unlock the prize pool benefits:
🔹 Deposit any contract-trading stock-zone token to share the prize pool; users who make contract trades for the first time get additional bonus boosts—together, share a prize pool worth over $100,000
🔹 Successfully invite friends through your exclusive CandyDrop link and share a prize pool worth over $50,000
Big target surge—profits double!
Join now 👉 gate.com/candy-drop/det…
#GateFutures
SKHYG-7.41%
View Original
post-image
post-image
  • Reward
  • 4
  • Repost
  • Share
Crypto_Beauty:
DYOR 🤓
View More
(New Streamer)World Cup Prediction
gate liveLIVE
311
  • Reward
  • Comment
  • Repost
  • Share
The treasure pouch can open cards, which can be exchanged directly for keys
Players can also choose to keep them and wait for the card game mode
View Original
post-image
post-image
  • Reward
  • Comment
  • Repost
  • Share
> New task system: Completing tasks earns fish scales and increases NPCs’ favorability
View Original
post-image
  • Reward
  • Comment
  • Repost
  • Share
Yesterday again, it produced a standard-deviation short return.
#Btc However, the near-term trading range is already very small, so we need to wait for a strong signal.
BTC-2.10%
View Original
post-image
  • Reward
  • Comment
  • Repost
  • Share
Is racist to say I cannot stand this?
People just sitting in the middle of the sidewalk doing nothing? They could have done nothing in their country.
post-image
  • Reward
  • Comment
  • Repost
  • Share
$TAG Signal】Longs pull back, 1H mid-band holds
$TAG Funding rate 0.0415%, OI stable. The 1H sharp dump hit near EMA50, while 4H is still above the mid-band. Order book depth imbalance -7.06%: sell orders are slightly thicker, and price is holding.
🎯 Direction: Go long
⚡ Entry/limit order: 0.00134296 - 0.00134700
🛑 Stop loss: 0.00133353
🚀 Target 1: 0.00136721
🚀 Target 2: 0.00137731
🛡️ Trade management:
- Execution plan: After reaching Target 1, cut 50% position, and move the stop loss up to break-even. If price drops back to the entry area, auto-exit to protect principal.
1H RSI pulls b
TAG20.35%
USD10.00%
BTC-2.07%
ETH-1.99%
SOL-1.61%
View Original
post-image
  • Reward
  • Comment
  • Repost
  • Share
#GateStocksZeroFees
Imagine receiving $10,000 to invest while paying $0 trading fees on every buy and every sell. With no account opening fee and no minimum trading-fee threshold, every dollar can go toward building wealth instead of covering transaction costs. That makes long-term investing and portfolio management far more efficient.
If I had this opportunity, I would build a diversified portfolio focused on innovation, stability, and long-term growth.
NVIDIA (NVDA) – 25%
AI, data centers, and next-generation computing continue to reshape the global economy. NVIDIA remains one of the strong
NVDA2.90%
MSFT3.01%
AMZN15.05%
BRK.B0.38%
post-image
post-image
  • Reward
  • 3
  • Repost
  • Share
HighAmbition:
Just go for it 👊
View More
$KOMA Signal】1H pullback and then go long, order book depth shows dominance
$KOMA Order book depth imbalance is 9.84%, Bid/Ask ratio is 1.22, and buy orders are thick around 0.023. After a 35% drop from the 4H move up from 0.0336, the current price 0.023142 is stuck below the 1H Bollinger middle band.
The 1H MACD histogram expands into negative territory, but RSI has returned to the neutral range at 51.7; the speed of the sharp drop has slowed. The 4H MACD still keeps a bullish structure; contracting momentum does not imply a reversal. Funding rate is 0.0236%, and the futures market is not
KOMA68.66%
USD10.00%
BTC-2.07%
ETH-1.99%
SOL-1.61%
View Original
post-image
  • Reward
  • Comment
  • Repost
  • Share
8.1 Market overview analysis
In the second-biscuit Silk Road reference layout
Entry range: near 1870—1900
XiaSong: above 1920
First target: 1830, second target: 1800
As the large-biscuit ETH Bollinger channel continues to tighten, the price is under pressure below the middle band. The trading range is compressing, and DAKong is temporarily locked in a standoff. The medium- to long-term trend remains weak; rebounds lack follow-through. After a period of narrow consolidation, it is about to move into a directional market setup. #Gate独家美股0费率 #Strategy二季度亏损82亿美元 #哈马斯与以色列达成停火协议 $BTC $ETH
BTC-2.10%
ETH-1.99%
View Original
post-image
  • Reward
  • Comment
  • Repost
  • Share
$SOL Signal】4H shorts spread, short on the rebound
$SOL The 1H rebound is weak; 4H short momentum continues to spread. Current price 73.00; bid order book ratio 0.99; depth imbalance -0.66%, with sellers slightly dominant. Although the 1H MACD forms a bullish cross, the histogram is only +0.0066, providing extremely limited upward push. The 4H MACD histogram is -0.0588, and the bearish structure remains intact. RSI (1H) is 40.83, in a weak range, so rebound room is limited. Trading volume shrinks step by step, and bid absorption is insufficient. The funding rate is 0.01%, with no short-sq
SOL-1.57%
USD10.00%
View Original
post-image
  • Reward
  • Comment
  • Repost
  • Share
August 1st.
Suddenly realized that the year has already gone through most of it.
When I was a kid, I always felt time moved slowly; later, though, I started to feel that days were speeding by.
In fact, time has never changed—the only things that have changed are our mindset and the way we see the world.
Looking back, over the past several months, many things didn’t happen according to plan. But it’s precisely through these unexpected twists, detours, and letdowns that we’re able to come to know ourselves more deeply—and to understand again our relationship with this world.
August.
View Original
post-image
  • Reward
  • Comment
  • Repost
  • Share
【$1000RATS Signal】Go long + 1H wick retracement recovery
$1000RATS After quickly recovering from the 1H wick at 0.04341, the current price is 0.04496. RSI(1H) is 49.3, MACD(1H) is a dead cross, and the green histogram hasn’t expanded. The 4H Bollinger Bands have opened, with price running above the mid band. The order book buy ratio is 1.08, depth imbalance is 4.02%, and sell-side orders are concentrated below with dense incoming orders. The funding rate is 0.0864%, long leverage is heavy, and OI is steady.
🎯Direction: Go long
⚡Entry/Orders: 0.0448251 - 0.0449600
🛑Stop loss: 0.044341
BTC-2.07%
ETH-1.99%
SOL-1.61%
View Original
post-image
  • Reward
  • Comment
  • Repost
  • Share
Load More

Join 40 M users in our growing community

⚡️ Join 40 M users in the crypto craze discussion
💬 Engage with your favorite top creators
👍 See what interests you
  • Pinned