











Square
Following
Hot
News
Profile
Share your thoughts
placeholder
Article
$G USDT — Bulls Up 19.4%, But Can Momentum Hold?
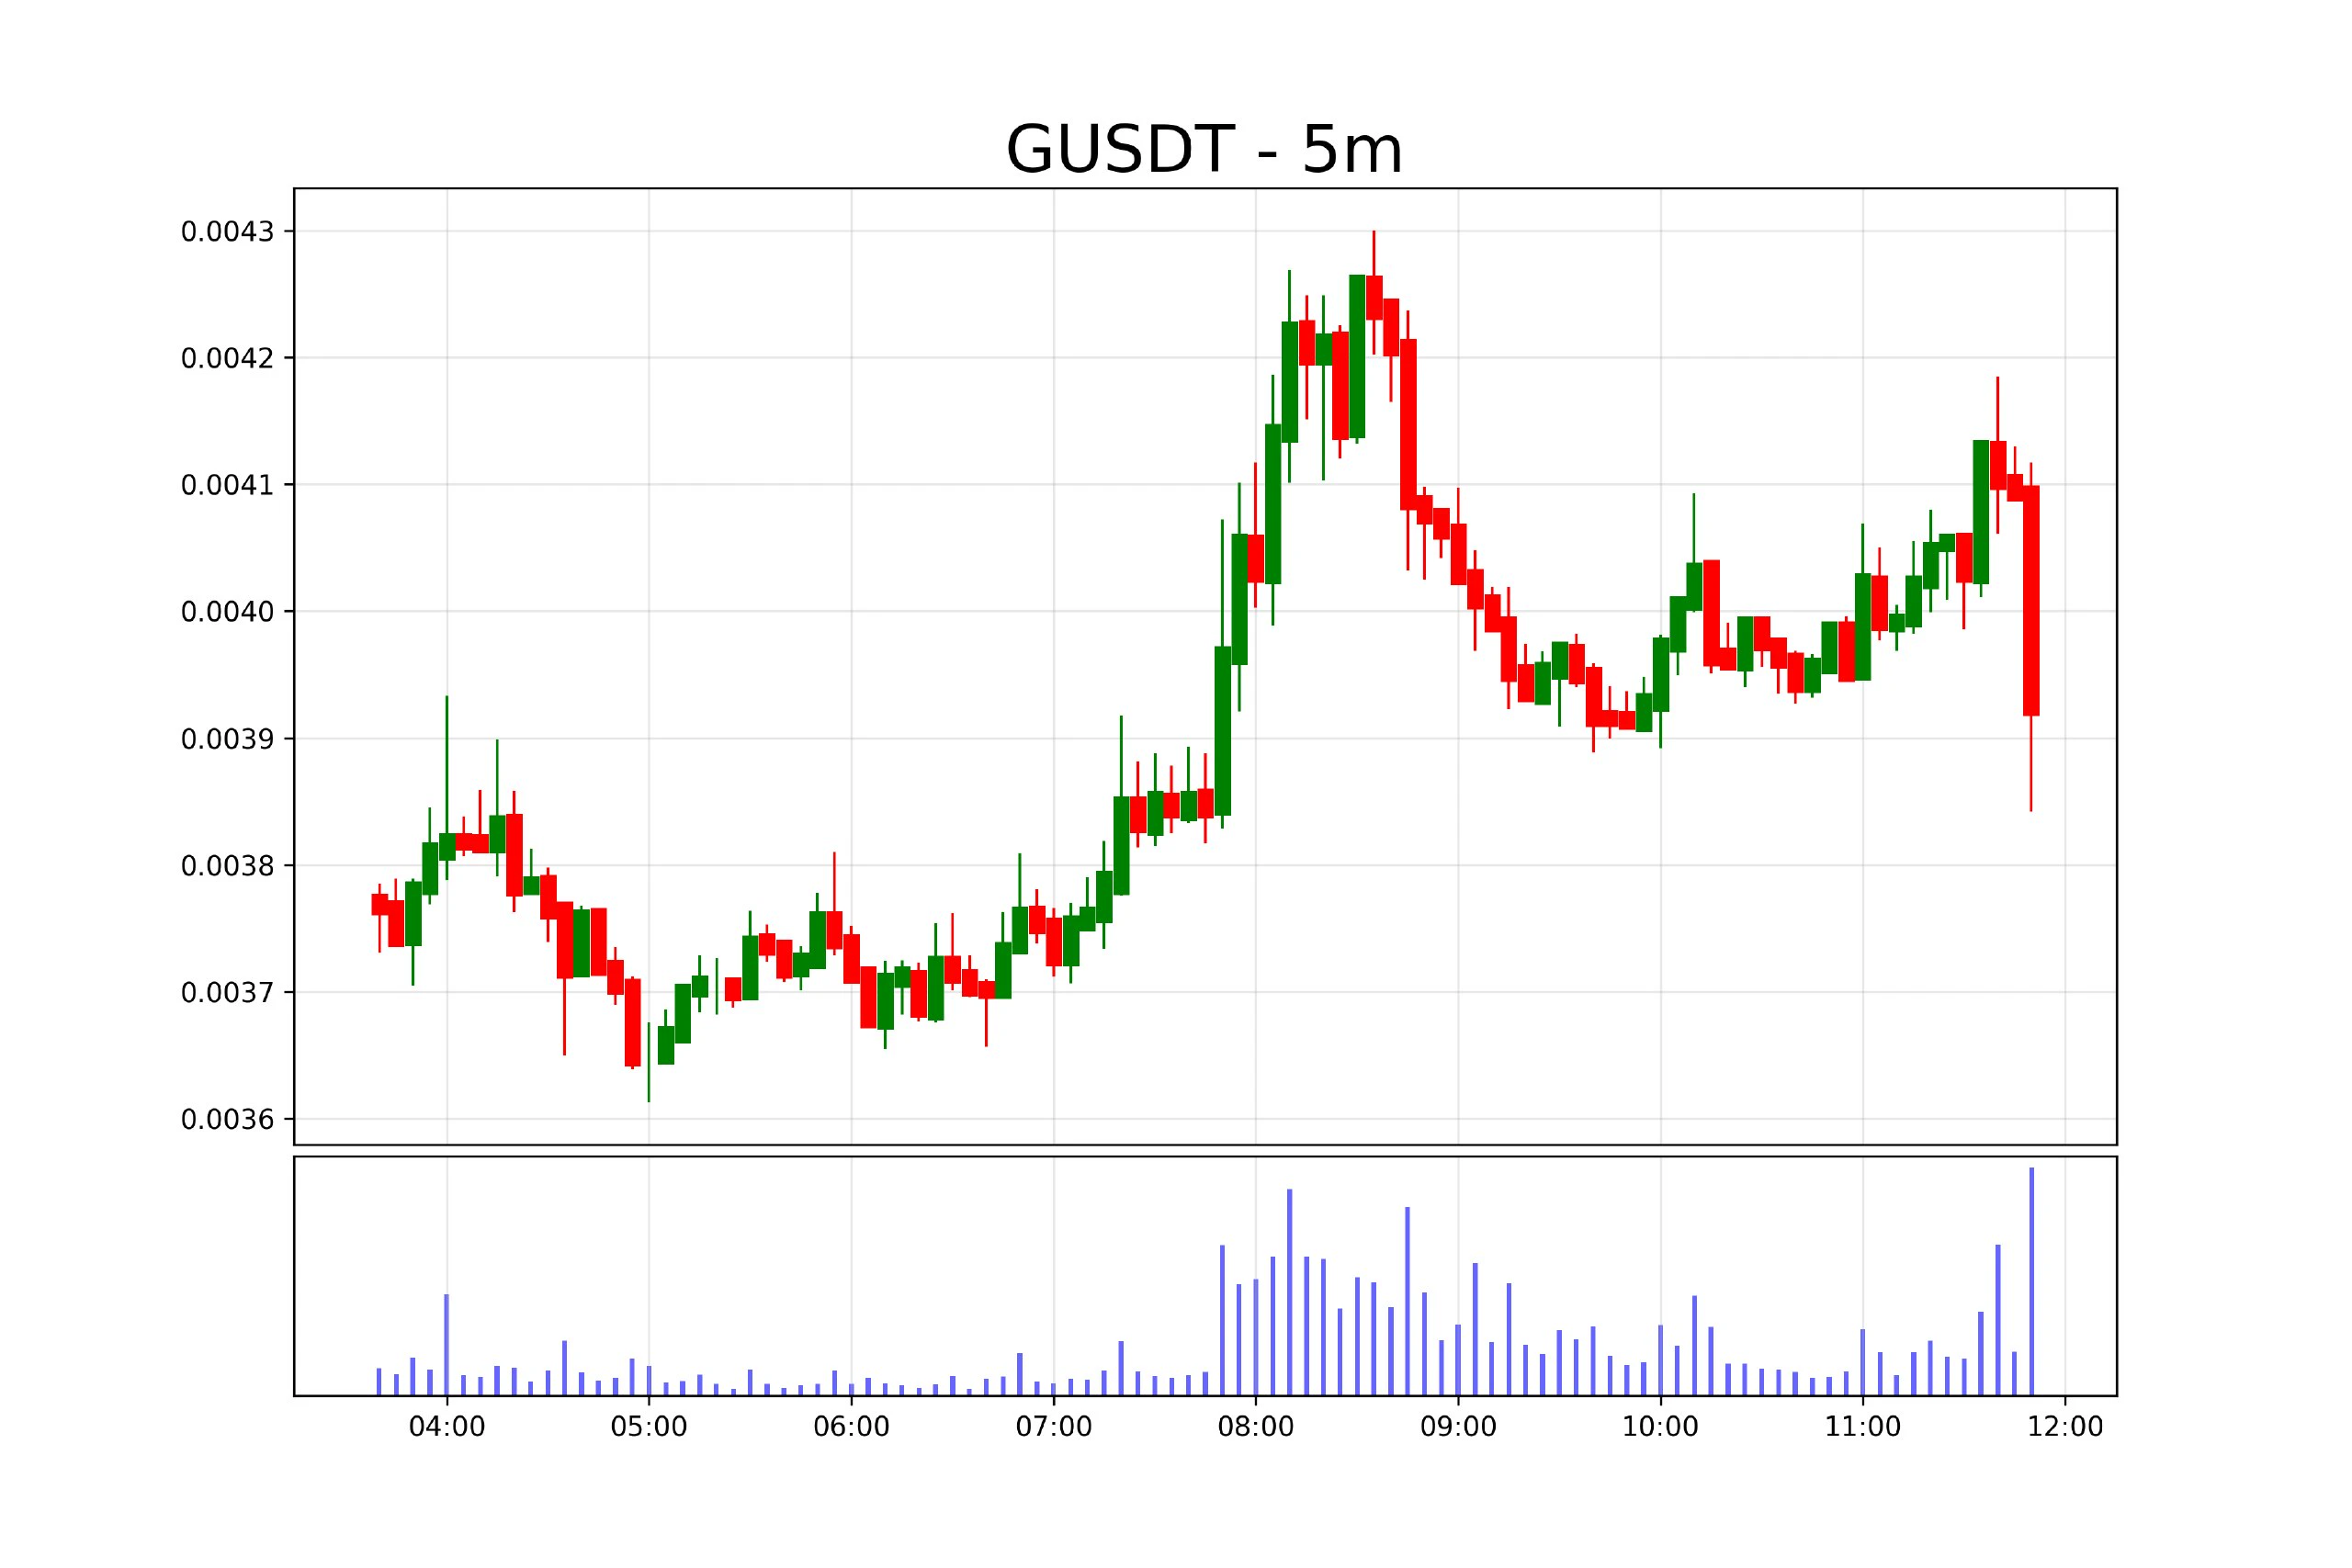
G is trading near $0.003924 after a strong 19.4% daily gain. Volume is up 291.2%, with $86.72M in reported 24-hour turnover. Despite the strong performance, the recent 4.13% drop suggests traders should watch for profit-taking.
Support: $0.00380 – $0.00387
Resistance: $0.00405 – $0.00415
TP1: $0.00420
TP2: $0.00435
Final Target: $0.00450
SL: $0.00372
Holding support and breaking $0.00415 could extend the rally. A breakdown below support would weaken the bullish setup. Avoid chasing price after a sharp move.
$G ‌
post-image
G-2.86%
Buying the range lows here; let's bounce this dead cat back to mid-range!Bullish trade on $ENA $ENA .Entry zone: 0.18632 - 0.18726TP1 0.19582 | TP2 0.20304SL 0.18073Be careful: A breakdown below the 24h low support would invalidate the range bounce thesis instantly.Never all-in, fam. Use a size that fits your own account.
post-image
ENA+8.04%
Trenches
ZIG
Z
bade
b
ZIG
0x8c...1145
Market Cap
$.
Change
.
24h Vol
$.
Holders
.
KIM
K
bade
b
KIM
8pjf...pump
Market Cap
$.
Change
.
24h Vol
$.
Holders
.
BTC
B
bade
b
BTC
C5xp...pump
Market Cap
$.
Change
.
24h Vol
$.
Holders
.
GTA6
G
bade
b
GTA6
4kjr...zDnz
Market Cap
$.
Change
.
24h Vol
$.
Holders
.
Anakin
A
bade
b
Anakin
Exxz...pump
Market Cap
$.
Change
.
24h Vol
$.
Holders
.
From Understanding to Action: Building Your Own Web3 Risk Assessment Framework
Today, we discussed many questions around digital asset ownership, private keys, smart contracts, on-chain restrictions, administrator privileges, open-source code, security audits, and project transparency.
These questions may seem different, but they actually point to the same core issue:
In the Web3 world, how can we avoid relying on other people’s conclusions and gradually build our own ability to assess risk?
I believe what truly matters is not how many technical terms you can remember, but knowing what to chec
post-image
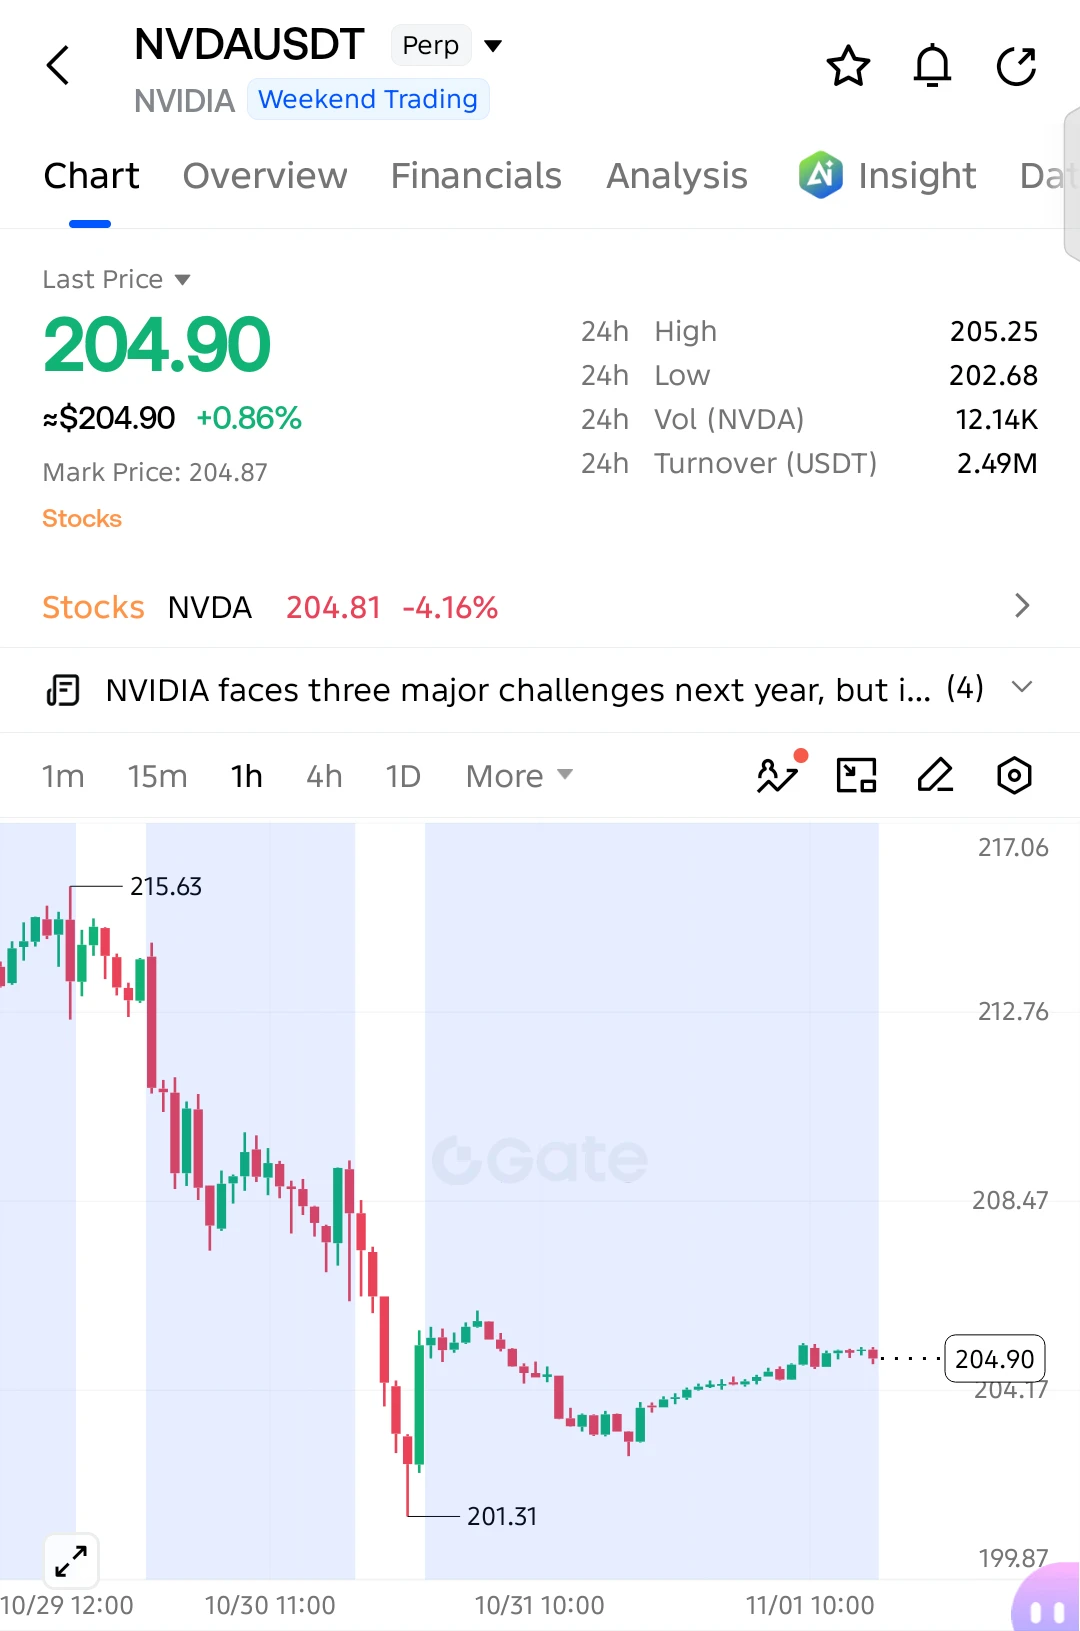
$NVDA long setup — next target 210.00
Entry: 204.90
SL: 202.50
TP1: 206.50
TP2: 208.50
TP3: 210.00
Extended Target: 212.75
$NVDA is showing signs of recovery on the 1H chart after a sharp decline from 215.63 to 201.31. Buyers have gradually pushed the price higher, forming short-term higher lows around the 204–205 area.
A confirmed breakout above 205.25 could open the door toward 208.50 and potentially 210.00. The broader structure remains bearish, so this is a countertrend long setup.
A sustained move below 202.50 invalidates the bullish outlook. Watch for confirmation near entry and avoid ch
post-image
NVDA-0.35%
  • 6
  • 1
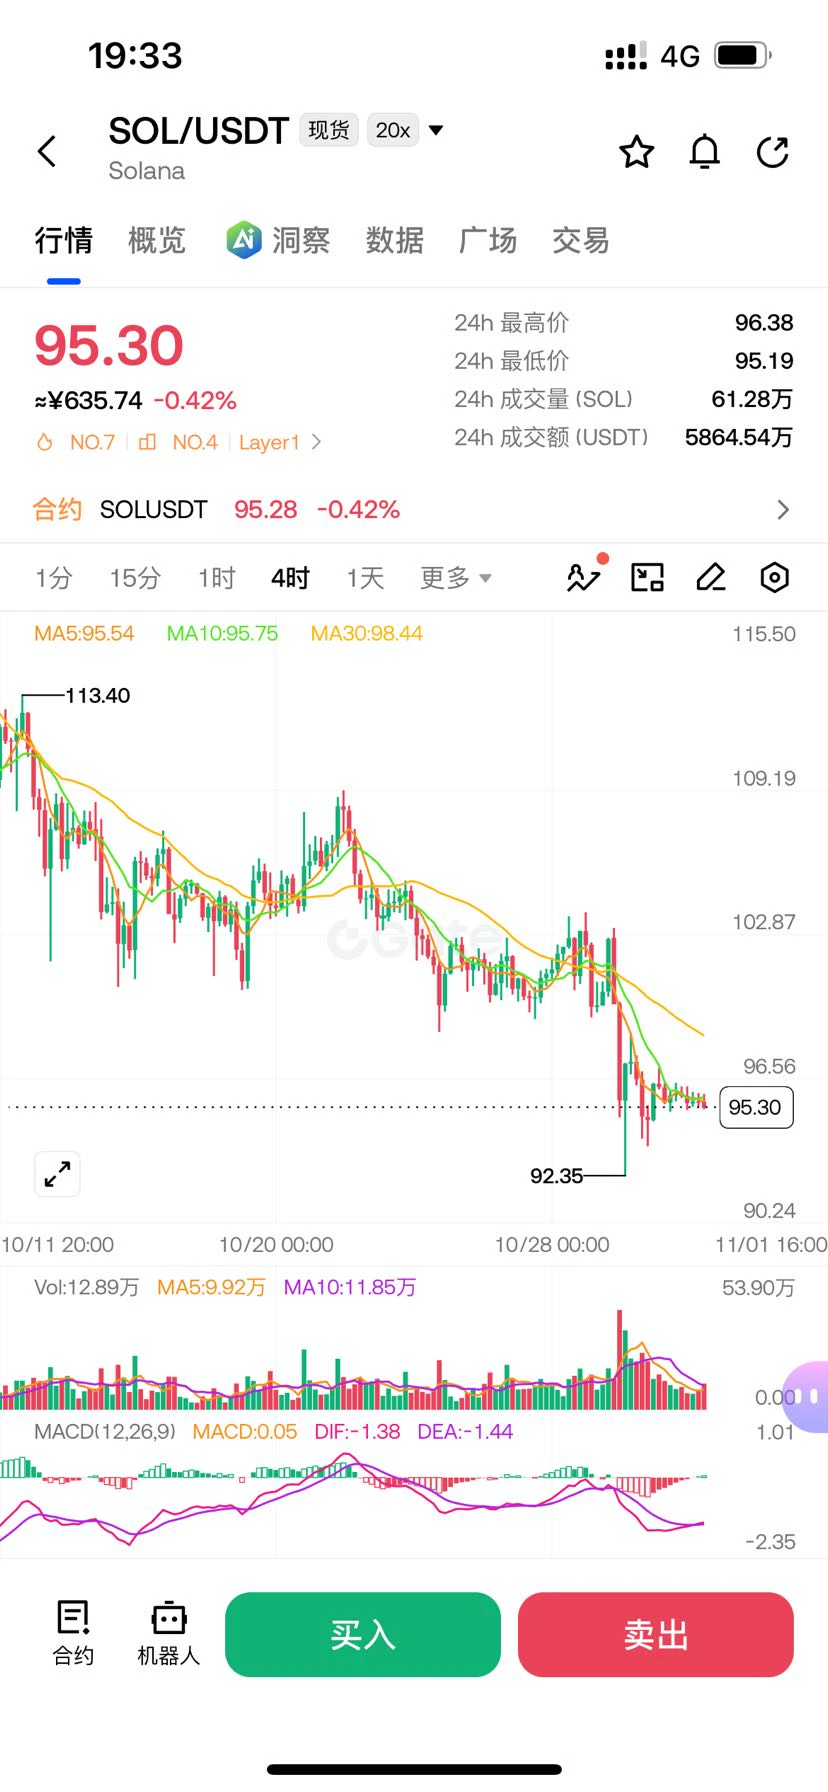
At noon, I said this address had openly put over $4.6 million into a short, with $21 million in unrealized profit. That’s not a retail trader’s doing. Now, three hours later, I’m watching this short position, and the more I look, the more I think there’s a reason they’re willing to add to it.
To be able to add like this, they must have a card up their sleeve that we don’t. What’s the state of the money on Solana right now? Another 250 million USDC was minted on-chain today. That sounds like fresh liquidity, but SOL’s price hasn’t moved up at all—it’s barely budged in 24 hours and is still down
post-image
SOL-0.77%
#BTC大跌 #ShareWeekly #WCTC9
Bitcoin Faces a Sharp Decline: Is This a Temporary Correction or a Bigger Market Warning?
Bitcoin remains the center of attention in the cryptocurrency market, but its latest sharp decline has created uncertainty among investors and traders. When BTC experiences a sudden drop, the impact is not limited to Bitcoin alone. Ethereum, altcoins, trading volume, market sentiment, and investor confidence can also be affected.
The crypto market is known for its volatility, and sudden price movements are part of this environment. However, every major decline deserves carefu
BTC-0.67%
ETH-1.26%
SOL-0.77%
NDAQ+0.65%
U.S. spot Ethereum ETFs have seen net outflows for 5 consecutive trading days, with a single-day net outflow of $156 million, primarily from BlackRock ETHA and Grayscale ETH; total ETF net assets are approximately $13.22B, with cumulative historical net inflows of $12.29B. The sustained outflows are weakening institutional buying support and weighing on the ETH spot price and sentiment across the Ethereum ecosystem, making them the most direct source of current funding pressure.
ETH-4.39%
BLK-2.41%
market ubdate
live-cover
LIVE2,018
From now on, I'll randomly give small gifts to my fans, and if you haven't followed me yet, feel free to follow me
post-image
The 1K afternoon tea budget got slammed.
Guys, latest market update: a massive dump is coming. Short at 2270 right here—follow along and make some money. Hitting the bar with Sicong tonight.
post-image
Great, $APR $APR has rebounded by more than 10%, but the rally was fake, so I'll short again in anticipation of the next wave of selling. Let's see how it plays out next. 😍😍😍$POWR $ESPORTS 😍😍😍
post-image
APR-10.63%
POWR-0.76%
ESPORTS-5.30%
  • 1
$Bull Is Coming surged 29% in 24 hours, now at 0.0697. I looked back at the data from the past three halving cycles: altseason started in the 7th month after the 2016 halving, and altcoins followed BTC’s rally in the 8th month after the 2020 halving. From the 2024 halving to now, the timing lines up perfectly with the same rhythm. History doesn’t simply repeat, but it rhymes.
The data: 24h low of 0.0535 and high of 0.0722, a 35% range, with 63.9M in trading volume—compared with the launch days of altcoins early in the previous two bull markets, this is typical volume for major players testing
牛来-1.82%
  • 8
  • 2
🔎 What evidence should ordinary users verify to determine whether a Web3 project is transparent?
In our past few posts, we have repeatedly discussed private keys, contract permissions, transaction restrictions, open-source code, and security audits.
But the community still has a question worth discussing in depth:
If a project claims to value transparency, what exactly should users look at to determine whether that transparency has practical value?
This is not a question unique to ONEA; it is one that the entire Web3 industry needs to face.
In an industry where technical information is comple
post-image
  • 2
“Endure, and the boat will make it through the dangerous shoals”
In this market, a sharp drop isn’t scary; what’s scary is losing your composure after the fall.
When panic sets in, you fail to hold the levels you should; when greed takes over, you don’t trim the positions you should; when you hesitate, a small loss turns into a deep one.
#BTC大跌
This chart depicts not just candlesticks, but the situation many people are in right now:
Grinding back and forth near the lows, every rebound feels like hope, and every pullback feels like another verdict.
But getting unstuck often doesn’t come from t
post-image
BTC-0.65%
ETH-1.23%
Having dinner with my boyfriend every week has become a form of torture.
Uber's money now works on weekends, too. And without taxis.
Uber, together with HSBC, Franklin Templeton, Tradeweb, and Fireblocks, tested settlements via the Canton blockchain.
The setup is interesting: the company bought tokenized shares in a Franklin Templeton money market fund using tokenized bank deposits from HSBC. Some assets were even redeemed over the weekend, when traditional financial markets are closed.
An important caveat: this is still a pilot, not a mass rollout of the service.
But the idea is serious: large businesses no longer have to choose between earning returns on idle cas
post-image
RWA-0.39%
#BTC大跌 #ETH回落 Strategy sharing, for reference only. Trade at your own risk.
BTC futures strategy (latest reference price around 78000)
BTC long at 76668 (stop-loss 76000)
ETH futures strategy (latest reference price around 2270)
ETH long at 2218 (stop-loss 2170)
⚠️⚠️
Use these levels flexibly. Avoid oversized positions and do not hold losing positions.
post-image
NorthWarm
#BTC大跌 #ETH回落 Strategy sharing, for reference only. Trade at your own risk.
BTC futures strategy (latest reference price around 78000)
BTC long at 76668 (stop-loss 76000)
ETH futures strategy (latest reference price around 2270)
ETH long at 2218 (stop-loss 2170)
⚠️⚠️
Use the price levels flexibly. Don’t take oversized positions or hold losing trades.

BTC-0.65%
ETH-1.23%
  • 1
$AIN The weekly candle closes tonight. It’s up more than 10x this week, with a market cap of $230 million. The market maker hasn’t aggressively pumped it yet, and not many shorts have been liquidated. I think it needs to make a sharp move up at least once within the next day or two before it’s time to short; for now, it’s a good time to go long
post-image
AIN+3.85%
Load More

Join 40 M users in our growing community

⚡️ Join 40 M users in the crypto craze discussion

💬 Engage with your favorite top creators

👍 See what interests you

Trending Topics

BTC大跌

451.59k Views39.8k Discussing

$BTC briefly fell below $77,000 and remains under pressure around the $77K zone, with its 24-hour decline still above 4%. With risk appetite weakening and Fed uncertainty rising, where is the next key support after losing $80K?

IntelBeatsEarningsButStockPlunges

39.64k Views1.02k Discussing

StrategySTRCNears100ParValue

47.8k Views4.19k Discussing

View More