



Share your thoughts
placeholder
Article
FET SCALP TRADE
TARGET 1✅
TARGET 2✅
TARGET 3✅
TARGET 4✅
FET LONG ALL TARGETS DONE🚀
🎯 Send your profit card Now.💰
Crypto_Buzz_with_Alex
FET USDT LONG TRADE SETUP
FET is currently showing an interesting structure after price moved into a tight consolidation area. The chart is forming a compression between the descending resistance and rising support, and the breakout zone is now very close.
My planned entry is around 0.1620 with 7x leverage.
Entry
0.1620
Stop Loss
0.1531
Targets
Target 1 0.166
Target 2 0.173
Target 3 0.177
Final Target 0.184
The most important thing in this setup is not just entering the trade. We also have to follow proper market rules and risk management.
Our first focus will be the 1:1 risk reward level. Once the first target is achieved and the market gives confirmation, the next focus will be 1:2. After securing profit, we can manage the remaining position for the higher targets instead of taking unnecessary risk.
FET is sitting near an important decision area, so patience is required. A successful breakout and holding above the entry zone could open the way toward 0.173 and 0.177, while 0.184 remains the final target for this setup.
Always manage your position according to market conditions. Take partial profits when targets are reached and protect your capital because following risk management is just as important as finding the right entry.
I will be watching how FET reacts around the entry zone. Let us see if this setup can follow the plan from 1:1 to 1:2 and then continue toward the higher targets.
$FET #GateEventContractTradeSharingChallenge
repost-content-media
FET+8.06%
  • 2
Everyone watching SYMBOL long is about to get blindsided.

$SUI /USDT - SHORT

Trade Plan:
Entry: 0.8154 – 0.8224
SL: 0.8527
TP1: 0.7936
TP2: 0.7767
TP3: 0.7513

Why this setup?
Why now? The 1h price sits at 0.8189 inside the entry zone, the 15m RSI reads 47.69 showing neutral momentum, and the 1h ATR of 0.014079 confirms the current volatility. With the daily trend stuck in a range, the short bias targets TP1 at 0.7936 and TP2 at 0.7767. The invalidation level of 0.7904 acts as the hard line in the sand that protects the trade.

Debate:
Are we cleanly hitting TP2 or is the range about to
SUI+2.74%
💰 The RWA sector has been heating up lately.
CoinMarketCap’s latest report shows that Gate RWA perpetual futures open interest reached $378.8 million, accounting for approximately 49.6% of total global CEX open interest and ranking first worldwide; trading volume from June to August also increased by approximately 5.3 times.
RWA has moved from “narrative” to “real-money trading”—what do you think? 👀
👇 Post with the hashtag #GateRWA永续合约持仓量全球第一 to share your thoughts:
Do you see RWA becoming the main narrative of the next cycle, or do you think the current heat is only temporary?
GateSquare
💰 The RWA sector has been heating up lately.
CoinMarketCap’s latest report shows that Gate RWA perpetual futures open interest reached $378.8 million, accounting for approximately 49.6% of total global CEX open interest and ranking first worldwide; trading volume from June to August also increased by approximately 5.3 times.
RWA has moved from “narrative” to “real-money trading”—what do you think? 👀
👇 Post with the hashtag #GateRWA永续合约持仓量全球第一 to share your thoughts:
Do you see RWA becoming the main narrative of the next cycle, or do you think the current heat is only temporary?
👉 Full report:
https://coinmarketcap.com/events/rwa-perpetuals-state-of-the-market-august-2026/
repost-content-media
  • 2
This long position was not opened by blindly chasing the breakout; instead, I waited for the price to pull back to the upper boundary of the previous range and confirmed the strength of the support before entering. As the market approached the upper target zone, I began taking profits in batches as planned, closing out 70% of the position for profit in stages. For the remaining 30%, I simultaneously raised the stop-loss level above the entry price, so even an intraday wick would not turn a profitable trade into a losing one. The moving averages continue to fan upward, key levels keep rising, a
post-image
ENA-4.42%
SOL-1.59%
LAB-0.64%
Range-bound BTC is quietly building a long entry nobody is watching.

$BTC /USDT - LONG

Trade Plan:
Entry: 78228.54 – 78384.48
SL: 77333.39
TP1: 79036.35
TP2: 79522.91
TP3: 80252.74

Why this setup?
Why now? The daily trend is range, but the 1h ATR at 311.9 shows momentum is compressing before a breakout. The 15m RSI sits at 29.82, signaling oversold conditions that often precede a bounce inside a range. The entry zone between 78228.54 and 78384.48 aligns with the 1h price of 78302.77, offering a precise fill near the middle of the range. TP1 at 79036.35 and TP2 at 79522.91 represent the u
BTC-1.38%
#Share My Holding Returns#
SHORT #SOPH/USDT
LEVERAGE :10- 50x
TAKE ENTRY NOW 0.010052
TAKE PROFIT TARGETS
1) TP 0.009950
2) TP 0.009850
3) TP 0.009740
stoploss
1) 0.010740
Use Only 2–3% Margin
if not today then not tomorrow.
follow me for more
#GateEventContractTradeSharingChallenge
SOPH+106.49%
  • 1
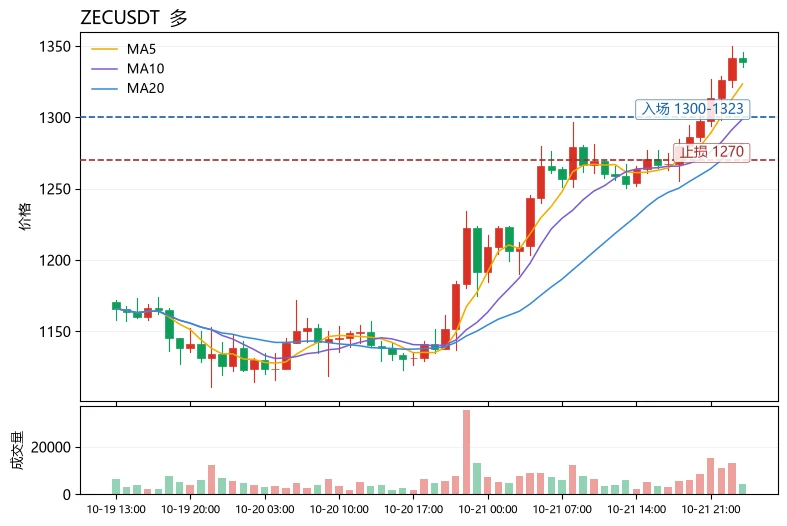
What rebound? This is CPR for my empty account, isn’t it? Before bed, the last thing I saw was $ZEC grinding around the bottom. Every dip was bought up—a typical bottoming structure that grinds without breaking support. This kind of market is the most deceptive: many people see weakness and leave, but there are always buyers quietly accumulating in the order book. I went long around 857.01 at the time. Not many got on board, and those who followed were all warriors. When I woke up this morning, it was at 1122.45, +2199.83%. That was a satisfying bite of the trade, wiping away all the frustrati
post-image
ZEC-5.27%
SOL-1.59%
BTC-1.38%
#ArthurHayesSeesHYPEOvertakingSOL
#CryptoTrading
HYPE VS SOL: IS CRYPTO WITNESSING A NEW POWER SHIFT?
$HYPE $SOL
Arthur Hayes’ latest HYPE thesis has sparked an interesting debate across the crypto market: can HYPE eventually challenge Solana’s position as one of the most important assets in the industry? At first glance, it may sound like another aggressive crypto prediction, but the underlying argument is more interesting than the headline itself because HYPE is benefiting from a combination of rising trading activity, strong market attention, derivatives positioning and growing confi
post-image
HYPE-2.77%
SOL-1.62%
After a round of decline, BTC has broken below the support at the lower boundary of the previous consolidation range. The bulls’ defense has been breached, and short-term bearish forces are now dominant.
On the four-hour chart, consecutive bearish candles have pushed prices lower, the moving averages have turned downward, and price continues to trade below them. Rebound momentum is weak, with selling pressure emerging after each modest rebound, causing the lows to keep moving lower. The weak structure is clear.
No strong bottoming or reversal signal has appeared on the higher timeframes for no
post-image
BTC-1.38%
September 8 Tuesday Afternoon Bitcoin and Ethereum Trading Guide
The U.S. stock market’s three-day closure has finally ended. The big move is coming, and today we officially get back to trading USDT!
Yesterday, we gave everyone long-term short setups for Bitcoin at 80500 and Ethereum at 2530. The market trend has been exactly as we anticipated. We have now secured 2000 points on Bitcoin and 57 points on Ethereum. I wonder how many of you followed along!
If you didn’t catch the move, don’t worry. Let’s look at today’s short-term opportunities. From the four-hour chart, Bitcoin is currently cons
BTC-1.38%
ETH-0.51%
Today's Bitcoin and Ethereum review
Bitcoin outlook: In the morning, a short position was clearly suggested around 79,500-80,000, with the first target at 79,000-78,500 and the second target at 78,200-78,000.
The market touched a high near 79,500 before falling all the way down, hitting a low around 78,320. The target zone was reached precisely, and the short was secured steadily.
Ethereum outlook: Following in sync, it retreated under pressure near the upper resistance level.
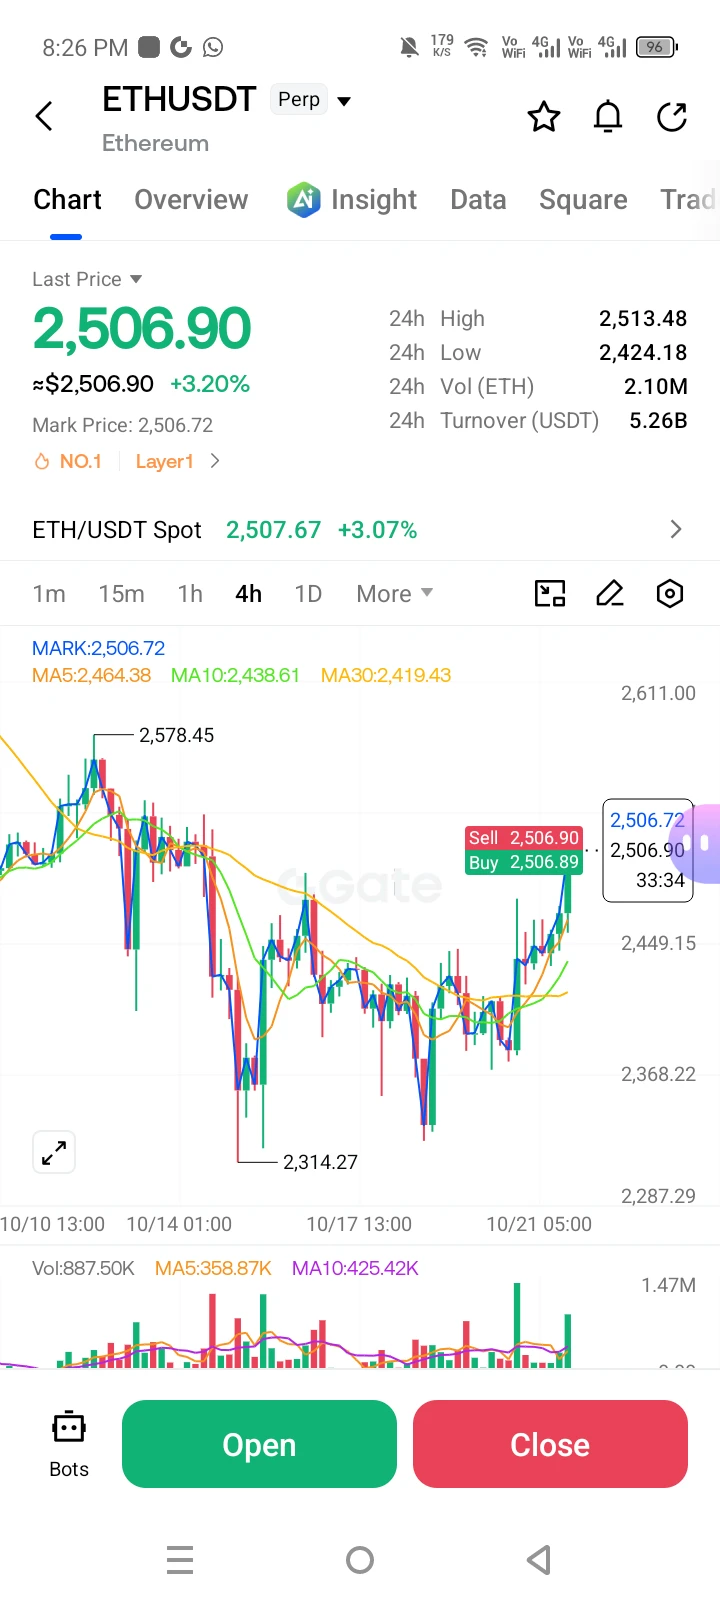
It fell from around 2,507 to around 2,461, capturing the full move as well.
Both directions were correct, and both sho
BTC-1.38%
ETH-0.47%
I didn’t chase $BTW when it surged during the day. A long-term trendline was right overhead, making it difficult to place a stop-loss after entering. I waited for it to pull back and reclaim support before entering a long position based on the lower-timeframe structure.
After entering, it consolidated for a while. I didn’t rush to trade in and out; once the price moved a certain distance away from my entry, I first closed 80% to lock in profits on the core position, leaving the remaining 20% to follow the trend.
After the breakout candle appeared, I took profit on the position’s +88.39% gain,
post-image
BTW+2.91%
ADA-0.18%
SNDK-1.47%
While I was in the restroom, my short position came back and cleared out all my frustration.

Right after the early-session sell-off, $SKYAI still tried to put on a bullish act, but pulled back before even touching the edge of the key level, with visibly declining volume. This kind of rebound is not a reversal—it is handing the bears more ammunition. I entered a short position directly at 0.06198.

It has now fallen back to 0.05871, with +130.95% already on the table. As planned, I first closed 80%, moved the protection up on the remaining 20%, and will leave the rest of the move to the stop
post-image
SKYAI+1.61%
XRP-0.81%
ETH-0.47%
The direction I point my finger is the direction of the candlestick chart.
The direction was 100% correct, and the target was hit exactly.
2507→2461, ETH short position executed precisely.
Conclusion: The direction call was completely correct, and the take-profit target was hit precisely; the entry point was slightly off, mainly because market caution before CPI resulted in a weaker-than-expected rebound. $ETH #ArthurHayes发布FLOP黄皮书100%空投
post-image
ETH-0.51%
SNDK is currently trading around 1769. After rising to 1822 yesterday, it came under pressure and pulled back, dipping as low as 1750 and entering high-level range consolidation.

From the chart, the daily bullish recovery structure remains intact, with prices holding above the Bollinger middle band. After consecutive gains, bullish momentum has weakened, creating a need for a pullback and consolidation.
The 4-hour chart shows a rise followed by a pullback, with prices moving away from the upper Bollinger band. The Bollinger Bands are narrowing, bullish momentum is easing, and the market is s
post-image
SNDK-1.47%
Bitcoin’s rebound was blocked around 79,500 in the early morning, followed by a pullback, with the current price around 78,500, also marking a 1,000-point pullback!
From the current market structure, the price has retreated to around the Bollinger middle band, with upward momentum clearly weakening as the market shifts from a strong advance to high-level consolidation and pullback.
On the 4-hour chart, the price has fallen all the way down from the upper Bollinger Band, with the bands expanding downward, the moving averages forming resistance, bearish momentum continuing to be released, and hi
post-image
BTC-1.38%
Market sentiment is largely against Base launching a token in 2026; the primary window is from the second half of 2027 through year-end, while a launch before mid-2027 is a lower-probability scenario.
post-image
$ZEC /USDT is quietly building a bullish setup most traders are ignoring right now.

$ZEC /USDT - LONG

Trade Plan:
Entry: 1124.75 – 1136.13
SL: 1075.86
TP1: 1171.37
TP2: 1198.66
TP3: 1239.59

Why this setup?
Why now? The daily trend is clearly bullish, setting the stage for a continuation move. The 1h price is sitting at 1130.44, which also defines our entry reference. The 1h ATR of 22.740267 tells us the asset is moving with enough volatility to reach our targets. With the 15m RSI at 43.2, there is room to run before hitting overbought territory. The entry zone between 1124.75 and 1136.13
ZEC-5.27%
Load More

Join 40 M users in our growing community

⚡️ Join 40 M users in the crypto craze discussion

💬 Engage with your favorite top creators

👍 See what interests you