
Square
Following
Hot
News
Profile
Share your thoughts
placeholder
Article
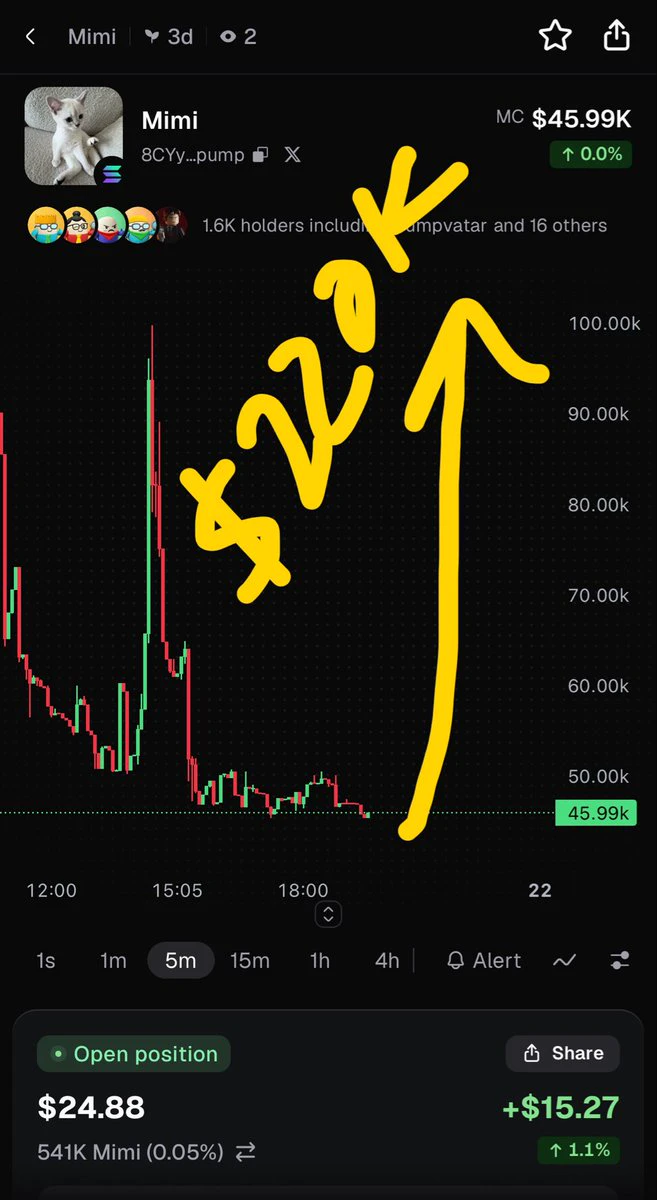
$TOLLY let’s go 5X
post-image
TOLLY+10.60%
10.16 $BNB Strategy chart 1 is the BNB 4-hour candlestick chart, and chart 2 is the BNB hourly candlestick chart.
From the larger timeframe in chart 1, we can see that BNB has touched the lower major ascending trendline today, namely the positions at 10 a.m. and 10 p.m. on October 15, corresponding to 708 and 712, respectively. Given the very obvious signs of price control in BNB recently, when BTC falls and ETH falls, BNB can always recover its price after falling.
If the broader market continues to make new lows in the near term, BNB is very likely to break below this 4-hour ascending trend
BNB+0.32%
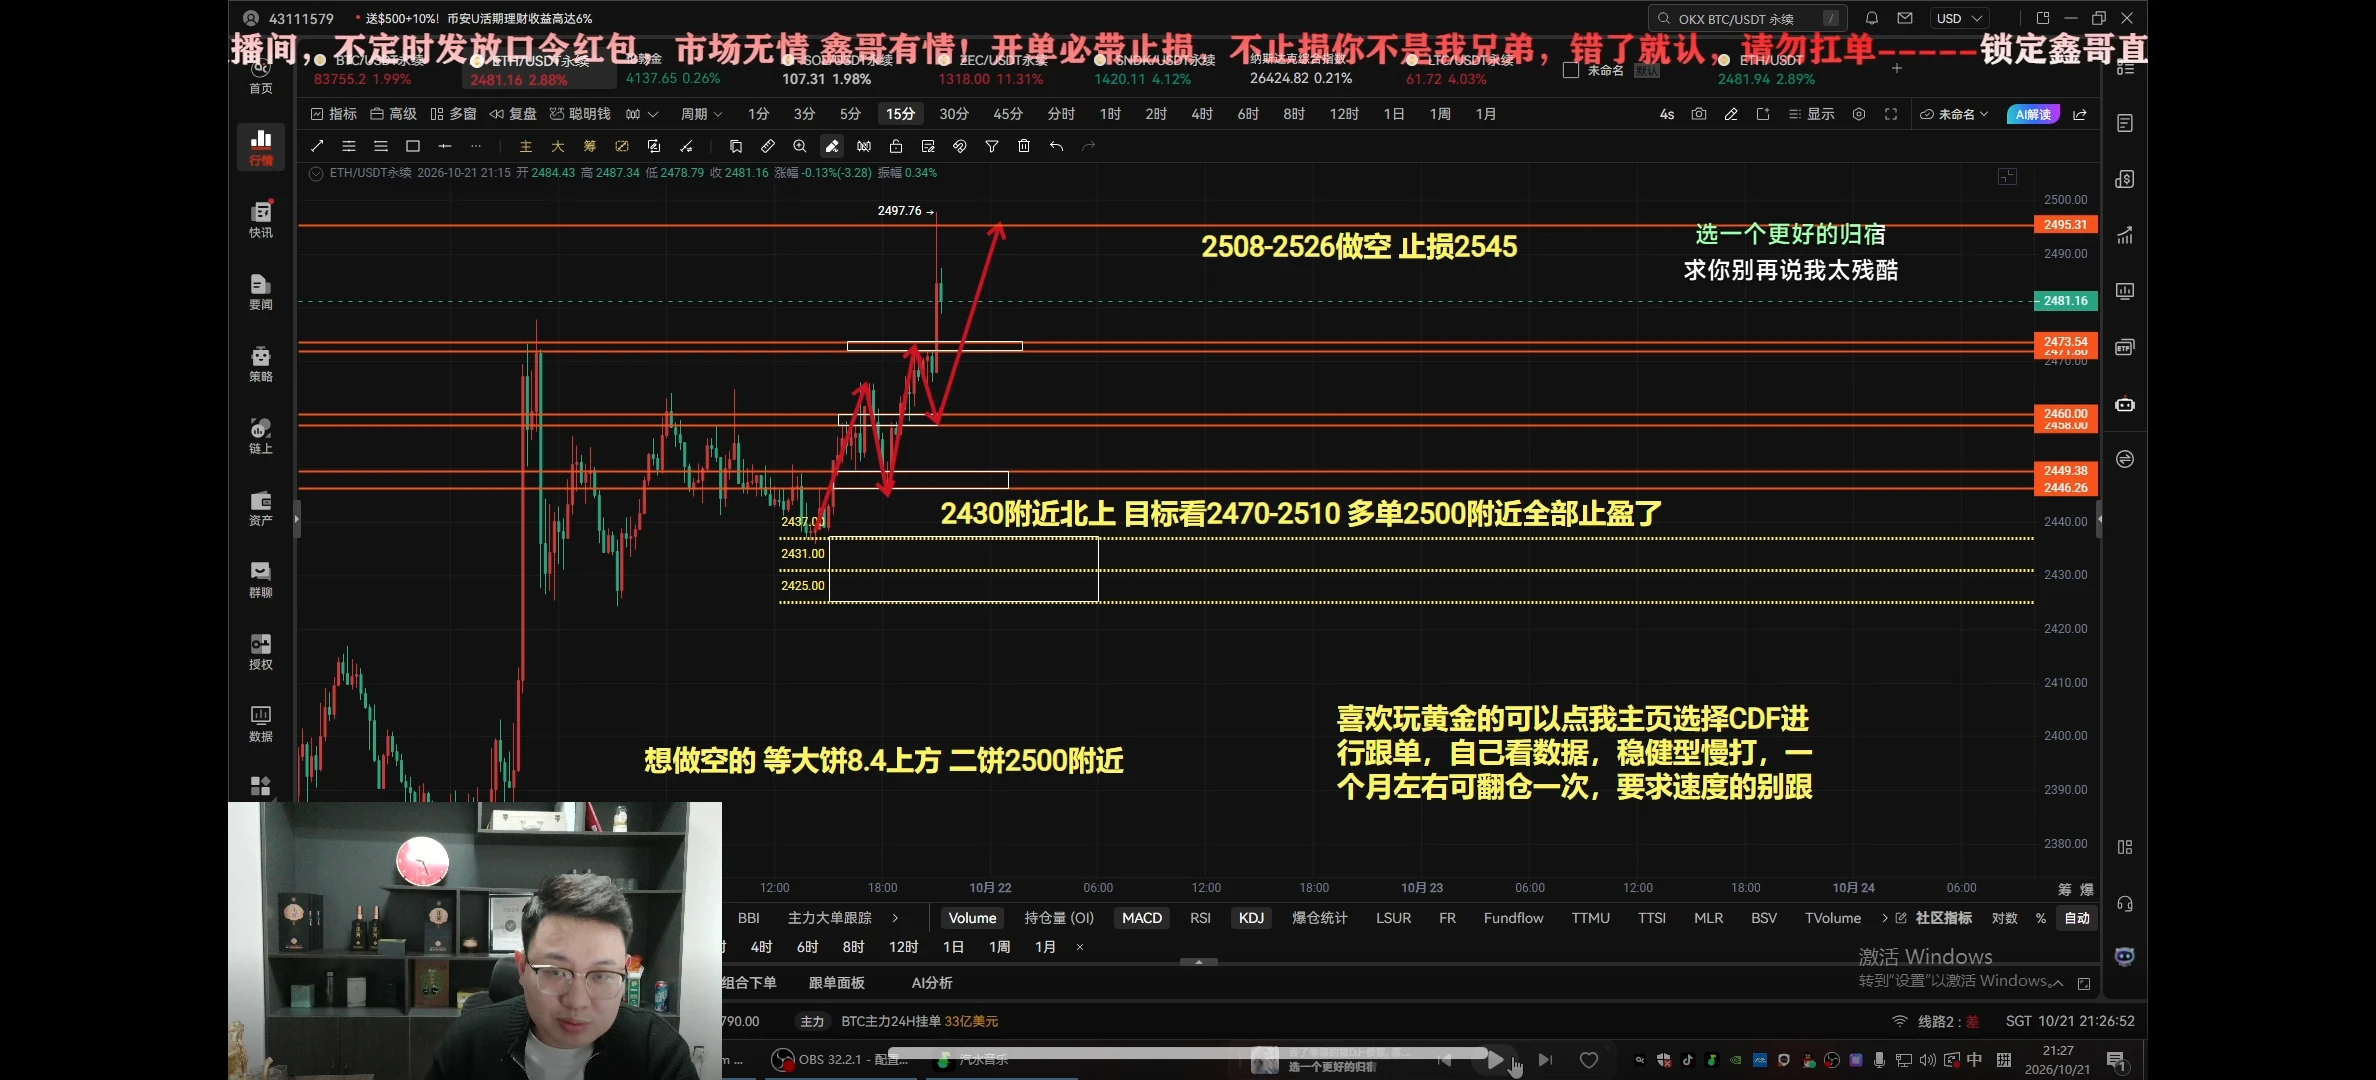
ETH is currently around 2,450, maintaining an overall weak recovery. This rebound is merely a technical bounce after the decline, not a reversal, and the bearish structure remains intact.

On the 4-hour chart, the price is pressured by the moving averages, rebound volume is insufficient, the Bollinger Bands remain in a downward trend, and overhead resistance is dense. This rise is merely a corrective move within the downtrend, with limited upside and relatively high pullback risk.

On the 1-hour chart, short-term fluctuations are showing a mild recovery, but bullish momentum is lacking. This
post-image
ETH+1.52%
solana:7cSPCV6Sadhcuk8zBa7o7mu2ny4ccmXB8XU6HcqPcSqY Privacy Inu this one is a no brainer at $4,700 mc could bounce 2-3x with minimum 40% pump
7cSPCV6Sadhcuk8zBa7o7mu2ny4ccmXB8XU6HcqPcSqY
#crypto
post-image
SOL+1.42%
$ICNT Up 21% in half a day, it surged straight from 0.1015 to 0.1371, with 13.7M in trading volume pouring in. That’s not the kind of volume retail investors can generate. I took a quick look on-chain just now: the top 10 addresses’ holding concentration hasn’t declined, indicating this move is not distribution but someone accumulating. On the macro side, here’s an anchor: during the week when the Fed minutes leaned hawkish, the 30-day correlation between altcoins and the Nasdaq surged to 0.78. Small-cap assets like ICNT have higher beta, so as long as rate-hike expectations don’t rebound, it
ICNT+23.11%
HYPERLIQUID $HYPE REJECTING MOVING AVERAGE RESISTANCE ARE BEARS TARGETING $78.06 NEXT?
Pair: $HYPE /USDT
Direction: SHORT
Entry Price: 81.62
Target Levels (Take Profit)
TP 1: 79.48 2.62%
TP 2: 78.06 4.36%
Stop Loss
SL: 84.47
Technical Breakdown
HYPE ($81.565) faced strong sell-side rejection following an impulsive upward push, printing a topping wick right at overhead structural resistance. This price action confirms persistent seller defense and sets up a clean continuation toward lower targets.
Price action tested areas above short-term moving averages before meeting heavy distribution
HYPE+0.93%
The more gold prices fall, the more aggressively China buys. From March to July, its purchases rose from 4.98 tons to 19.91 tons. This isn’t bottom-fishing; it’s welding a floor under gold prices. Ahead of the Fed decision, the market is already pricing in expectations. True liquidity providers only watch who is quietly absorbing the supply. Those holding gold should weigh this for themselves. If you have anything to add, see you in the comments.
post-image
GLDX+1.96%
PAXG+1.41%
An unpopular take: $INJ ’s current +10.99% gain is not as conclusive as it looks.
$INJ is currently at 8.423, up +10.99% over 24 hours. The 1-hour support is 7.061, resistance is 8.562, and current volume is 0.77 times the average volume of the past 20 periods. What is truly useful in these numbers is where 7.061 and 8.562 are containing the range.
This is where I currently stand: I acknowledge that the trend is strong, but what matters next is not how much higher it can surge, but whether buyers step in during the first pullback. The 1-hour trend is strong, with an RSI of 86; the 4-hour trend
post-image
INJ+10.27%
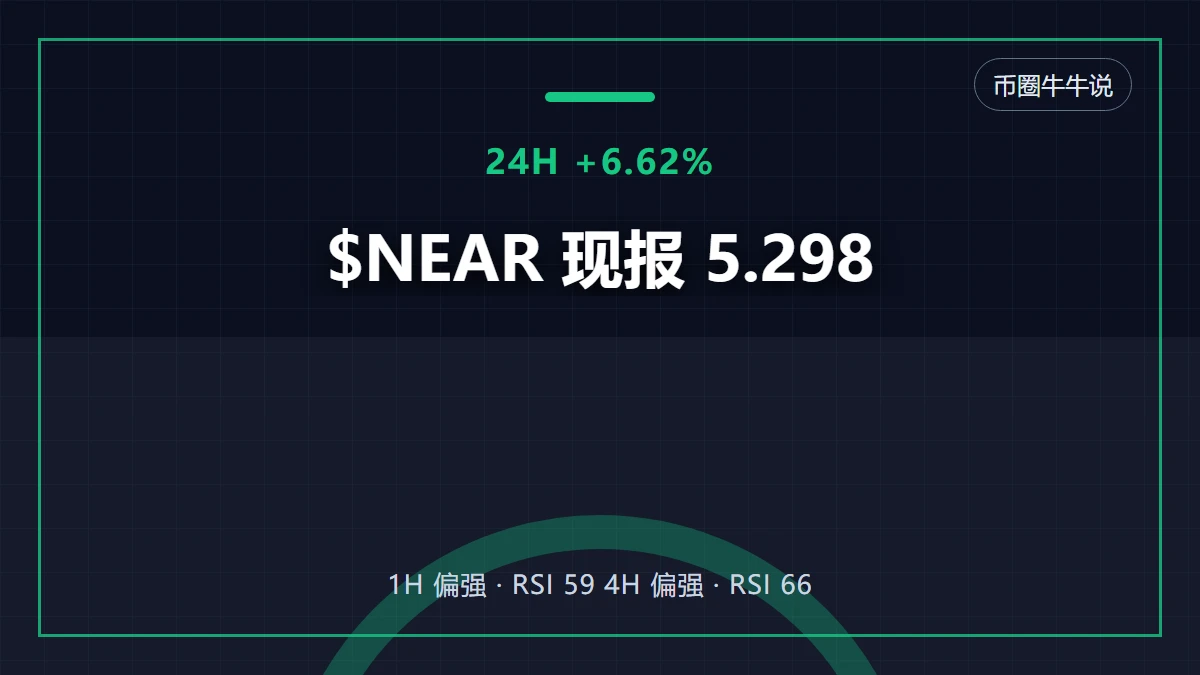
$NEAR PROTOCOL (NEAR) REJECTING MOVING AVERAGE RESISTANCE ARE BEARS TARGETING $4.5221 NEXT?
Pair: $NEAR /USDT
Direction: SHORT
Entry Price: 5.3804
Target Levels (Take Profit)
TP 1: 5.0585 5.98%
TP 2: 4.844 9.97%
TP 3: 4.5221 15.95%
Stop Loss
🛑 SL: 5.8095
Technical Breakdown
NEAR ($5.3802) faced strong rejection following an aggressive parabolic spike, printing a topping wick that stalled out right at structural resistance. This price action confirms persistent seller defense and sets up a clean continuation toward lower targets.
Price action tested areas above short-term moving ave
NEAR+10.25%
BREAKING: Centrifuge tokenizes New York Life Investment Management's actively managed U.S. high-yield corporate bond strategy as $HYB on Stellar.
Allowing the freely transferable $deHYB token to serve as collateral across lending and fixed-rate markets in DeFi.
@StellarOrg
CFG-4.93%
XLM+0.38%
$BTW BTW, this rebound is like an old lady climbing stairs, panting every three steps😅 The downtrend is visible to the naked eye; don’t get carried away shorting, and keep leverage low to stay alive. It’s darkest before dawn—don’t throw your back out on a rebound; staying cautious makes you the winner🤙
post-image
BTW-16.07%
ZEC moved lower intraday from around 1116, falling all the way to a low of 1074.66 before staging an oversold rebound, surging to 1246.91. The larger-cycle downtrend structure remains intact, so a rebound into the resistance zone presents an opportunity to short.
From the chart perspective, the long-term downtrend structure on the daily timeframe remains intact. This recovery is merely a correction during the decline, while the dense overhead trapped positions will create strong resistance.
On the 4-hour timeframe, consecutive large bullish candles have driven prices sharply higher in a short
post-image
ZEC+8.93%
Everyone watching SYMBOL long is about to get blindsided by a sharp drop.

$MU /USDT - SHORT

Trade Plan:
Entry: 927.98 – 934.84
SL: 964.38
TP1: 906.68
TP2: 890.19
TP3: 865.47

Why this setup?


Debate:
Are we testing TP2 or is 994.50 about to flip this setup?

⚠️ Personal market analysis only. NFA — manage risk and DYOR.
Educational content, not investment advice or a recommendation to buy, sell, deposit, or withdraw any asset. No paid promotion or referral/affiliate links.
MU+0.97%
BTC UPDATE
live-cover
LIVE84
$RENDER took decisive action, so the account performed better. This is a good reason to exit. Profits have been locked in. My daily watchlist: $BAT and $ETH .
post-image
RENDER+2.32%
BAT+26.74%
ETH+1.41%
🔹Whale Dumps BTC and Loads Up on ETH! After selling 237.8 BTC and buying 7,929 ETH, is big money be
live-cover
LIVE55
$HYDX looks great here. The market caused lot of quality RH plays to fall a bit but despite that holding pretty good strength overall. Many projects bouncing so I expect HyperDex too here eventually.
post-image
Social experiment but after confirming villian monkey is behind the “Neymar” token.
I recant my post. I do not endorse this token or encourage anyone to buy after new evidence.
If you still buy, it’s at your own risk. Enjoy your day. 👍🏾
post-image
10.16 Gold $XAU Recent Strategy Gold has been moving sideways within this range since falling at the end of September, with 4220 on the upside and 4110 on the downside. We have gradually sold high and bought low several times here.
Here is what we are doing now: 1. Short-term strategy: go long at 4100, exit around 4200, with a hard stop-loss at 4020. 2. After playing a few short-term rounds, switch to a long-term position (you can choose PXAG due to the high weekend fees). The unchanged point for both long-term and short-term trades is going long at 4100 with a stop-loss at 4020; the only dif
post-image
XAU+1.57%
$NEAR NEAR Breaks Out of a 4-Year Descending Channel: TP1: $11
NEARUSDT
Weekly Time Frame:
NEAR (1W, log scale) is breaking out of the descending channel that has defined price action since the 2022 top, and the weekly candle is now pushing above the upper boundary.
What the chart shows:
After the 2022 high (~20.6), price spent years in a descending channel, bottoming around the 0.9 area in early 2026.
Since that low, price has risen sharply and is now trading at ~5.4, above the channel’s upper trendline.
The breakout is happening at the 2024 volume profile POC (~5.2), so the trendline and a h
post-image
NEAR+10.25%
Load More

Join 40 M users in our growing community

⚡️ Join 40 M users in the crypto craze discussion

💬 Engage with your favorite top creators

👍 See what interests you

Trending Topics

USSeptemberPPIBeatsExpectations

91.35k Views1.88k Discussing

US September PPI came in at 6.3% YoY, well above the 5.3% market expectation, pointing to renewed producer-side inflation pressure. Weekly jobless claims were 199K, broadly in line with forecasts. Could hotter inflation further reduce room for rate cuts, and what does it mean for $BTC, US stocks, and gold?

DrLinHanSpeaksAtOxfordUnion

135.63k Views1.86k Discussing

JapanAndKoreaStocksPlunge

47.27k Views1.76k Discussing

View More