



Share your thoughts
placeholder
Article
I did nothing and just sat there; it found me an eyesore and casually pulled me out.
When I thought this move was completely over, $AKE bottomed out without breaking support, money quietly flowed in, and I signaled a long position. Entered at 0.0101698.
It ended up at 0.0151237, directly answering with +1196.27%. It was truly sluggish at first, but the result feels great.
Take 80% profit first and protect the remaining 20% at the entry price. If it keeps pushing, let the profits run—don’t get greedy for the last bit.
The prerequisite for compounding is staying alive; the shortcut to getting r
post-image
AKE-7.68%
ADA-1.55%
SNDK-3.57%
$TEM
It closed the week at $59, below BoS
post-image
TEM+0.39%
ETH long above 2470, take profit at 2510; short at 2495, profiting on both the long and short sides.
ETH-1.60%
Most traders are about to get blindsided by SYMBOL right now.

$FIL /USDT - SHORT

Trade Plan:
Entry: 0.9810 – 0.9938
SL: 1.0676
TP1: 0.9272
TP2: 0.8871
TP3: 0.8269

Why this setup?
Why now? The daily trend is range, so the market is coiling for a directional move and the 1h ATR of 0.025719 shows enough recent volatility to fuel a sharp breakdown. The 15m RSI at 61.67 still has room to roll lower before overbought exhaustion, and the 1h price sitting at 0.9874 places us exactly inside the entry zone between 0.9810 and 0.9938. With a SHORT bias at 77% confidence, the first target is TP1 at 0
FIL+19.14%
Crypto Loop / 256D Candle Closing
live-cover
LIVE84
$SNDK /USDT is range-bound by day but a short setup is forming right now.

$SNDK /USDT - SHORT

Trade Plan:
Entry: 1578.77 – 1584.71
SL: 1610.23
TP1: 1560.37
TP2: 1546.13
TP3: 1524.76

Why this setup?
Why now? The daily trend is range, which means exhaustion is likely after the recent push. The 1h ATR sits at 11.87, showing enough volatility to justify a short with a defined stop. The 15m RSI reads 58.03, indicating the asset is not yet overbought on the micro timeframe, allowing a patient entry. The entry zone between 1578.77 and 1584.71 lines up with the 1h price of 1581.74, offering a pr
SNDK-3.57%
Insiders are calling $AKE /USDT a quiet breakout setup with room to run.

$AKE /USDT - LONG

Trade Plan:
Entry: 0.014917 – 0.015215
SL: 0.013633
TP1: 0.016141
TP2: 0.016857
TP3: 0.017932

Why this setup?
Why now? The daily trend is bullish, and the 1h price is sitting at 0.015066, right inside the entry zone between 0.014917 and 0.015215. The 1h ATR of 0.000597 shows enough volatility to push toward the first target at 0.016141 and then the second target at 0.016857. The 15m RSI at 50.77 confirms neutral-to-bullish momentum without being overbought, which favors a clean move higher. If pric
AKE-7.68%
I switched to the background to reply to a message, and when I came back, it had already done the job. When I opened the chart this morning, resistance above $HOME was obvious. Nobody was taking it higher, so I told everyone to cash out their short positions. From 0.00899 short to 0.00546, +2786.12%—a huge profit. Nailed the timing.

Take 80% off the table first, and protect the remaining 20% at breakeven. Don’t let a pullback make your profits painful; if the sell-off continues, let the profits run. For those who haven’t entered yet, take my advice: now is not the time to chase. Wait for a
post-image
HOME-2.55%
DOGE-2.48%
ETH-1.65%
Blockstream is refusing to "pay a ransom" for the 598.5 $BTC still held by the attackers after the Liquid exploit. 3,400 BTC was returned after Blockstream confirmed the affected bridge nodes were patched.
But roughly $47M is still sitting with the people who exploited the bug.
And honestly, this is where the whole "white hat" label gets complicated.
If there was no agreement that allowed the attackers to keep a portion of the funds, what exactly is the $47M? A bounty? A negotiation? Or simply money they decided to keep after exploiting the system?
Blockstream's position is clear: Bitcoin can'
post-image
BTC-0.51%
$MU /USDT is quietly sitting on a 4h setup that most traders are sleeping on.

$MU /USDT - LONG

Trade Plan:
Entry: 940.20 – 942.54
SL: 926.78
TP1: 952.31
TP2: 959.61
TP3: 970.55

Why this setup?
Why now? The daily trend is range, but the 1h ATR at 4.676308 shows momentum is coiling for a break. The 15m RSI at 54.05 confirms room to run before overbought. Entry sits at 941.37, with TP1 at 952.31 and TP2 at 959.61 offering a clean ladder. The invalidation level at 977.44 is the hard line that protects the long. Every number points to a controlled move, not a guess.

Debate:
Are we cleanly r
MU-3.23%
Everyone is sleeping on $H /USDT while the 1h setup screams short.

$H /USDT - SHORT

Trade Plan:
Entry: 0.08524 – 0.08630
SL: 0.09081
TP1: 0.08199
TP2: 0.07946
TP3: 0.07568

Why this setup?
Why now? The daily trend is bearish, the 1h RSI sits at 48.94 showing room to run down, and the 1h ATR of 0.002102 confirms enough volatility to reach the target. The entry zone at 0.08577 with a spread from 0.08524 to 0.08630 gives a precise trigger, while TP1 at 0.08199 and TP2 at 0.07946 define the first two profit zones. The invalidation level at 0.08337 is the hard line in the sand that protects th
H+6.45%
🚨 VIP SIGNAL: $BTW /USDT
Pair: $BTW USDT
BUY ZONE / ENTRY:
Entry Range: 0.695000 - 0.720000
TARGETS:
TP 1: 0.753000
TP 2: 0.787000
TP 3: 0.830000
STOP LOSS:
SL: 0.648000
$BTW ‌#AugustCoreCPIBeatsExpectations
post-image
BTW+30.84%
  • 5
  • 2
I was just about to go to the forum and rant, but then I saw my balance and thought, forget it—the market is always right. 😤 When I had just finished reading the bearish news, I was still debating whether to cut the position, but the chart gave me the answer itself, so I didn’t need to worry.

The logic for shorting it isn’t complicated: insufficient support. Every rebound looks staged—there’s no one to catch it on the way up, and the volume is even lower than a few days ago. The bull-trap vibe is stronger than coffee from a few days ago. With this structure, if you don’t short it, what do y
post-image
BTC-0.55%
DOGE-2.48%
MARKET UPDATE
live-cover
LIVE57
What would you do if Bitcoin does that? 🤔
post-image
BTC+0.22%
$SPY $Q
Futures are sharply negative
post-image
SPY-0.75%
I don't remember making this chart for $eth but it's painting
post-image
ETH-1.60%
$REZ Signal】Long + buy pullback wicks/upper-band breakout
$REZ 1H pullback wick-entry window, 4H RSI 75.67, 1H RSI 66.29, price near the 4H Bollinger upper band at 0.0048.
4H MACD red bars are expanding, while 1H MACD red bars are narrowing; order book depth imbalance is -25.52%, with a buy/sell ratio of 0.59; funding rate is 0.0050%, and OI is stable. Overhead selling pressure has not been absorbed. The risk-reward ratio for catching a wick at the current price is 1.50, and the stop loss at 0.00453815 is less than 5% away, offering acceptable room for error.
🎯Direction: Long
⚡Entry/Limit or
post-image
REZ+11.29%
BTC-0.51%
ETH-1.60%
SOL-1.79%
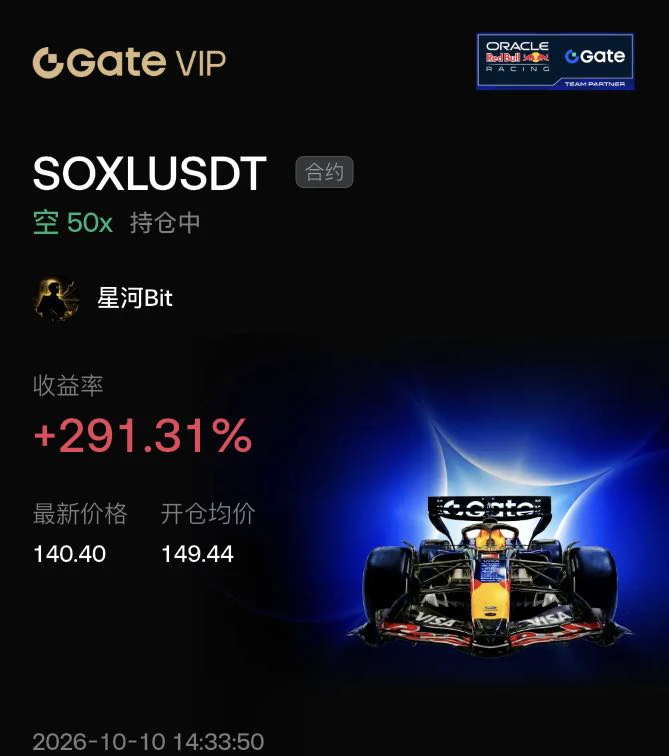
I originally wanted to cut my losses as a sacrifice to the heavens, but before the heavens could be appeased, the meat roasted itself. The last thing I saw before bed was $SKHYNIX at 1236.43. It had stayed flat at that level all day without breaking, and the bottom structure was exceptionally clean. I figured that if it still fell, there would truly be no justice, so I went long immediately, then turned off my phone and went to sleep.
This morning, when I opened the charts, the price had already reached 1296.1, +343.99%. I got the timing right, and the profits naturally followed. The late nigh
post-image
SKHYNIX-3.48%
BNB-1.27%
SOL-1.87%
Just laugh your way in; laughing in place should be enough, right!
post-image
Load More

Join 40 M users in our growing community

⚡️ Join 40 M users in the crypto craze discussion

💬 Engage with your favorite top creators

👍 See what interests you