Share crypto content and earn up to 60% commissions through content mining.
placeholder
gatefun
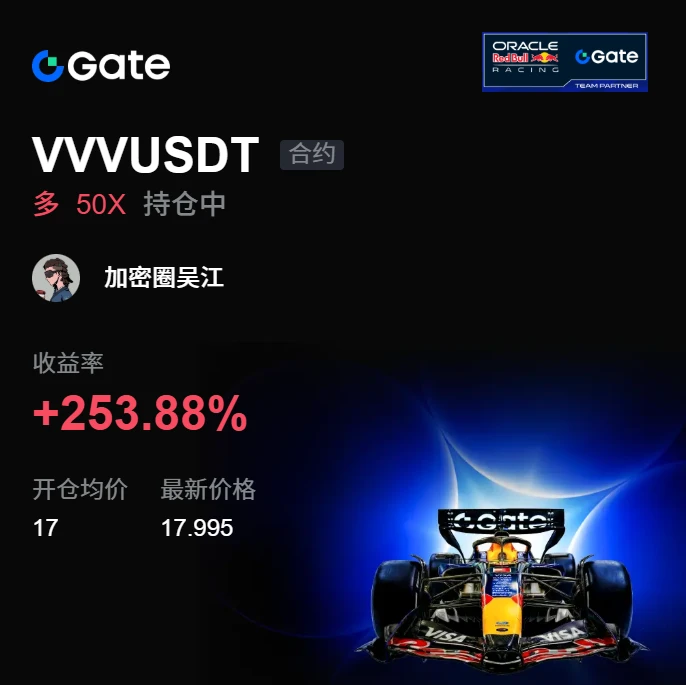
I originally wanted to cut my losses and sacrifice them to the heavens, but the ritual never happened—the meat roasted itself. When the market was dumped at the open, the rebound lacked strength and nobody was buying into the rise, so I knew the opportunity had arrived and decisively opened a short at 0.0011263. The price is now 0.001081, and +193.69% is already in the bag. I really nailed the timing on this move. Bro, watch your profits: close the position first and put +193.69% in your pocket, then move the stop on the remaining 31% to the entry price and let the profits run if the sell-off
XRP-2.52%
ETH-0.54%
View Original
post-image
  • Reward
  • Comment
  • Repost
  • Share
82.05 is not the bottom, but the starting line.

$CL /USDT - LONG

Trading plan:
Entry: 81.88 – 82.22
SL: 79.98
TP1: 83.61
TP2: 84.64
TP3: 86.20

Why pay attention to this setup?
- 4H LONG signal with 77.4 confidence; the 1D trend is sideways, but a reversal structure has emerged on the hourly timeframe.
- RSI on 15m is at 40.07, not extremely oversold, while the 1h ATR is only 0.66. After volatility contracts, a direction must be chosen.
- The current price of 82.05 is sitting right on the EMA support band. TP1 at 83.61 is the first resistance test; only after breaking through it will TP2
CL-3.54%
View Original
post-image
post-image
  • Reward
  • Comment
  • Repost
  • Share
$YOFC /USDT Perp – "Bullish Continuation – Long"**
**Trading Plan Long $YOFC
Entry: 20.45 – 20.55
SL: 20.20
TP1: 20.80
TP2: 21.50
YOFC is up +15.38% at 20.500, pushing far above the EMA30 (20.497). MACD is bullish. Buy the dip near the EMA5 (20.528). TP targets the 21.500 high. SL below 20.20.
YOFC15.46%
post-image
  • Reward
  • 4
  • Repost
  • Share
ResistanceToucher:
Friend, with the stop-loss at 20.20 less than 2% from the entry, but TP1 only at 20.8, the risk-reward ratio is just over 1:1. Unless you’re particularly bullish on an immediate surge, it’s probably not worthwhile.
View More
HoT topics prediction
gate liveLIVE
1,257
  • Reward
  • Comment
  • Repost
  • Share
8.25 Gold Late-Night Strategy
Hourly gold prices rebounded after dipping to a low of 4605, rising from the lower Bollinger Band as short-term oversold conditions triggered bullish buying. The Bollinger Bands are gradually narrowing, and late-night market volatility is likely to contract. Focus on the strength of resistance above the rebound.
Key Levels
Resistance: 4660, 4680
Support: 4645, 4610
Strategy:
Go long after a pullback stabilizes in the 4645‑4650 range, targeting 4660 and 4680.
Note: This is for reference only and does not constitute investment advice. $XAUT
XAUT-0.33%
View Original
  • Reward
  • Comment
  • Repost
  • Share
My hand trembled slightly when I set the stop-loss a few days ago; this morning I realized all that overprotectiveness had been unnecessary. During the repeated intraday swings, $ACE /ACE kept staging scary fake drops, but stood firm again after each pullback, so I went long with my eyes closed.

I checked the chart this morning and saw that staying up late hadn’t been for nothing. My entry cost was 0.1847, and it’s now 0.2346, +662.98%. This move has climbed step by step from the bottom—solid and reassuring.

80% is banked, and I’m raising the protective stop on the remaining 20%. Let the re
ACE5.13%
LAB-1.63%
XRP-2.52%
View Original
post-image
  • Reward
  • Comment
  • Repost
  • Share
[newstreamer]marketupdate
gate liveLIVE
1,170
live-coin
  • Reward
  • Comment
  • Repost
  • Share
⚡ ADA Slips Into a Key Decision Zone After Losing $0.22
Cardano (ADA) is the native asset of the Cardano blockchain, built around a proof-of-stake network for decentralized applications and transactions.
ADA is trading near $0.2152, down roughly 2.74% today.
The session initially pushed toward $0.228, but that strength failed to hold.
From there, the chart shifted into a sequence of lower recovery attempts and fresh intraday lows.
The previous close around $0.2215 was lost, turning that area into an important recovery level.
Selling continued through $0.220 and $0.218, bringing ADA toward the
ADA-3.22%
post-image
  • Reward
  • 3
  • Repost
  • Share
CouchPotatoTrader:
If 0.215 doesn’t hold, it’ll look really bad. For a rebound, it first needs to reclaim 0.221.
View More
SOL bearish signal: a windfall or a trap this time?

$SOL /USDT - SHORT

Trading plan:
Entry: 97.72 – 98.52
SL: 101.98
TP1: 95.23
TP2: 93.30
TP3: 90.40

Why pay attention to this setup?
- 4-hour SHORT alert; the 15-minute RSI has reached 42.25, indicating weak momentum but not yet oversold, so there is still room to move lower.
- The current price is 98.12, close to the 4h EMA support, but the 1D trend is range-bound. A breakout or a fakeout could happen at any moment.
- Why now? ATR is 1.6, and volatility is expanding. With short-term TP1 at 95.23, TP2 at 93.30, and a stop-loss at 101.98,
SOL1.80%
View Original
post-image
post-image
  • Reward
  • Comment
  • Repost
  • Share
Life is great, when you are sure your 6 fig. Investment on $BASECAT is gonna be 9 figs within next few weeks/days...
Be smart. Choose wisely.
You still got time to think 🐈
post-image
  • Reward
  • Comment
  • Repost
  • Share
NEAR's 95% win-rate signal this time—are you brave enough to follow?

$NEAR /USDT - LONG

Trading plan:
Entry: 1.9003 – 1.9191
SL: 1.8199
TP1: 1.9771
TP2: 2.0220
TP3: 2.0894

Why pay attention to this setup?
- A bullish signal on the 4H timeframe, with a clearly bullish 1D trend. The trends are aligned—not a countertrend attempt to call the top.
- The current price of 1.9097 is right within the entry range of 1.9003-1.9191. The 15-minute RSI at 43 is neutral to slightly weak, indicating it is not overheated yet and allowing entry without chasing the price.
- TP1 at 1.9771 is the first targe
NEAR-4.86%
View Original
post-image
post-image
  • Reward
  • Comment
  • Repost
  • Share
The best time to bid is in February.
View Original
post-image
  • Reward
  • Comment
  • Repost
  • Share
#GateStockInsightsChallenge $SNDK
📉 SNDK drops sharply opportunity or risk?
SanDisk ($SNDK) has once again reminded the market just how volatile the memory and storage sector can be. The stock closed August 24 at around $1,493.12, down 6.45%, after falling as low as approximately $1,416.56 during the session. The selloff came alongside weakness across memory-related stocks and immediately raised the biggest question for traders: is this a temporary correction, or is the market beginning to price in deeper risks?
My answer is: I see opportunity, but I would not buy the dip blindly.
The fir
SNDK0.00%
post-image
  • Reward
  • 2
  • Repost
  • Share
CaiJiu:
Go, go GT 🚀
View More
This price action is so obvious I don’t even need to think—the account is partying on its own. 💃
I spotted it right after the early-session sell-off. USELESS’s rebounds kept getting weaker, with every push upward looking like it was just checking a box, while volume completely failed to keep up. It was obvious that someone above was lining up to unload. With this kind of setup, you can’t hesitate—hesitate and you miss the meat.
I went straight short at 0.06816, and with it now at 0.06338, a +341.26% return is already on the table. I didn’t miss a bite of the meat I was supposed to take; this
USELESS-4.12%
ETH-0.54%
XRP-2.52%
View Original
post-image
  • Reward
  • Comment
  • Repost
  • Share
#GateStockInsightsChallenge $SNDK
🚨 SNDK's correction is a test — and I am watching the buyers.
SanDisk has experienced another major pullback, closing August 24 at around $1,493.12, down 6.45%, after reaching an intraday low of approximately $1,416.56. The selloff spread across the memory-chip sector, making this much more important than a single-stock correction.
But my conclusion is different from simply calling the sector bearish.
I believe the market is currently testing whether the enormous AI-memory rally can justify its valuation.
SanDisk still has impressive fundamentals. FY2026 r
SNDK-0.83%
post-image
Yusfirah
#GateStockInsightsChallenge $SNDK
🚨 SNDK's correction is a test — and I am watching the buyers.
SanDisk has experienced another major pullback, closing August 24 at around $1,493.12, down 6.45%, after reaching an intraday low of approximately $1,416.56. The selloff spread across the memory-chip sector, making this much more important than a single-stock correction.
But my conclusion is different from simply calling the sector bearish.
I believe the market is currently testing whether the enormous AI-memory rally can justify its valuation.
SanDisk still has impressive fundamentals. FY2026 revenue reached around $20.25B, up approximately 175% YoY, while data-center revenue jumped 437%.
That gives the long-term story credibility.
But the chart is currently asking for patience.
My most important level is $1,400–$1,450.
If SNDK holds this area, forms a higher low and reclaims $1,500–$1,535, I would see the correction as potentially transitioning into accumulation.
Above $1,600, my bullish conviction increases.
My targets:
$1,650 → $1,800 → $2,000
If momentum becomes extremely strong again, I would reassess higher targets rather than blindly predicting them today.
My downside plan is equally clear.
If $1,400 fails decisively, I step back.
If the broader memory sector continues falling together, I reduce risk.
If buyers return, I scale in.
This is my experience-based approach: I don't need to catch the exact bottom. I need to identify a level where the potential reward is worth the risk.
So, is the SNDK drop an opportunity?
Potentially yes.
Is it safe to buy immediately?
No.
The opportunity becomes more attractive when support holds and the price confirms a recovery.
That is the setup I am waiting for.
My current sentiment:
Short term — cautious.
Medium term — cautiously bullish.
Long term — constructive on AI-driven storage demand.
SNDK remains one of the most interesting names in the memory-storage sector, but today's market is teaching us an important lesson:
A strong company can still be a bad trade at the wrong price.
I want the right company, the right level and the right risk/reward.
For me, the roadmap is clear:
$1,400–$1,450 support → $1,535 recovery → $1,600 breakout → $1,650 → $1,800 → $2,000.
Now I am waiting to see which side wins: the sellers defending the correction, or the buyers who believe the AI-storage story is still only getting started.
#MemoryStocks #StockInsights
repost-content-media
  • Reward
  • Comment
  • Repost
  • Share
#NVIDIAEarnings
NVIDIA EARNINGS: THE BIGGEST AI TEST OF 2026
NVIDIA is once again standing at the center of the global AI and technology market. The company is scheduled to report its fiscal Q2 2027 results on August 26, 2026, after the U.S. market close, making this one of the most important earnings events for both Wall Street and the broader AI sector.
📊 1. WALL STREET EXPECTATIONS
The expectations are extremely high. Analysts are looking for roughly $92 billion in quarterly revenue, which would represent close to a doubling of revenue year over year. Adjusted EPS expectations are around
NVDA1.61%
AMD4.28%
AVGO-0.15%
post-image
post-image
post-image
  • Reward
  • 2
  • Repost
  • Share
MamonTrader:
Ape In 🚀
View More
solana:J3NKxxXZcnNiMjKw9hYb2K4LUxgwB6t1FtPtQVsv3KFr trade spitting 60% spot profits here and filling the gap here nicely!
Print eeeeeeeeeeeet
SOL1.81%
post-image
  • Reward
  • Comment
  • Repost
  • Share
$TFC /USDT Perp – "Strong Rally Continuation – Long"**
**Trading Plan Long $TFC
Entry: 38.20 – 38.30
SL: 38.00
TP1: 38.80
TP2: 39.10
TFC is up +2.03% at 38.28, holding above the EMA cluster. MACD is bullish. The 38.42 yellow line is immediate resistance. Buy the dip near the EMAs. TP targets the 39.09 high. SL below 38.00.
#GateStockInsightsChallenge
TFC1.89%
post-image
  • Reward
  • 2
  • Repost
  • Share
PaperfoldDao:
Analysts’ calls all use the same template: if it rises, they say the strong trend is continuing, then draw a couple of support and resistance lines and call it a day. If it’s really that reliable, why aren’t you going all-in? I only care whether volume confirms the move—pushing prices up on declining volume is just playing dirty.
View More
A king has no destination, only a reign.
This is the $BNB of last cycle
$1000 per $HYPE or the market is wrong.
Hyperliquid
BNB-1.13%
HYPE3.51%
post-image
  • Reward
  • Comment
  • Repost
  • Share
#GateStockInsightsChallenge +#HK50
HK50 Market Analysis — Current Price 3,270
HK50 is currently trading around 3,270, placing the market in an important short-term decision zone. The broader Hang Seng market remains sensitive to technology stocks, Chinese economic expectations, global risk sentiment and movements in U.S. markets. The underlying Hang Seng Index closed around 25,511 on August 25, while the session remained relatively stable after the previous sharp technology-led weakness.
The current structure around 3,270 suggests that buyers are attempting to stabilize price and regain momen
HK50-0.04%
post-image
post-image
post-image
  • Reward
  • Comment
  • Repost
  • Share
Load More

Join 40 M users in our growing community

⚡️ Join 40 M users in the crypto craze discussion
💬 Engage with your favorite top creators
👍 See what interests you
  • Pinned