





Square
Following
Hot
News
Notifications
Profile
Share your thoughts
placeholder
Article
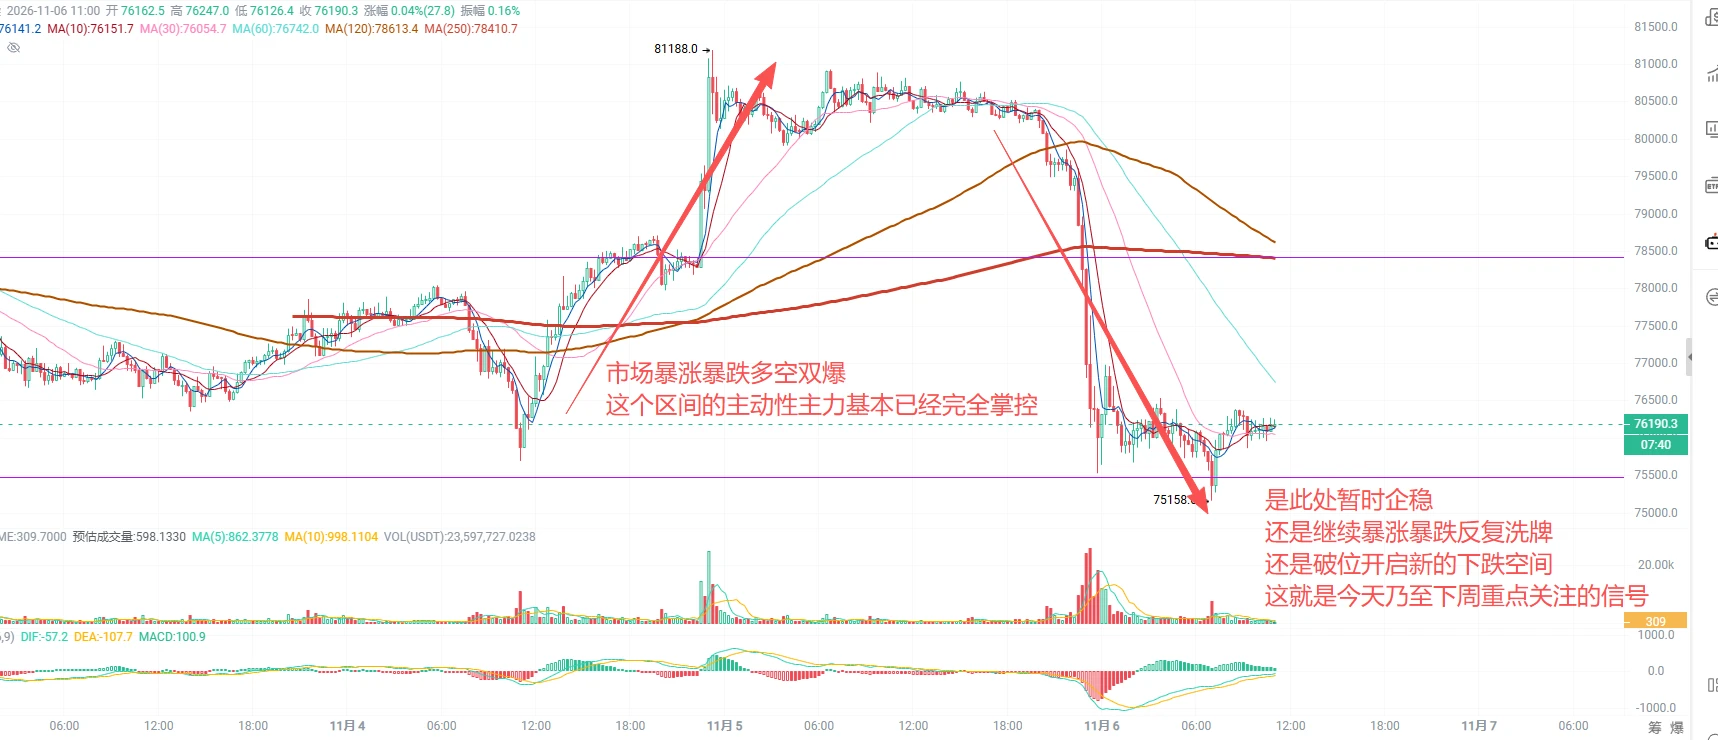
BTC bears dominate the daily chart. The price has fallen below the Bollinger middle band and is approaching the lower band. MACD has crossed down bearishly, KDJ is rapidly entering oversold territory, and the larger-scale downtrend remains unchanged. The 4-hour chart is deeply oversold, with lows continuing to probe lower and indicators entering extreme territory. A technical rebound may occur, but beware of bull traps within the descending channel.
🉑Short near 76700 on a rebound, add at 77300, with downside targets at 75400 and 73500
ETH 🉑Short near 2260, add at 2290, with downside targets
post-image
BTC-0.65%
ETH-1.23%
Bitcoin plunged nearly 6,000 points in a one-way move from a high of 81196. The market has been extremely volatile, and both longs and shorts can get trapped if they let their guard down. Some chased longs near the top and are now over a thousand points underwater; others blindly bought the dip after the crash, only to get trapped halfway down after a second leg lower. And some chased shorts all the way to the floor, only to be caught by the rebound, leaving them stuck and unsure what to do.

Here are three key ways to manage trapped positions:
First, if you're deeply underwater on a long open
post-image
BTC-0.67%
  • 1
Trenches
fxUSD
f
bade
b
fxUSD
0x08...d8f6
Market Cap
$.
Change
.
24h Vol
$.
Holders
.
ZIG
Z
bade
b
ZIG
0x8c...1145
Market Cap
$.
Change
.
24h Vol
$.
Holders
.
BTC
B
bade
b
BTC
C5xp...pump
Market Cap
$.
Change
.
24h Vol
$.
Holders
.
CORLA
C
bade
b
CORLA
0xba...7777
Market Cap
$.
Change
.
24h Vol
$.
Holders
.
STONK
S
bade
b
STONK
6GmA...UNgx
Market Cap
$.
Change
.
24h Vol
$.
Holders
.
That was the early sign. Now see and observe.

If I didn't have a time machine, I wouldn't have known either. Hahahahaj

Praise be to God, we tracked it ahead of time
post-image
CRYPTO MARKET ALERT: Bitcoin Is Under Pressure, But Is This a Breakdown or a Buying Opportunity?

The crypto market is sending a clear warning: buyers are losing control, and altcoins are feeling the pressure even more.

Here is what the latest market snapshot shows:

Bitcoin ($BTC ): $75,916 (-5.69%)

BTC is testing the lower end of its recent trading range. The $75,200–$75,000 area is an important support zone to watch. A sustained move below it could increase selling pressure, while reclaiming $77,000 would be an early sign of recovery.

Ethereum ($ETH ): $2,232 (-7.96%)

ETH is underperfor
BTC-0.67%
ETH-1.26%
BNB-0.76%
SOL-0.77%
XRP-1.15%
  • 2
11.06 SOL Market Analysis

Short: around 91.50-92.00, stop-loss at 93.20, targets 89.50/88.30.

SOL is currently at 90.24. After a sharp drop from a high of 98.12 to 88.30, the market is now moving sideways weakly near the lows. The moving averages remain in a downward alignment, and rebound momentum is extremely weak. The overall bearish trend remains unchanged.

The 91.50-92.00 area above is both a secondary consolidation platform from the previous decline and a resistance zone aligned with the 1-hour EMA10 and EMA20. Chasing shorts directly at this stage offers limited room, so the strategy
post-image
SOL-0.74%
U.S. Crypto Regulation Advances on Two Fronts
live-cover
LIVE1,547
🏆 Gate Live Chinese-Language Streamer Rising Stars Vol.04
Congratulations to the following streamers for making the list with high-quality content and huge popularity! Each featured streamer will receive a Gate keyboard 🎁 Come see if your favorite streamer made the list ⚡

⭐ @稳健盈利社区
Live trading, specializing in steady profits
https://www.gate.com/profile/%E7%A8%B3%E5%81%A5%E7%9B%88%E5%88%A9%E7%A4%BE%E5%8C%BA

⭐ @黄金队长
Live gold trading, accurately judging market trends
https://www.gate.com/profile/g1_l3xkz50l-PMvkbk

⭐ [@茜
GateLiveChinese
🏆 Gate Live Chinese-Language Streamer Rising Stars Vol.04
Congratulations to the following streamers for making the list with high-quality content and huge popularity! Each featured streamer will receive a Gate keyboard 🎁 Come see if your favorite streamer made the list ⚡

⭐ @稳健盈利社区
Live trading, specializing in steady profits
https://www.gate.com/profile/%E7%A8%B3%E5%81%A5%E7%9B%88%E5%88%A9%E7%A4%BE%E5%8C%BA

⭐ @黄金队长
Live gold trading, accurately judging market trends
https://www.gate.com/profile/g1_l3xkz50l-PMvkbk

⭐ @茜茜的西
Mainly trades BTC and ETH, occasionally trades gold to earn some extra money for meals and skewers
https://www.gate.com/profile/%E8%8C%9C%E8%8C%9C%E7%9A%84%E8%A5%BF

⭐ @潮玩宇宙稳健带单号
Focuses on trend trades combined with scalping, only taking steady trades
https://www.gate.com/profile/%E6%BD%AE%E7%8E%A9%E5%AE%87%E5%AE%99%E7%A8%B3%E5%81%A5%E5%B8%A6%E5%8D%95%E5%8F%B7

⭐@钱袋子H
Currently focused on gold, specializes in rolling positions, and believes in going all-in on compound growth
https://www.gate.com/profile/%E9%92%B1%E8%A2%8B%E5%AD%90H

Thanks to every streamer who creates quality content and keeps going live. We’ll continue to discover more great content creators and provide outstanding streamers with more exposure and support to grow.

🔔 Follow your favorite streamer so you don’t miss any exciting livestreams!
Which streamer would you like to see on next month’s list? Leave your recommendations in the comments 👇

repost-content-media
GLDX-0.40%
PAXG+0.37%
XAU+0.38%
BTC-0.67%
ETH-1.26%
11.6 ZEC Public Strategy
[Short idea] $ZEC
  Entry range: around 1320-1340
  Stop-loss: 1360
Staggered take-profit levels
  First target: 1280
  Second target: 1240
Third target: around 1210
Fourth target: below 1180

Factors: The 4H price is holding above the Bollinger Bands middle band, and the current price is close to the market's average cost. MACD is above the zero line, so bullish momentum remains. Order book depth shows bears in control, with many small retail traders exiting their long positions. This is a different structure from the major market trend.

Reco
ZEC+1.29%
BTC-0.65%
ETH-1.23%
  • 1
When BTC Shows Bearish Divergence, Does It Mean a Drop Is Coming?

In BTC technical analysis, bearish divergence is often seen as an early warning that an uptrend may be weakening. But many traders rush to short as soon as they spot bearish divergence, only to see the price keep rising instead of falling and ultimately get caught on the wrong side of the move.

So how should you interpret bearish divergence?

First, understand the basic principle. When the BTC price keeps making new highs, but the highs on the RSI or MACD indicators gradually decline, bearish divergence may be forming. This me
post-image
BTC-0.67%
#WCTCS9 2026.11.6 BTC/ETH/XAU/SNDK Analysis
The market kept right on going overnight, plunging again and wiping out $1.25 billion. 235346 people were wiped out; hopefully you weren’t among them!
In recent market conditions, it’s been impossible for bulls not to lose money, even when being extremely cautious. In my view, losses capped at 30% in this move are barely acceptable. If you’re down more than 30%, you should reconsider whether your position size is appropriate. As for those who were wiped out, there’s not much more to say: with absolutely no trading discipline, they served as pure liqu
post-image
DominanceWillMakeYou
2026.11.6 BTC/ETH/XAU/SNDK Analysis
The market took another beating overnight, wiping out $1.25 billion and liquidating 235,346 traders; hope you weren't among them!
For bulls, in this recent market, even playing it safe makes it impossible not to lose money. In my view, losses capped at 30% in this downturn are barely acceptable. If your losses exceed 30%, rethink whether your position sizing is reasonable. As for those who got liquidated, there's not much more to say—they had no trading discipline and became pure liquidity for the market!
BTC
Market sentiment is completely in control right now. 72850 is key support after the break below 75475. If support at this level cannot be confirmed, price may break below the 70000 round-number level and even test 67135;
Price is currently consolidating in the 75475-78425 range, with violent swings and aggressive shakeouts;
For last night's trade, 75500 was the final line of defense. If price breaks below it on rising volume during the day, just stop out; if volume contracts near 75700, consider lowering your cost basis below 77000 and see if there's a chance to break even tonight. The stop-loss condition remains unchanged: if price breaks below 75500, fails to reclaim it quickly, and continues falling on rising volume, stop out;
ETH
Support: 2150/2095/2010
Resistance: 2403
Watch 2215 and 2345 during the day to see whether price breaks through on rising volume or can retest 2345 to the upside tonight. Take-profit and stop-loss approach is the same as for BTC;
XAU eventually pulled back as well, under pressure from the violent selloff in US equities. The key levels below remain the 3970-4000 zone—let's see how it plays out!
SNDK: Democrats have put forward a proposal to ban the construction of computing centers. In fact, this was the reason for the sharp plunge in July this year, when SNDK fell 59% from its high. This latest downturn has also seen a 58% drop from September's high. If it falls further, it really could reach the 500-700 range. If it gets there, a sharp rebound will likely follow. For now, just watch for signs of a bottom;
Trading suggestions do not constitute investment advice: This market is undoubtedly a great opportunity for spot buying. Don't expect an immediate reversal, but spot has reached the point where you need to start building a position; especially ETH, where starting to build a position in batches is perfectly reasonable;
In this market, you can take a loss, but don't get liquidated. Play it safe, build positions slowly, and accumulate cheap tokens—that's the best strategy!
#美股史诗级抛售
repost-content-media
ETH-1.26%
XAU+0.38%
SNDK-22.24%
BTC-0.67%
  • 2
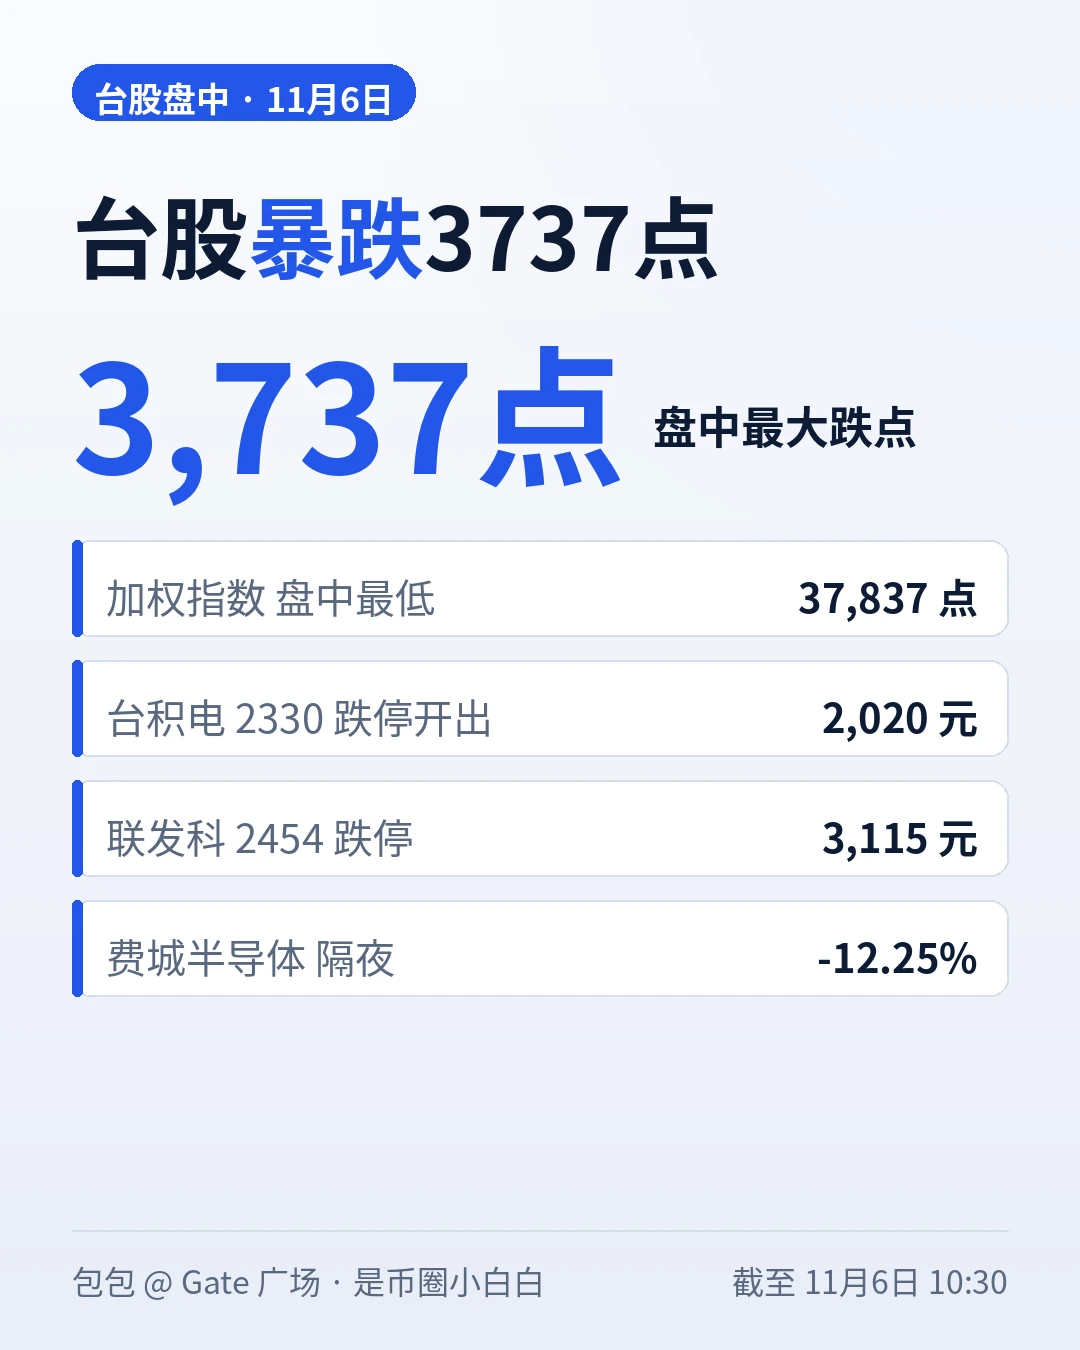
Taiwan stocks plunged 3,737 points intraday, setting a record for the biggest single-day point drop—TSMC opened limit-down, with as many as 489 stocks locked limit-down intraday. #Gate上线台股交易 #亚太股市集体重挫

Taiwan stocks put on a Black Friday show today. The weighted index opened below 40,000, at 38,915.76, and plunged as low as 37,837.05 intraday, down 3,737.67 points—a record for the biggest intraday point drop—while also falling below its annual moving average.
The catalyst was the overnight sell-off in U.S. stocks: the Philadelphia Semiconductor Index plunged 12.25%, TSMC ADR sank 10.78%, and
post-image
TSM-10.96%
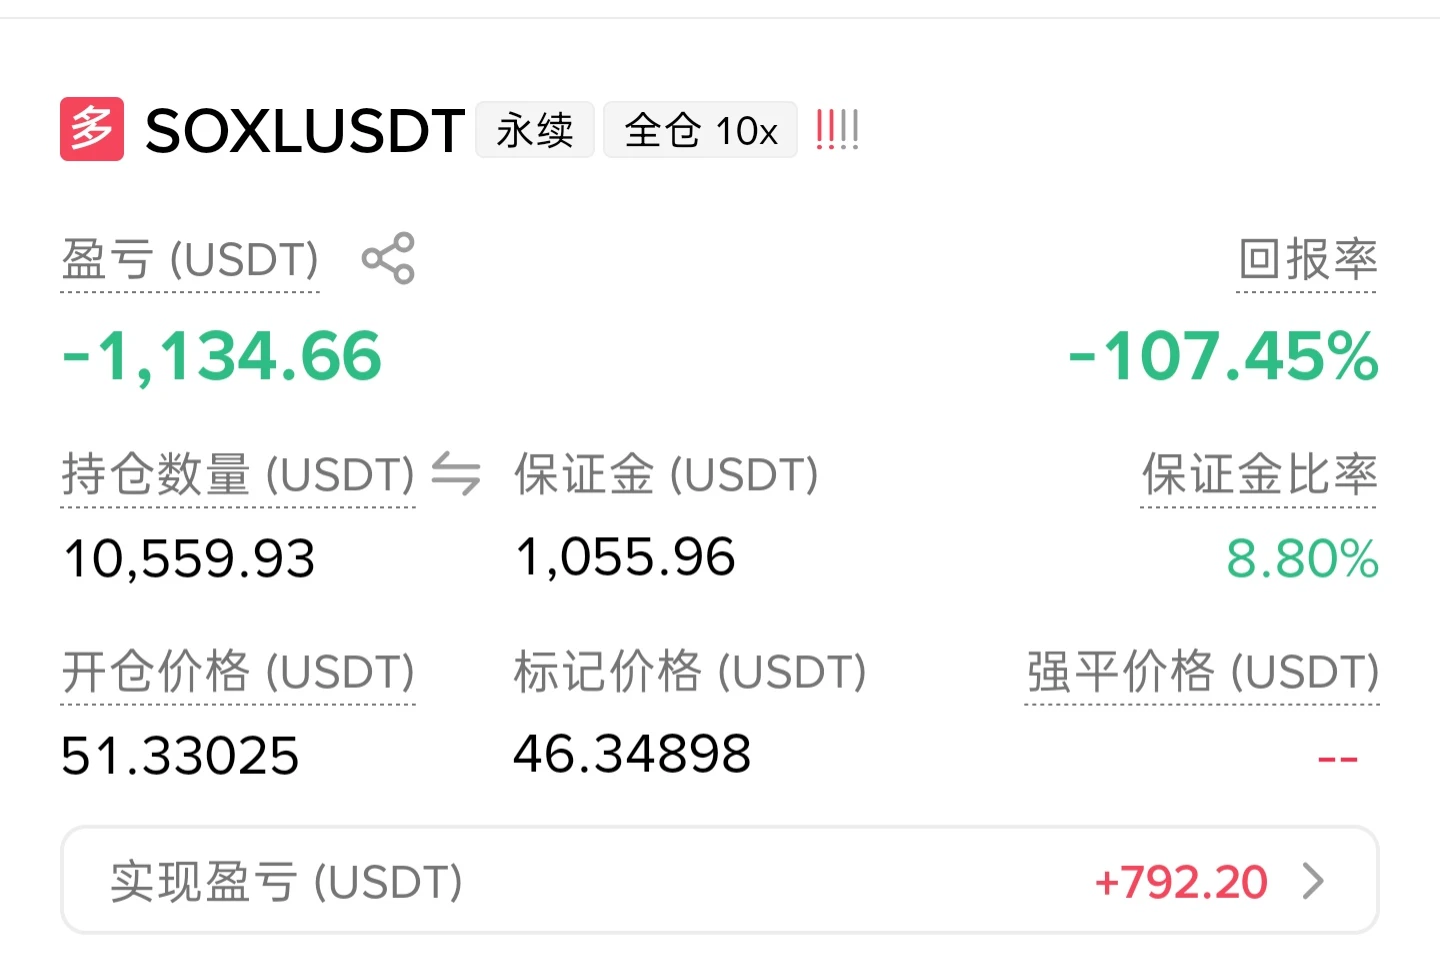
Is a financial crisis coming? We witnessed an epic crash... 🌚 The average price for this wave is 51! Can we get an epic rebound? Gurus from all walks of life, come out and buy the dip!🌚 #SOXL $SOXL ‌
post-image
SOXL-1.16%
  • 2
🚨 Samsung has added USDC to its wallet.
And the reason Pi chose OUSD now seems clearer.

Flash: Samsung Wallet is launching USDC stablecoin accounts based on Solana·Sui on about 82 million Galaxy devices in the US.
Users can buy, hold, and send USDC, and even make remittances to more than 60 countries.
Crypto is no longer “just another app,”
but is integrated into the wallets we already use 🚀
This is more than just a simple feature addition.
👉 It signals that “stablecoins are becoming everyday payment infrastructure.”
━━━━━━━━━━
💜 That makes Pi × OUSD even more significant
post-image
USDC+0.01%
PI-0.60%
SOL-0.77%
SUI-1.05%
  • 6
Today's Morning SOL Outlook

Short
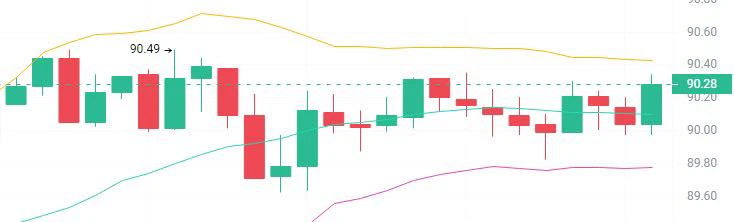
Entry range: 90.70 - 91.00 (rebound to the upper band and previous high resistance zone; enter only after momentum stalls and a bearish candle closes)
Stop-loss: above 91.50 (holding above this level would invalidate the short-term bearish outlook)
Targets: 89.80 (middle band) → 88.30 (previous low)

Long
Entry range: 89.70 - 89.90 (pullback to middle band support; consider entering only after a clear sign of a bottom)
Stop-loss: below 89.20 (a break below the lower band invalidates the long)
Targets: 90.70 (upper band) → 91.20

After a sharp drop, SOL has st
post-image
SOL-0.74%
What Do Historical Data Tell Us About BTC Price Trends After Halvings?

In the Bitcoin market, halvings have always been an important event for investors. With each halving, miners receive fewer block rewards, and the rate at which new BTC enters the market declines accordingly. Historically, BTC has experienced significant bull runs after several halvings, so many investors view halvings as an important basis for a long-term bullish outlook.

But can historical patterns really be repeated?

First, halvings change the rate of new supply. BTC halvings reduce the rate of new coin issuance, but d
post-image
BTC-0.67%
What Happens If BTC Breaks Above 82,000?
live-cover
LIVE1,032
What is a retest confirmation? Why can a retest of a key level after a breakout sometimes offer a better entry reference, yet also potentially fall back into the original range?

In cryptocurrency trading, a price breakout above resistance does not necessarily lead to an immediate, sustained rise. Sometimes the price returns to test the area around the breakout level. If the former resistance zone turns into support, this may provide a reference for trend-following trades. But a retest is no guarantee of success, and the price may fall back into its original trading range.

First, what is a re
post-image
If it’s going to drop, let it drop hard. No matter what, Bitcoin will come back stronger after being pushed to the brink! Hold strong, brothers!
BTC-0.67%
Load More

Join 40 M users in our growing community

⚡️ Join 40 M users in the crypto craze discussion

💬 Engage with your favorite top creators

👍 See what interests you

Trending Topics

USStocksFaceHistoricSelloff

987 Views3.48k Discussing

U.S. stocks suffered a sharp selloff on Thursday, with the Nasdaq closing down more than 5% and the Philadelphia Semiconductor Index falling over 12%. AI and chip stocks including $NVDA and $AMD were hit especially hard. Markets are reassessing AI valuations, data-center spending and future returns. Is this just short-term deleveraging, or the start of a deeper correction in the AI trade? Which sectors are you watching next?

GateLaunchesPoSECProofOfSecurity

12.01k Views568 Discussing

USNonfarmPayrolls

9.34k Views3.99k Discussing

View More