Square
Following
Hot
News
Notifications
Profile
Share your thoughts
placeholder
Article
Traders come and go, but Aoying Capital is rock solid!
Doubled again!
Wake up and count your money, friends~
post-image
How to Identify a Fake Breakout? Avoid Getting Caught in a Bull Trap!

In BTC trading, one of the market moves most likely to fool traders is a fake breakout. The price suddenly breaks through an important resistance level, and when many people see the candlesticks surge quickly, they think a new rally has begun and rush to go long. However, the price soon falls back into its previous range, leaving traders who bought at the top on the back foot.

So, how can you identify a fake breakout?

First, check whether trading volume confirms it. A genuine, strong breakout usually needs volume support.
post-image
BTC-0.67%
Trenches
ZIG
Z
bade
b
ZIG
0x8c...1145
Market Cap
$.
Change
.
24h Vol
$.
Holders
.

BTC
B
bade
b
BTC
C5xp...pump
Market Cap
$.
Change
.
24h Vol
$.
Holders
.
CORLA
C
bade
b
CORLA
0xba...7777
Market Cap
$.
Change
.
24h Vol
$.
Holders
.
STONK
S
bade
b
STONK
6GmA...UNgx
Market Cap
$.
Change
.
24h Vol
$.
Holders
.
DESSA
D
bade
b
DESSA
npz2...pump
Market Cap
$.
Change
.
24h Vol
$.
Holders
.
FeaturedYesterday, AI was the hottest thing around; today, it’s a hot potato! U.S. stock investors can’t sleep a wink

Love affairs in the capital markets flare up fast and fade just as quickly! Yesterday, AI was the darling of investors; today, it’s a hot potato in their portfolios.
On Thursday, U.S. stocks suffered an epic sell-off, with the Nasdaq down more than 5% and the Philadelphia Semiconductor Index down more than 12%, as AI and chip stocks tumbled across the board. Tech stars once chased by investors are now taking spectacular dives from their highs.
What exactly happened? AI hasn’t disappea
NAS100-0.07%
  • 16
CZ was pardoned by Trump, and he thought his legal troubles with the U.S. were over. But just as he turned around, he became a focus of the Democrats’ investigation.

With the Democrats gaining ground in the midterm elections, Congress is likely to subject the pardon to stricter scrutiny. The Trump family’s business dealings with the crypto industry will be impossible to avoid.

Of course, being investigated does not mean the pardon will be overturned. But once the investigation gets underway, he will still have to bear the legal and public-opinion pressure.

What’s really worth considering is
post-image
  • 5
🔎 How Can You Identify On-Chain Token Restrictions Using a Blockchain Explorer?

Yesterday, we discussed a question: Why might digital assets still be subject to certain restrictions even when you control your own private keys?

Today, we’ll take this question a step further and look at practical steps.

Suppose you find that a token cannot be transferred, or you’re researching a Web3 project and want to find out in advance whether its token contract has transfer-pause functions, address restrictions, or special permissions.

Where should you start?

Should you check the project’s website? Lo
post-image
ETH-1.26%
BNB-0.76%
NEW STREAMER(Market Update)
live-cover
LIVE1,363
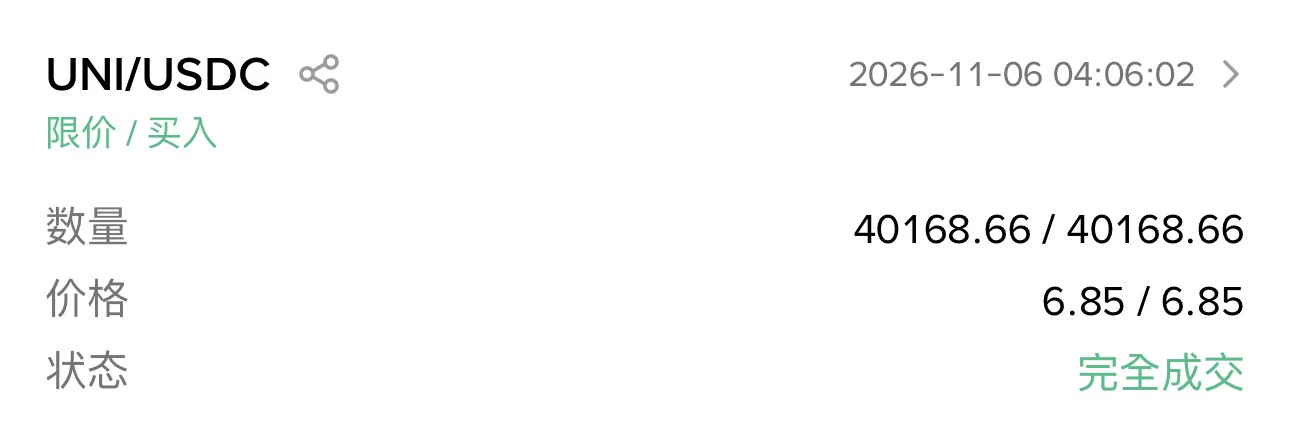
Since I started trading crypto, my sleep quality has gotten worse year after year. I woke up in the middle of the night and couldn't resist checking the market, then couldn't resist adding 40k UNI at 6.85U. The bubble in U.S. storage and AI stocks is deflating—what does that have to do with crypto? The crypto bubble was already mostly squeezed out. Bitcoin's fundamentals haven't changed at all; I still see range-bound trading between $75k and $85k. $UNI
post-image
UNI+3.05%
  • 6
  • 2
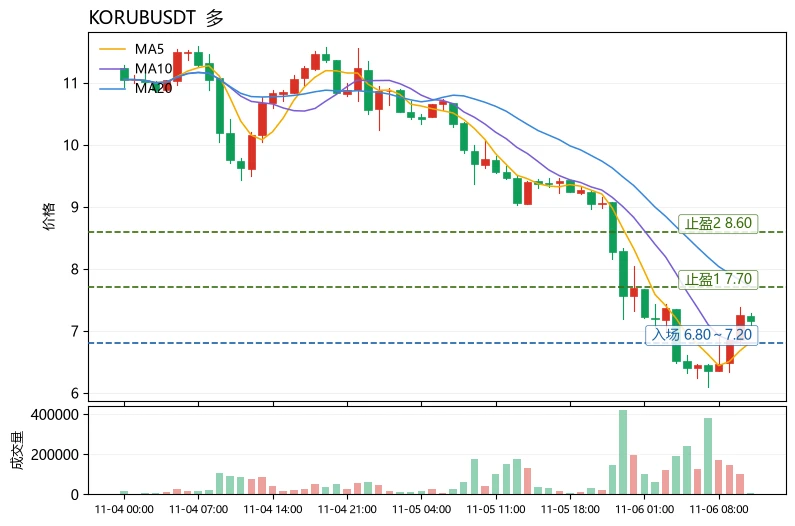
The Fear and Greed Index is only 28. Can KORUB be bought on the dip amid this broad market decline? Yes, a small long position can be tried, but only as a rebound play—not as a reversal to hold.
Market sentiment is in the “fear” zone. BTC weakness has driven a broad selloff in altcoins, with $KORUB plunging 25.42% in 24 hours, significantly more than SOL’s 6.05% and HUMA’s 15.71%, making it a typical high-beta catch-up decliner. Technically, the price at 7.16 has fallen below MA20=7.709, leaving the medium-term structure bearish; however, MA5=6.82 is starting to turn up, the MACD histogram ha
post-image
KORUB
KORUBSouth Korea Bull
Four.meme
MC:$3.67KHolders:1
0%
HUMA-1.99%
SOL-0.77%
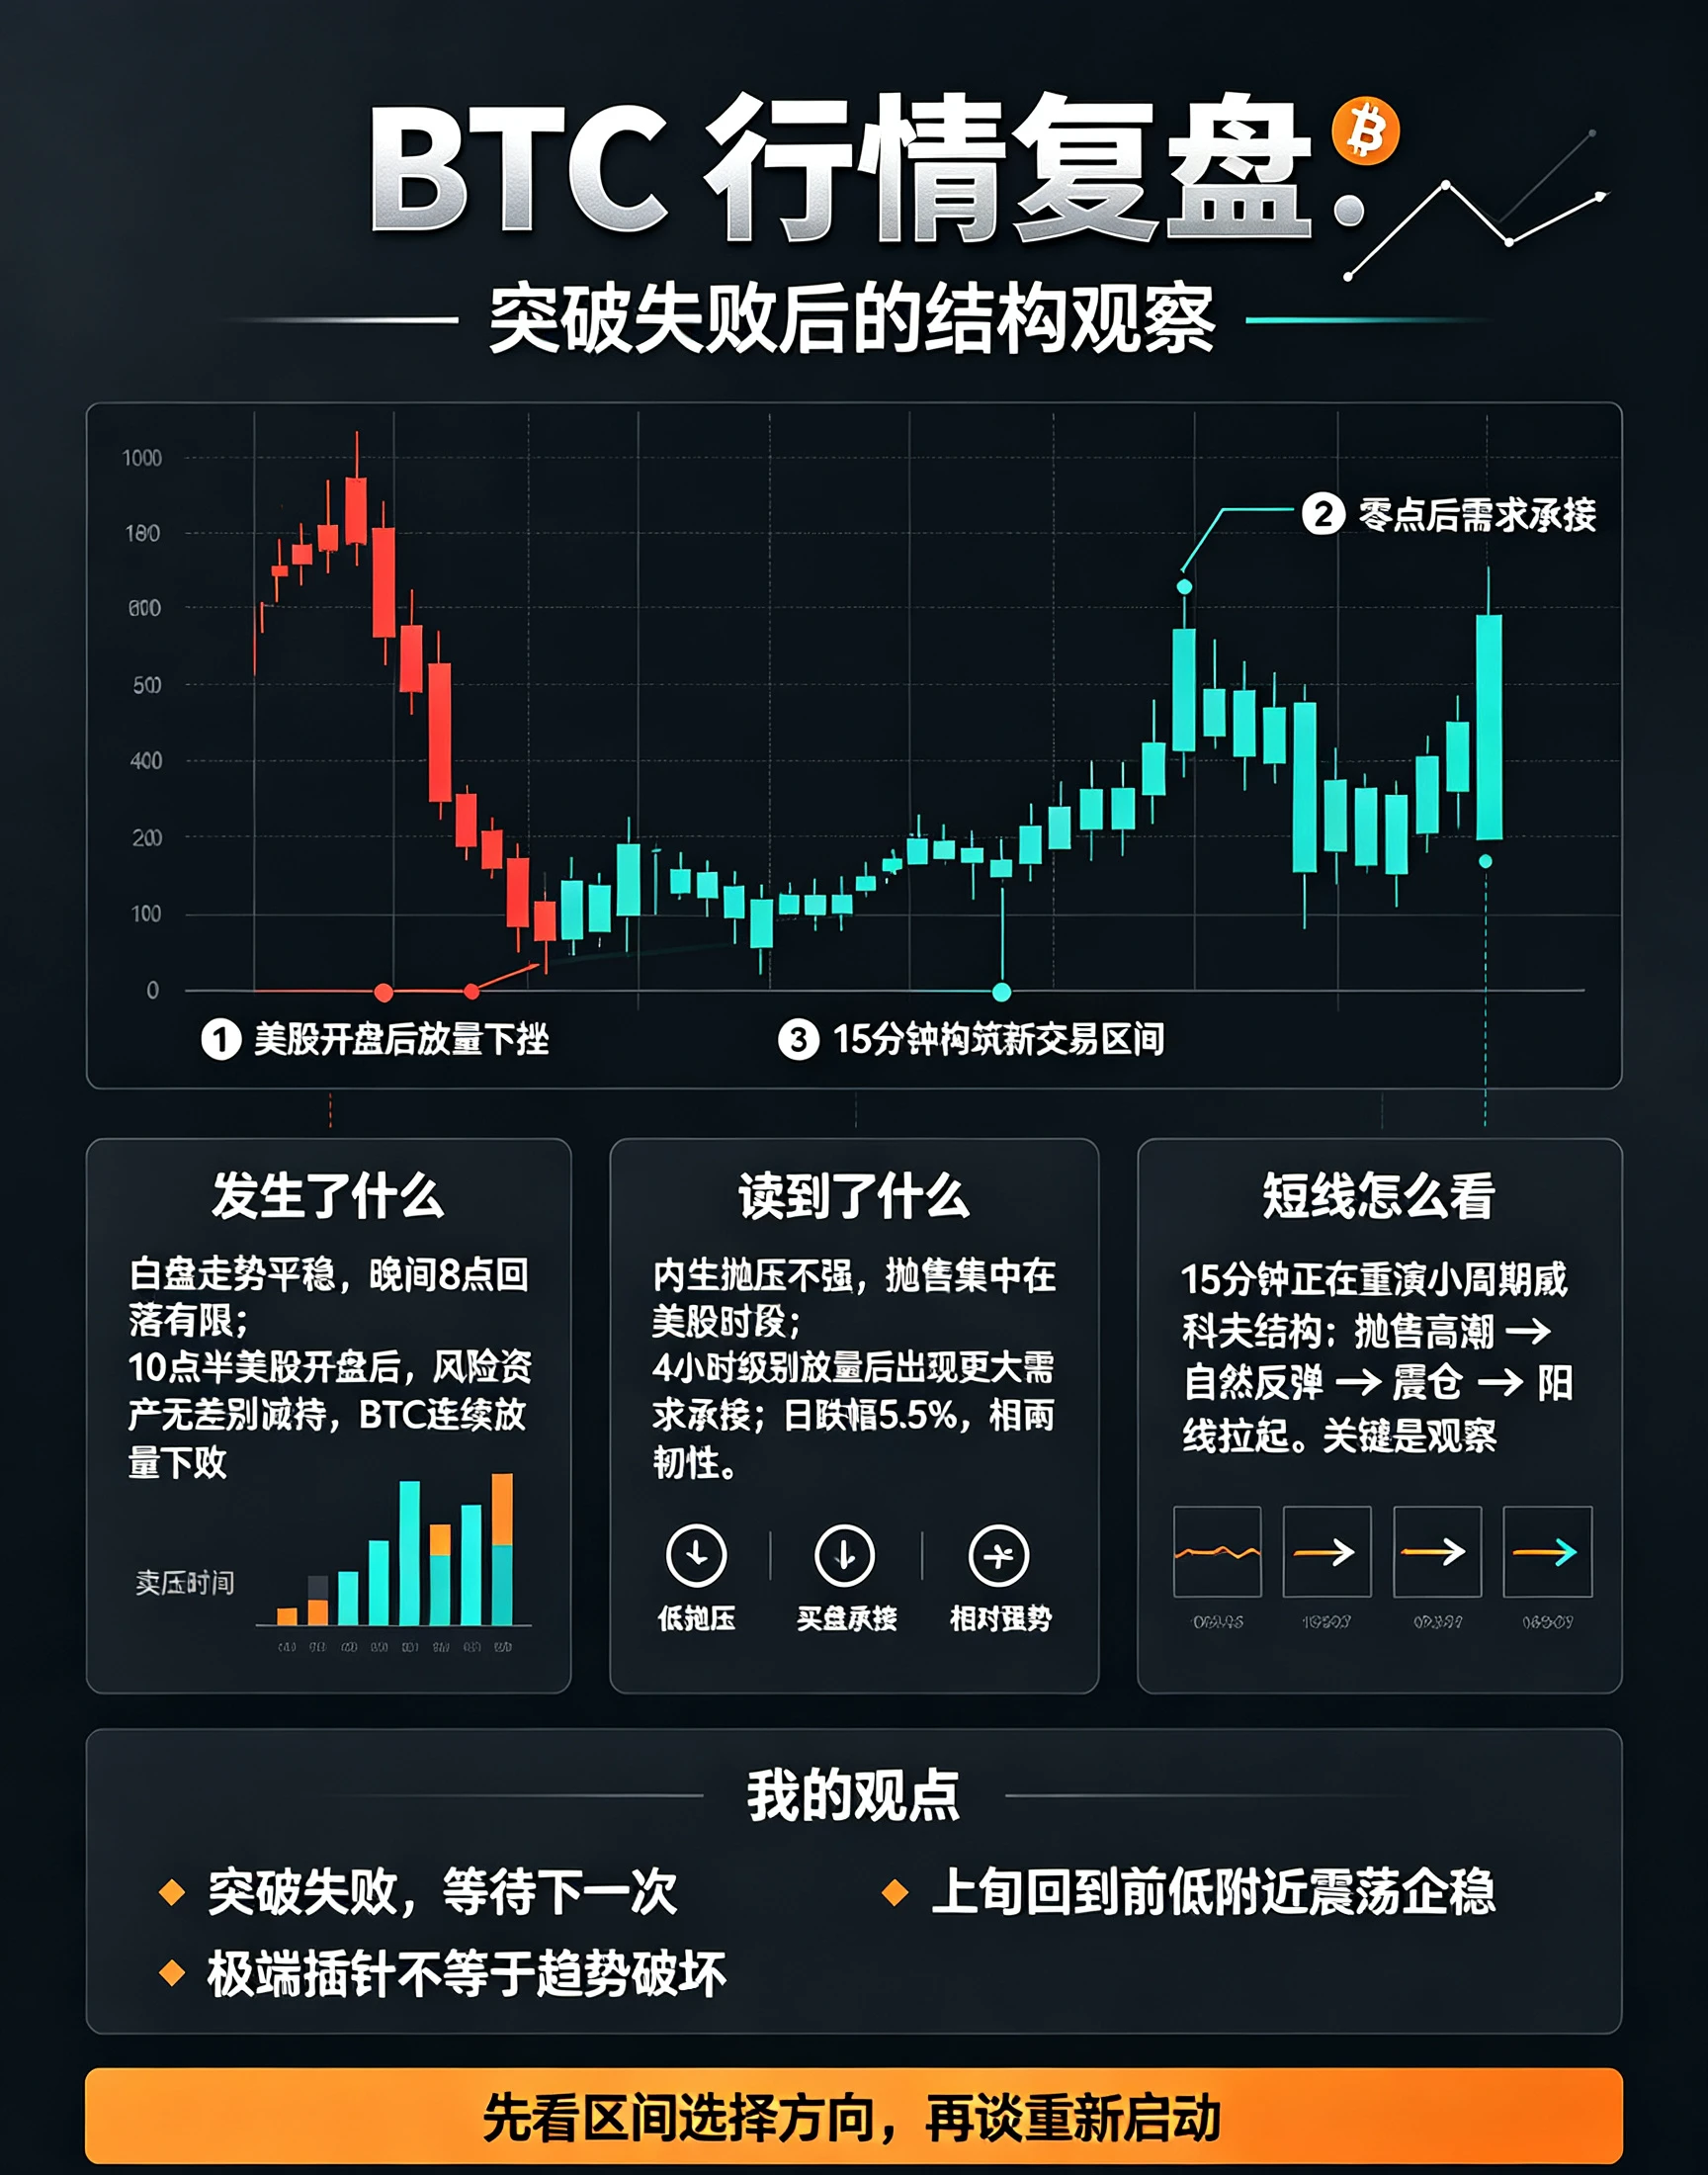
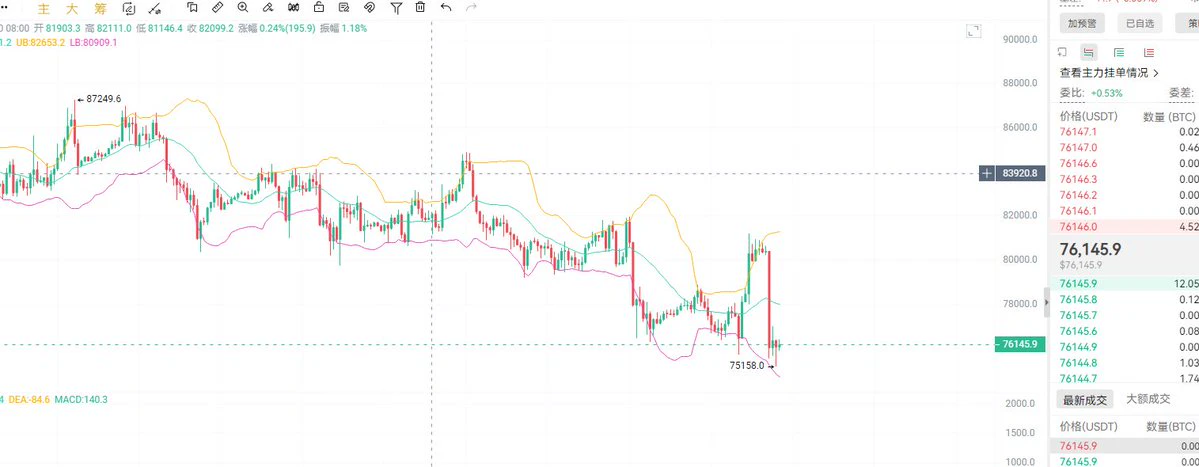
BTC traded steadily during the day yesterday, then saw a sharp pullback at 8 pm, though volume was limited. It was not until U.S. stocks opened at 10:30 pm that the market turned sharply lower, with successive high-volume declines and a concentrated wave of selling. The price fell through the two support levels previously anticipated, one after the other, signaling the failure of this breakout attempt.
The decline also sent several clear signals. First, endogenous selling pressure within crypto was not significant: the market was largely unaffected during non-U.S. trading hours, with selling c
post-image
BTC-0.65%
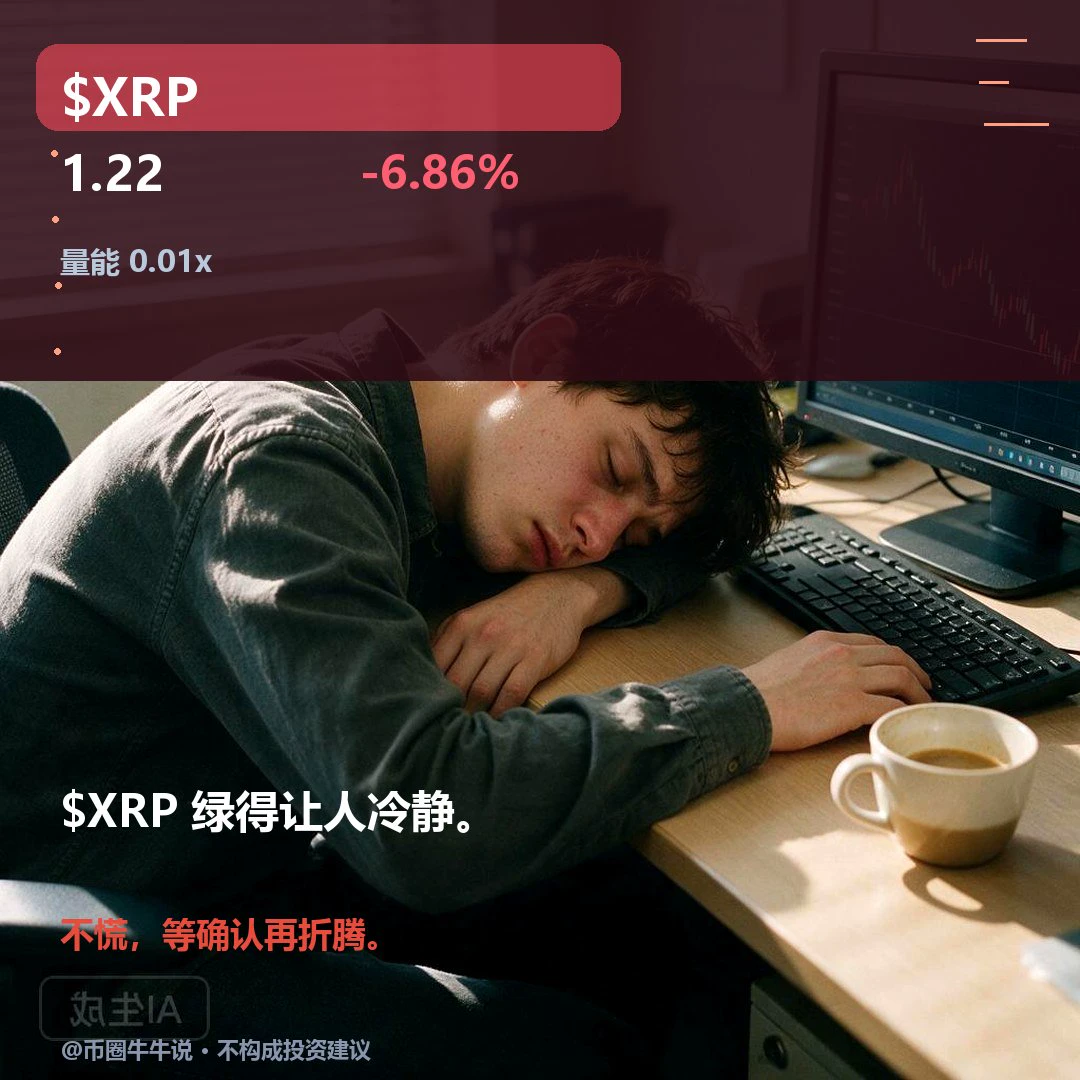
$XRP Currently trading at 1.2181, down 6.86% over 24H, with an intraday range of 1.1995–1.3269. 1H is weak: RSI is 18.53, and the current price is below the EMA20 at 1.2490; 4H is weak: RSI is 37.18, and the current price is below the EMA20 at 1.2664. The 1H volume ratio is 0.01. If price holds above the 1.3269 resistance level, watch for continuation; if it breaks below the 1.1995 support level, the short-term outlook weakens. In a later review, check whether price can hold above 1.3269 and whether it can reclaim 1.1995 after losing that level; with volume at only 0.01x, a single break needs
post-image
XRP-1.15%
$HYPE The plan for this trade was pretty clear: enter at 86, with a target around 77. But I lost my nerve midway and cranked the leverage straight up to 20x. Looking back, if I’d simply stuck to 10x, I wouldn’t have come anywhere near the liquidation price. The market did indeed reach around 77, so my call was right, but my position management failed first. Once I was liquidated, I lost all my principal. Getting the direction right doesn’t mean you can withstand the volatility. Leverage amplifies gains, but it also raises the cost of having less room for error. $HYPE That was a hard lesson. Ne
post-image
HYPE+0.33%
From Understanding to Action: Building Your Own Web3 Risk Assessment Framework

Today, we discussed many questions around digital asset sovereignty, private keys, smart contracts, on-chain restrictions, administrator privileges, open-source code, security audits, and project transparency.

These questions may seem unrelated, but they all point to the same core issue:

In the Web3 world, how can we gradually develop the ability to assess risks for ourselves, rather than relying on other people’s conclusions?

I believe what truly matters is not how many technical terms we can remember, but know
post-image
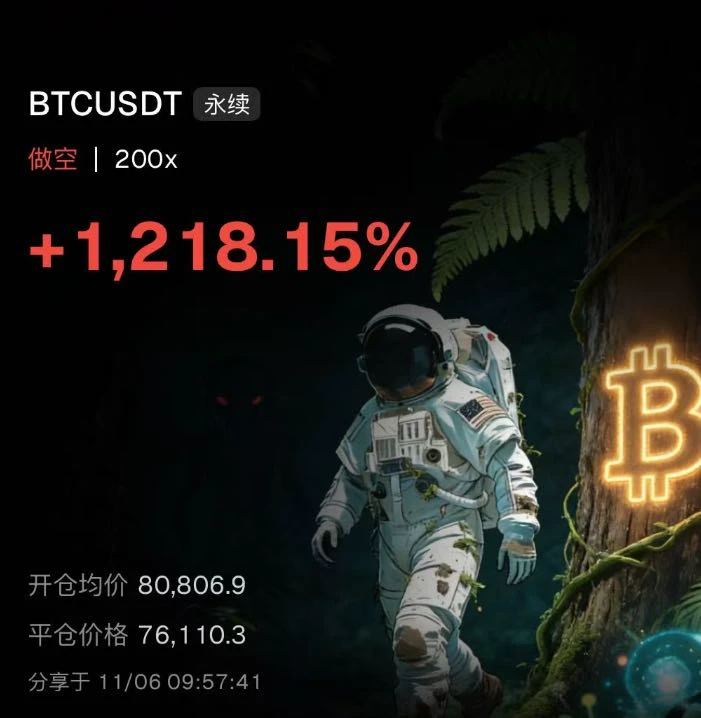
Those who follow the trend thrive; those who go against it perish👊$BTC
How many people last night, clinging to bullish fantasies, tried to buy the dip only to catch it halfway down?
We stayed firmly bearish, entering a short at 80800
We held all the way to 76100, securing a 1218.15% return
Trading has never been about luck; it’s about accurately reading the trend
Don’t call a bottom in a downtrend. Follow the direction, and profits will naturally follow
#美股史诗级抛售
post-image
BTC-0.67%
$SUI After this tens-of-millions-scale unlock hit, the price at 0.9 somehow didn’t budge at all.

The unlocked tokens weren’t dumped onto the market; instead, they went straight into staking contracts and were locked up. Spot buyers around 0.9 absorbed all the selling pressure.
Short sellers keep paying funding fees every day just to hold on. A slight push upward in the market, and shorts will rush to close their positions, turning into fuel for the longs.
#SUI$SUI
Risk warning: The above reflects only my personal views and does not constitute investment advice. Contract trading carries extrem
post-image
SUI-1.05%
Yesterday’s sell-off was reportedly caused by Trump dumping most of his BTC. During the decline, Coinbase didn’t see strong aggressive selling pressure, and there weren’t large inflows of coins from external sources either. It feels like the market was simply dragged down by U.S. stocks. BTC and ETH have been stronger than U.S. stocks. Yesterday, BTC only fell to around 75,200, with the next support at 74,900. If that level breaks decisively, it could drop to 73,000. The 1-hour chart is due for a bounce, so you could take a short-term long here. Don’t get too greedy right now, or you could eas
post-image
BTC-0.67%
ETH-1.26%
COING-1.76%
🔹Why Did U.S. Stocks Suddenly Plunge at the Open? Sell Orders Flood In While Buyers Struggle to Kee
live-cover
LIVE2,303
11.6 ETH Setup Strategy

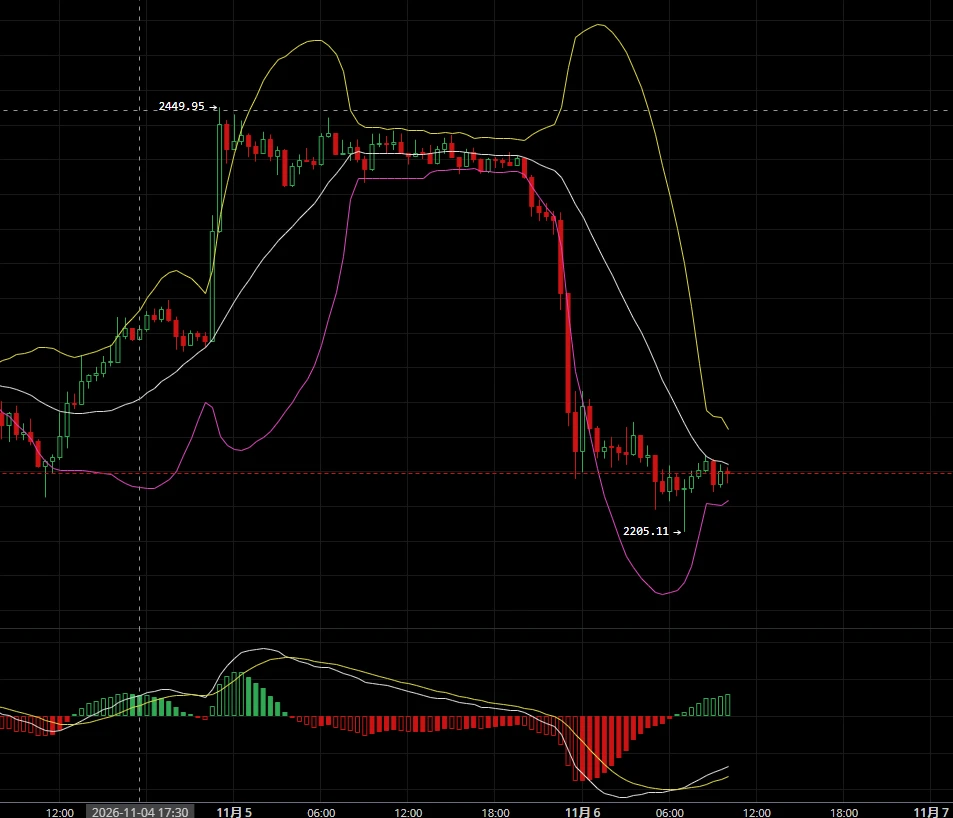
  ETH is in an oversold, oscillating recovery phase following a sharp drop after a spike. The Bollinger Bands are opening downward overall, with price trading between the lower and middle bands. Short-term selling pressure has been largely released, but the broader downtrend remains intact. Key support is concentrated around 2200, the previous low and a sentiment support zone. Secondary support is at 2220-2230, the lower edge of the current trading range. Initial resistance is at 2280-2300, where the Bollinger middle band and short-term moving averages converge. Strong
post-image
ETH-1.23%
Is BTC suitable for dollar-cost averaging? Use time to invest at a more measured pace!

In the cryptocurrency market, many people hope to buy at the lowest point and sell at the highest. But in reality, even experienced investors find it difficult to accurately predict every market turn. Some make a lump-sum purchase and then face a steep drawdown, while others keep waiting for a lower price and ultimately miss a long-term rally.

So, is BTC suitable for dollar-cost averaging?

First, it reduces the difficulty of market timing. The biggest advantage of dollar-cost averaging is that you invest
post-image
BTC-0.67%
Added a bit at the open today. Lately I’ve been buying dips while making T trades. Yesterday morning I trimmed tech and bought ICBC on the dip as a hedge, so I’ve got plenty of room in my positions today. A-shares have already taken a huge plunge, after all, so I’m a bit bolder. I’m mainly focused on the index, with small positions in individual stocks; my A-share account is still steady. My long Q got stuck at 667 last night. For the past three months, my play-money account has just been cycling between getting stuck and breaking even, going nowhere. What a mess.
261106 Bitcoin on the weekly chart, market is weak. BTC/ETH on the 12-hour chart; use stop-losses for short-term trades! BTC resistance levels: 77458/78827/79892 BTC support levels: 74718/73349/72284 ETH resistance levels: 2278/2319/2350 ETH support levels: 2198/2157/2126 Place the stop-loss slightly beyond the third price. Intraday trades should not exceed 5% of your position. Livestreams are held in the afternoon and evening; follow my homepage to find me. #Gate安全卫士免费开通
post-image
BTC-0.67%
ETH-1.26%
Load More

Join 40 M users in our growing community

⚡️ Join 40 M users in the crypto craze discussion

💬 Engage with your favorite top creators

👍 See what interests you

Trending Topics

USStocksFaceHistoricSelloff

586 Views3.46k Discussing

U.S. stocks suffered a sharp selloff on Thursday, with the Nasdaq closing down more than 5% and the Philadelphia Semiconductor Index falling over 12%. AI and chip stocks including $NVDA and $AMD were hit especially hard. Markets are reassessing AI valuations, data-center spending and future returns. Is this just short-term deleveraging, or the start of a deeper correction in the AI trade? Which sectors are you watching next?

GateLaunchesPoSECProofOfSecurity

11.51k Views563 Discussing

USNonfarmPayrolls

8.95k Views3.97k Discussing

View More