Square
Following
Hot
News
Notifications
Profile
Share your thoughts
placeholder
Article
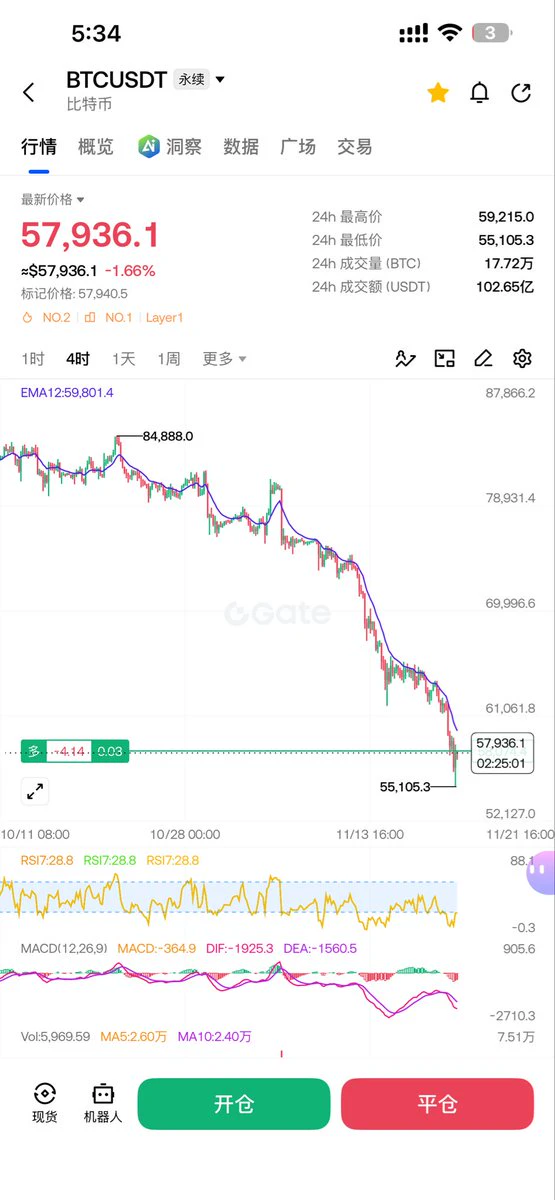
Lao Ji gave both short and long calls in one post! Short first, then long!

All short targets above 62000 have been hit, and the staggered buys at 55000-56500 are also rebounding now. Set your own protective stop-loss, and leave the rest to fate!
📉 BTC fell below $60,000—can it rebound this weekend?

On November 20, BTC briefly fell below $60,000, hitting its lowest level since July. Tech stocks also came under pressure, and selling sentiment continued to intensify.

The market had been discussing whether $60,000 could hold. Now the question is: after breaking below it, can BTC quickly reclaim that level? 👀

🔮 Weekend market predictions are live!

📈 Bullish camp: Quickly reclaim $60,000

📉 Bearish camp: Continue lower and search for new support

💬 Do you think BTC will reclaim $60,000 first, or fall further first?

Leave your pre
GateSquare
📉 BTC fell below $60,000—can it rebound this weekend?
On November 20, BTC briefly fell below $60,000, hitting its lowest level since July. Tech stocks also came under pressure, and selling sentiment continued to intensify.
The market had been discussing whether $60,000 could hold. Now the question is: after breaking below it, can BTC quickly reclaim that level? 👀
🔮 Weekend market predictions are live!
📈 Bullish camp: Quickly reclaim $60,000
📉 Bearish camp: Continue lower and search for new support
💬 Do you think BTC will reclaim $60,000 first, or fall further first?
Leave your prediction + a key price level in the comments, and we’ll review it together next week!
#BTC跌破6万美元关口

repost-content-media
BTC-0.67%
Trenches
FIONA
F
bade
b
FIONA
B34n...pump
Market Cap
$.
Change
.
24h Vol
$.
Holders
.
PIEVERSE
P
bade
b
PIEVERSE
0x0e...25a9
Market Cap
$.
Change
.
24h Vol
$.
Holders
.
mihao
m
bade
b
mihao
4Cxj...pump
Market Cap
$.
Change
.
24h Vol
$.
Holders
.
CLAUDIA
C
bade
b
CLAUDIA
2j5S...W2ZM
Market Cap
$.
Change
.
24h Vol
$.
Holders
.
IDOL
I
bade
b
IDOL
0x3b...ab07
Market Cap
$.
Change
.
24h Vol
$.
Holders
.
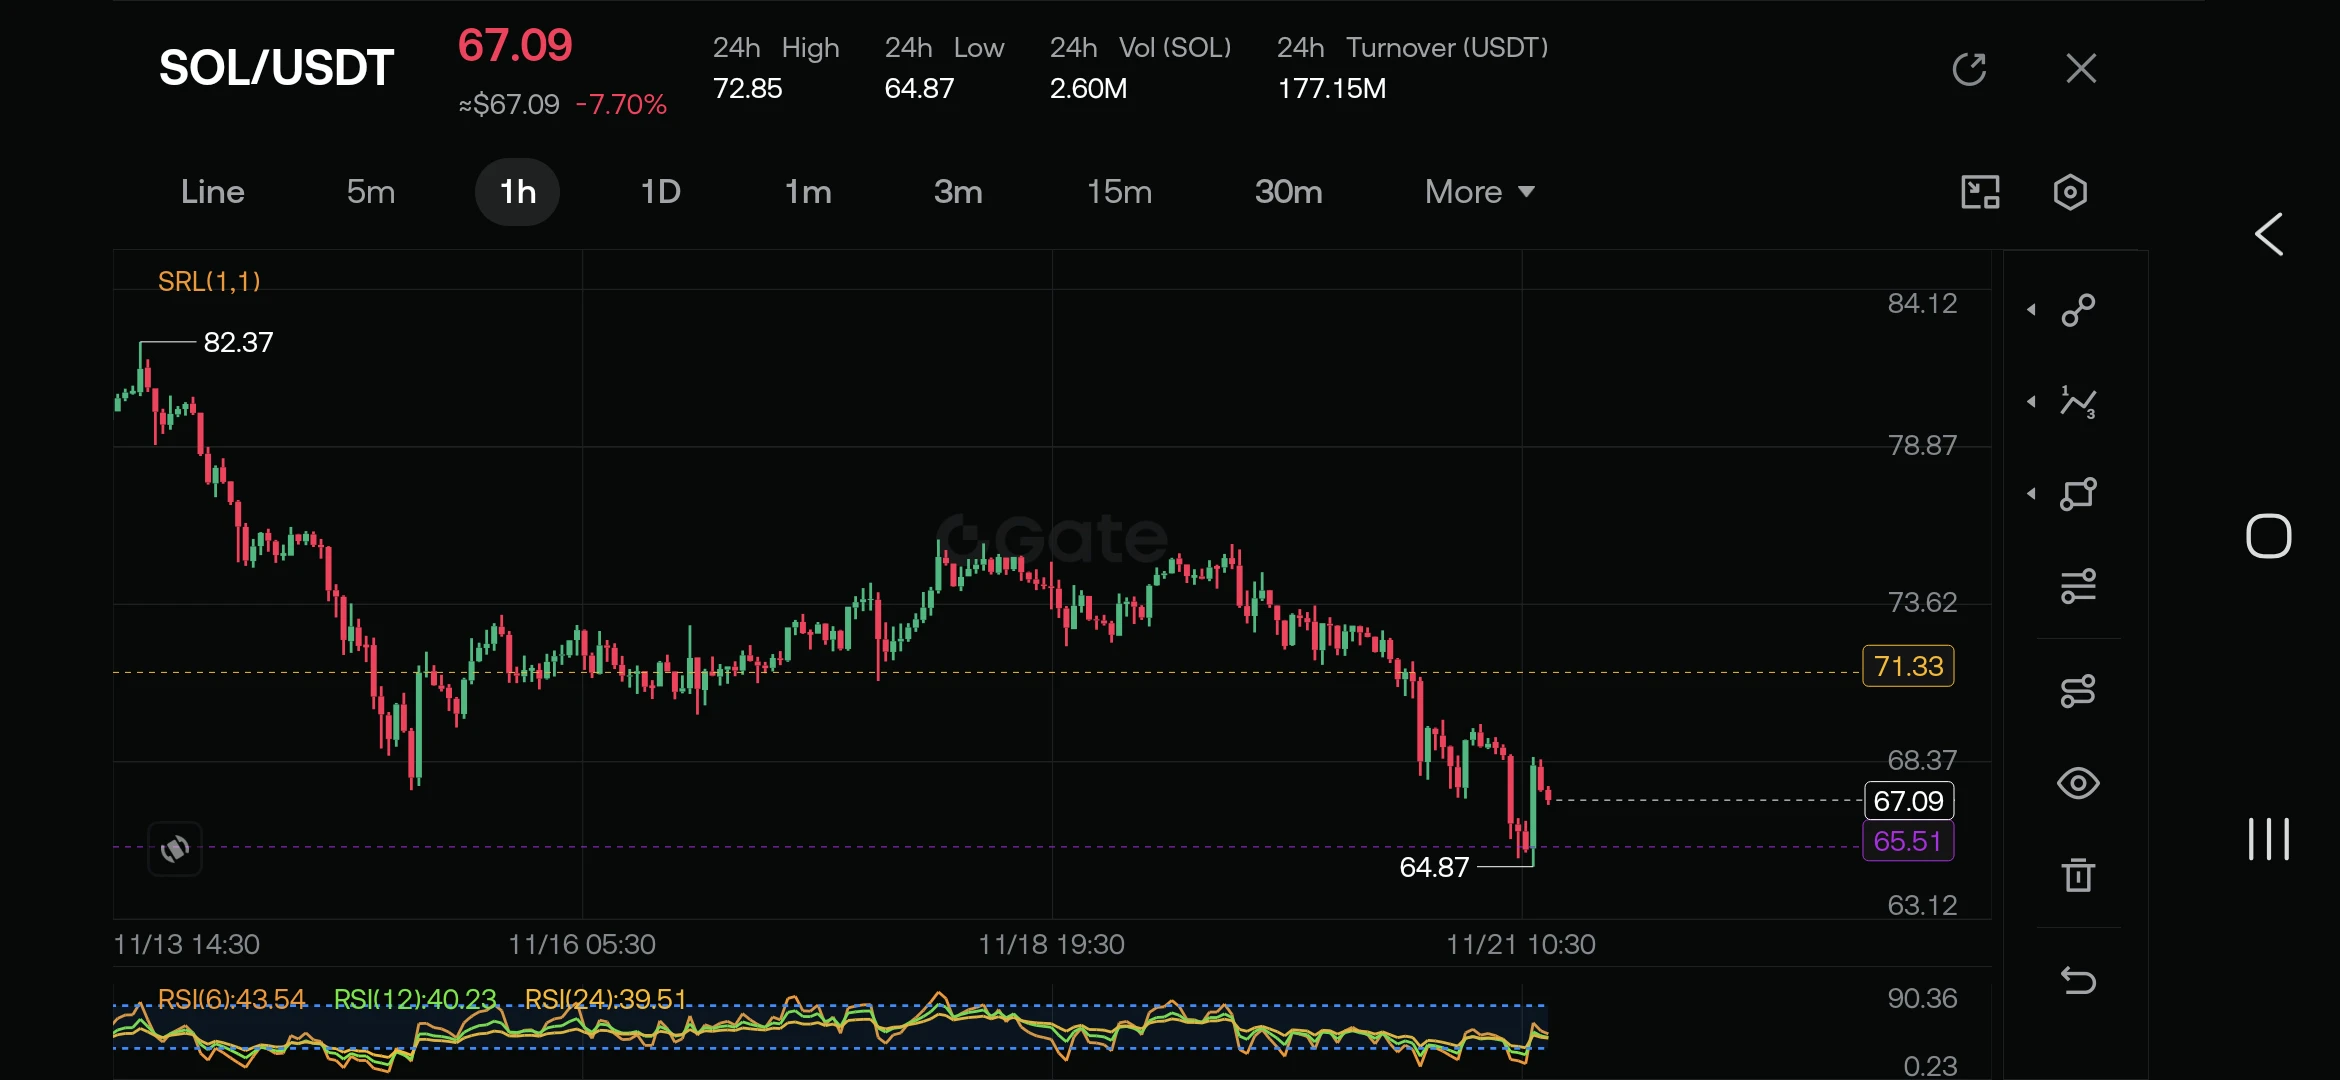
SOL/USDT 1H Technical Analysis: Bears Pressuring Key Support
​Solana ($SOL ) is facing heavy downward pressure on the 1-hour timeframe, currently trading at $67.09 after a sharp 7.70% drop over the past 24 hours. Following a failed mid-week recovery attempt near the $75.00 zone, sellers regained full control, driving price action decisively below the $71.33 pivot level and triggering an aggressive breakdown toward the recent $64.87 swing low.
​Market Structure & Momentum:
The short-term trend remains firmly bearish, characterized by a clear sequence of lower highs and lower lows since the Novem
post-image
SOL-0.77%
  • 1
Keith Alan warns Bitcoin moving average crossover signal may return
Bitcoin is showing two notable moving-average crosses that are drawing comparisons to a key period in 2023.
After a sharp drop from around $80,000 to near $61,000 in November, Bitcoin is forming a technical setup that reminds traders of late 2023.
⚠️ Personal market analysis only. NFA — manage risk and DYOR.
Educational content, not investment advice or a recommendation to buy, sell, deposit, or withdraw any asset. No paid promotion or referral/affiliate links.
post-image
BTC-0.67%
  • 1
Daily Quote | Unrealized gains are borrowed from the market; only closing your position makes them yours.
The numbers in your account are only temporarily parked with you until you close your position. Many people have made profits, but after earning, they think they can make even more—and end up giving back even their principal.
post-image
  • 1
  • 2
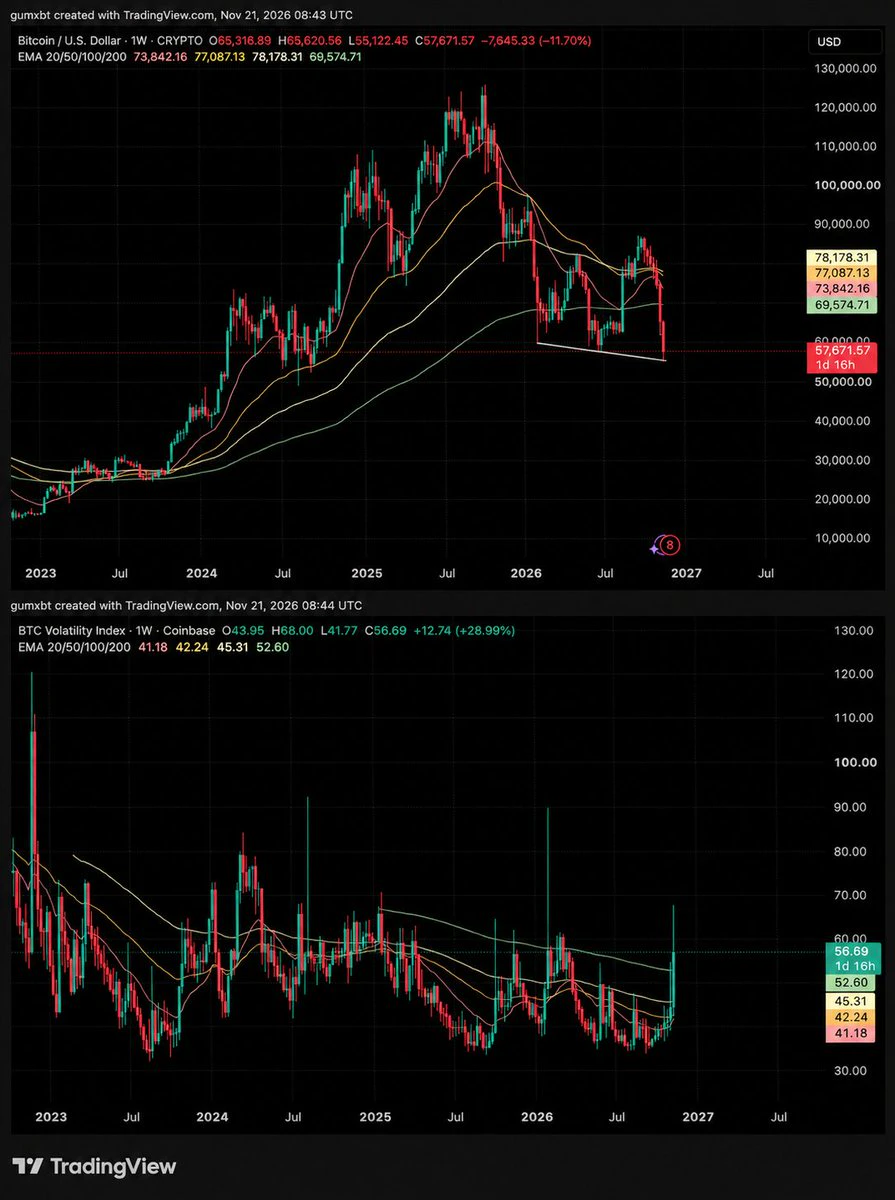
2 accounts on CT that have been bullposting daily since $87K
Yesterday their sentiment shifted bearish, I don't take it lightly
- Open Interest back to where it was at $64K
- BTC Volatility index spiked to 50, spikes mark the end of moves, not necessarily the downturn
- Funding on BTC ETH SOL turned negative for the first time
Not calling for a bottom, but its the first time we're seeing bulls not leverage up on every dip
post-image
BTC-0.65%
ETH-1.23%
SOL-0.74%
BVOL-1.41%
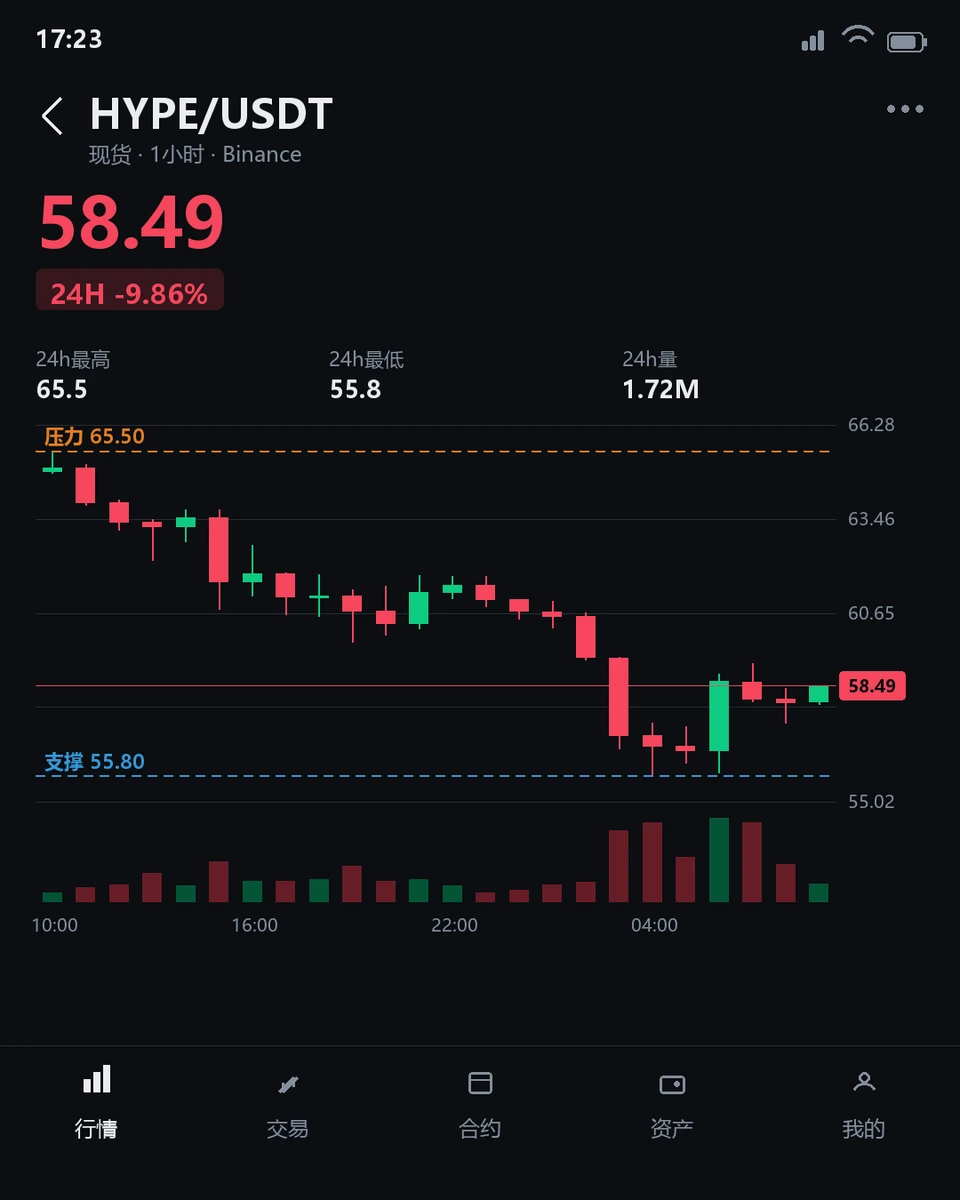
$HYPE Oversold ≠ Bottom: A Clash Between Rebound Demand and Structural Weakness

$HYPE is currently trading at $58.34, down 10.90% over the past 24 hours, with an intraday range of 55.8 to 65.55. The 1-hour RSI14 is 37.51 (neutral to weak), while the 4-hour RSI14 is just 19.99 (deeply oversold), showing a clear divergence between the two timeframes. This structural contradiction reveals the core tension in the current market: the battle between fading short-term momentum and an intermediate-term trend that has yet to bottom.

The key point to watch is that support on both the 1-hour and 4-hour
post-image
HYPE+0.24%
BTC has bottomed out.
Others are fearful; I’m greedy.
I’m jumping in first.
post-image
BTC-0.67%
Giid afternoon
live-cover
LIVE2,245
PEARL-2.04%
The sky is so blue today. Trade your positions less and go for a walk.
post-image
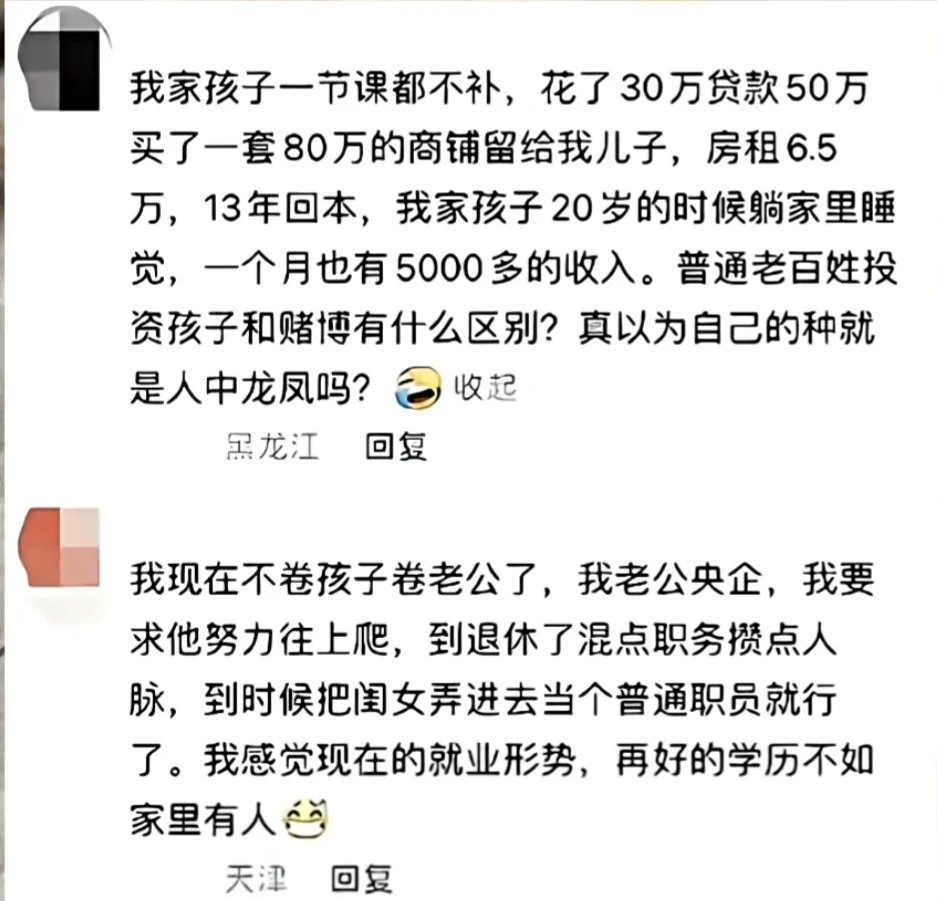
Put that way, it really does seem like there’s no need to have kids. Just look at Japan—quite a few people in their 70s are still working.
post-image
$INFI Wait patiently for 0.0001, buy $10k
post-image
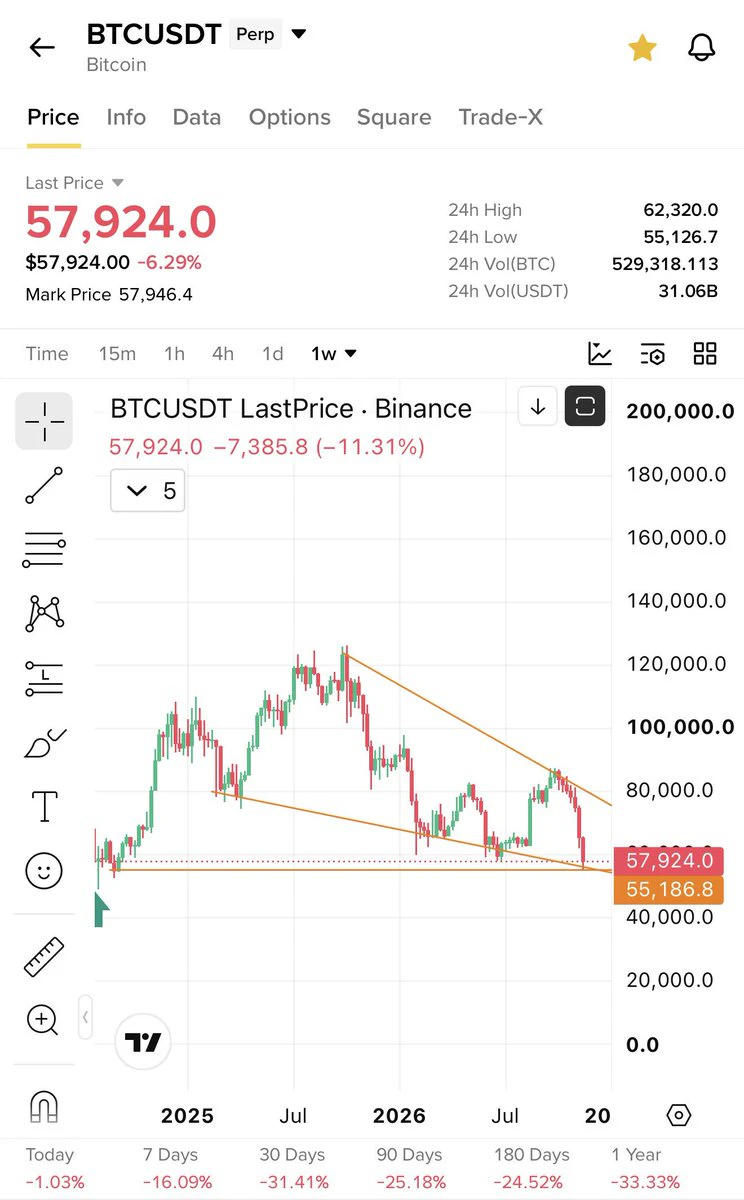
$Btc at another trend line
After 7 weeks of fully oversold
A bounce from this area will be good
Our alts will go v good from here
post-image
BTC-0.67%
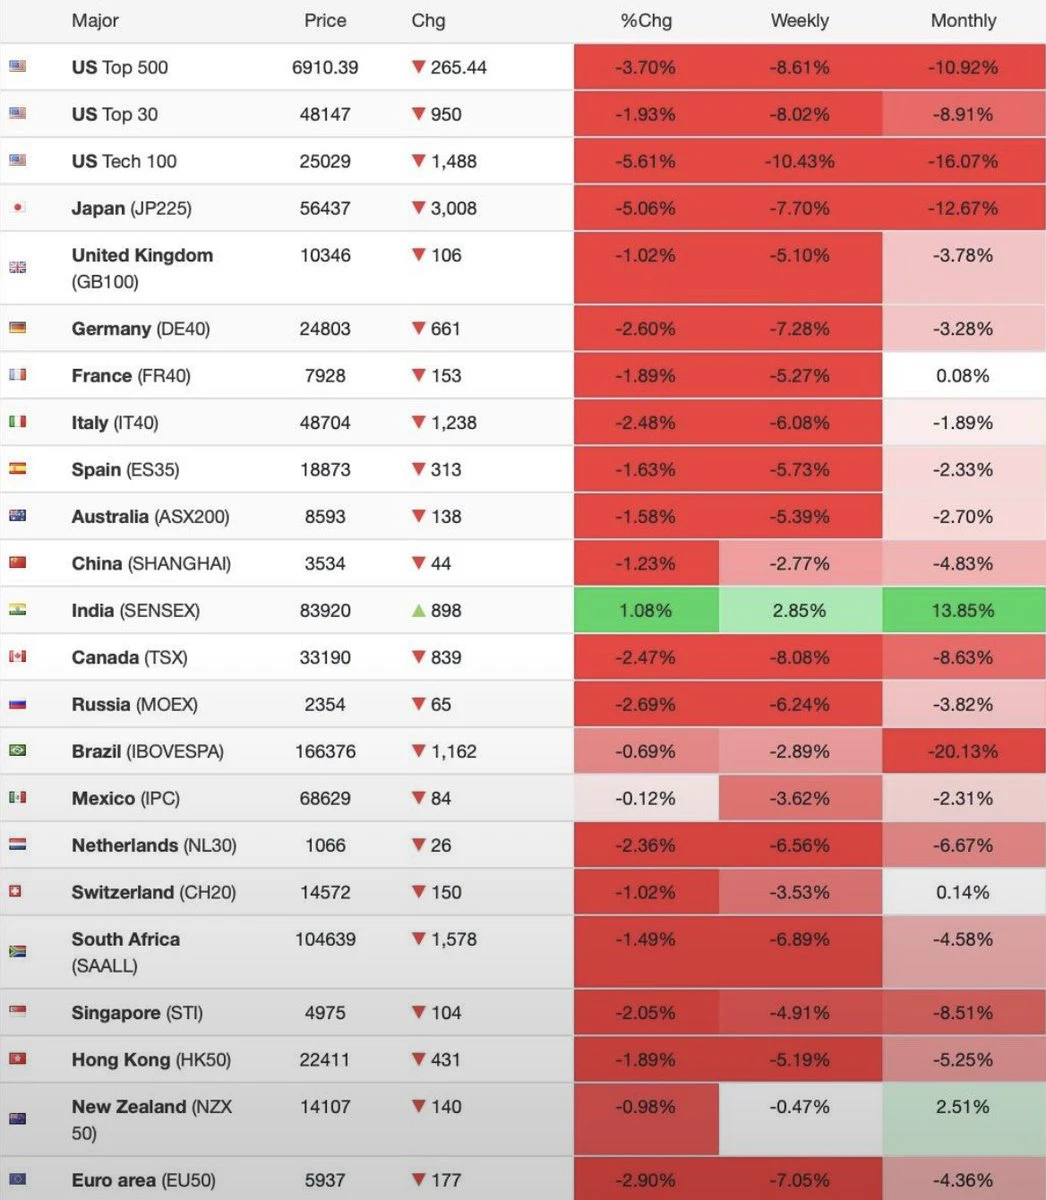
🇮🇳 India stands out as global markets tumble!
📈 India is reportedly the only major stock market trading in the green as global markets face widespread losses.
🌍 Indian equities are showing resilience amid global market turmoil! 📊
post-image
$SKYAI Will it pump in seconds
post-image
SKYAI-7.58%
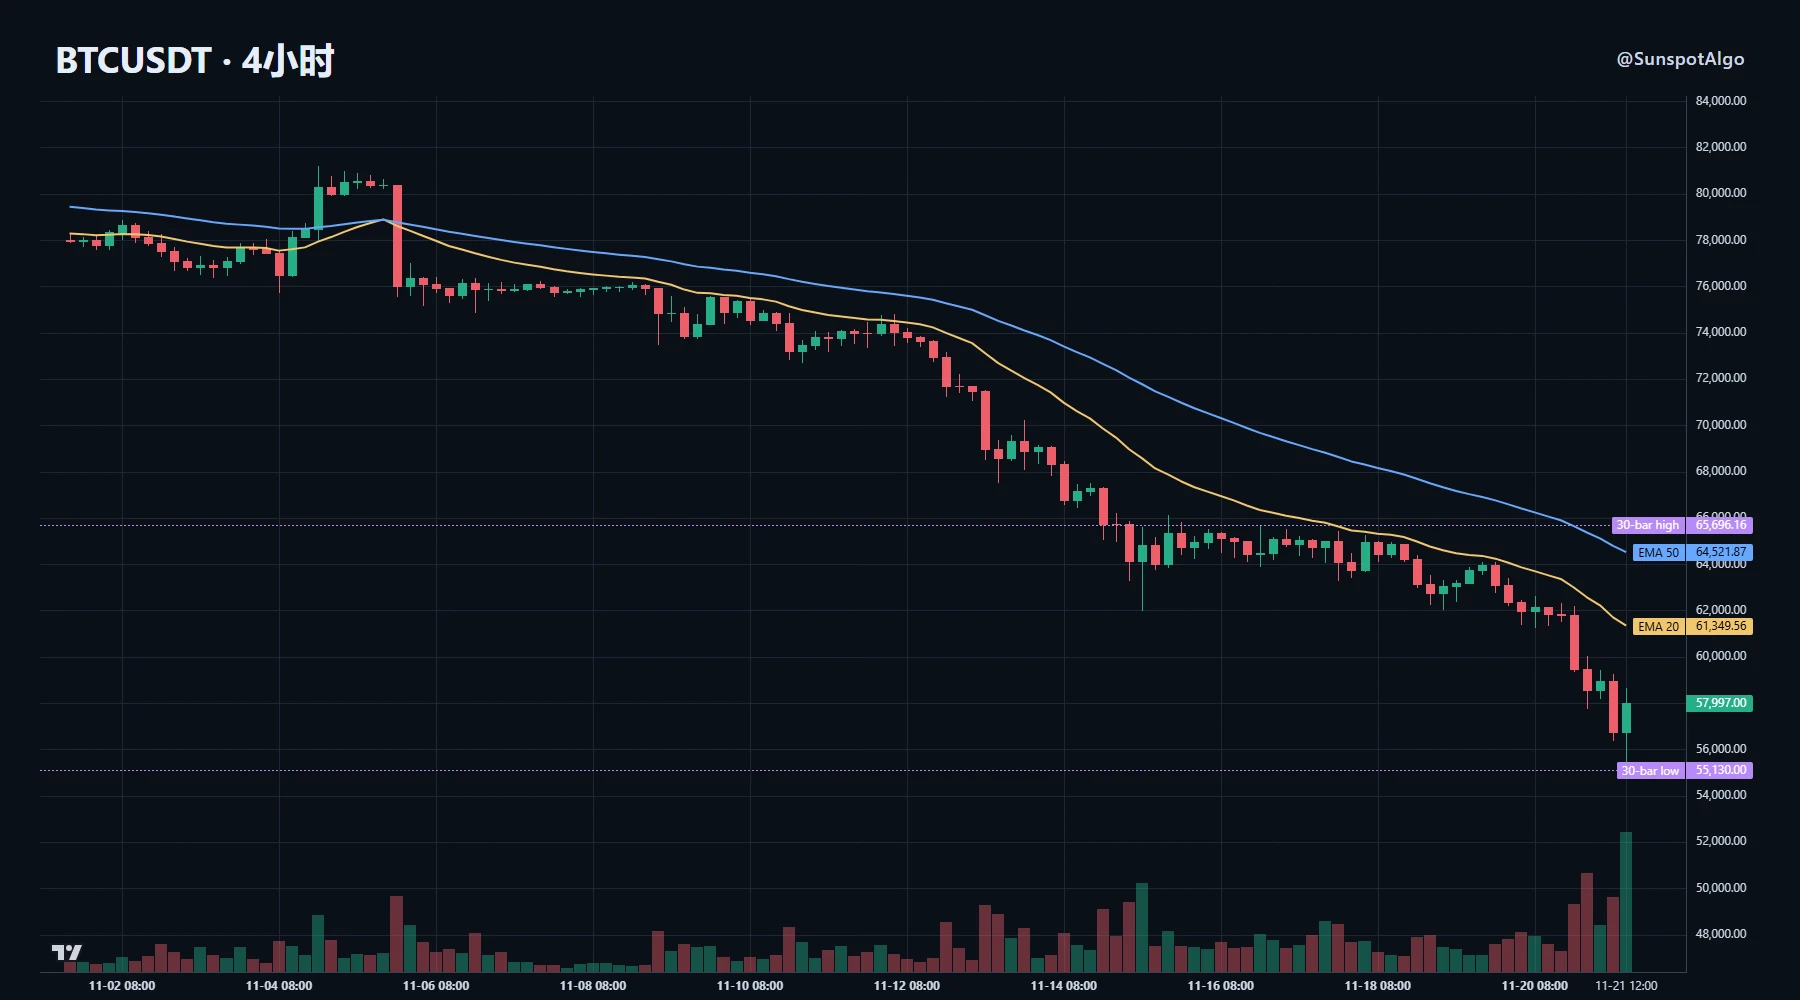
Looking at BTC’s price action, the sharp drop can make it seem as though bears are firmly in control, but changes in open interest point to a more measured conclusion.

Over the past 24 hours, the price fell about 6%, while open interest contracted by nearly 3%. This combination of falling prices and lower open interest suggests the selling pressure mainly came from longs closing out, with insufficient evidence of new short positions being opened. In terms of market rhythm, this looks more like a concentrated wave of deleveraging than the start of a new downtrend, and the two scenarios have ve
post-image
BTC-0.65%
Crypto future market update btc,zec,sol,soxl
live-cover
LIVE2,006
SOXL-1.16%
BTC-0.65%
ETH-1.23%
SOL-0.74%
XAU+0.38%
Bitcoin Below $57K: The Real Test Is Demand, Not Price.

$BTC has fallen more than 50% from its October 2025 ATH above $126K, briefly breaking below $57K.

The sell-off is backed by serious numbers: nearly $2B in leveraged liquidations within 24 hours, including $650M in just one hour. Meanwhile, BlackRock's IBIT recorded its largest-ever daily outflow of $541M on November 19.

But here's what matters: liquidations explain how quickly prices fall; ETF outflows raise questions about who is still willing to buy.

The next levels are critical. $55.5K is immediate downside support, while $60K
BTC-0.67%
IBIT-5.97%
Tutoring isn’t the only path to education.

In my experience, if you don’t want to learn, no amount of tutoring will help. If you do, you can figure things out on your own without tutoring.
post-image
I’m worried the market’s been so intense these past few days that if I drink coffee, I might drop dead.
I’ve switched from coffee to ginseng tea. I really do value my life.
I’ll pick someone in the comments who’s as delicate and health-conscious as me and send them a quarter’s supply of Eagle Brand Ginseng Tea🍵. Let’s get healthy together.
Not an ad—just because I love my fans😘😘😘.
post-image
Load More

Join 40 M users in our growing community

⚡️ Join 40 M users in the crypto craze discussion

💬 Engage with your favorite top creators

👍 See what interests you

Trending Topics

BTCBreaksBelow60K

2.1M Views29.3K Discussing

BTC fell below $60,000 on November 20 for the first time since July, alongside a tech stock selloff and broader pressure on risk assets. Will $60K become resistance, or can BTC quickly reclaim it? What price or volume signals would convince you that selling pressure is easing?

GateDirectIPOPhase3ANTAllocates92100Shares

746.9K Views4.8K Discussing

NvidiaDropsNearly14Percent

313.5K Views7.5K Discussing

View More