Square
Following
Hot
News
Profile
Share your thoughts
placeholder
Article
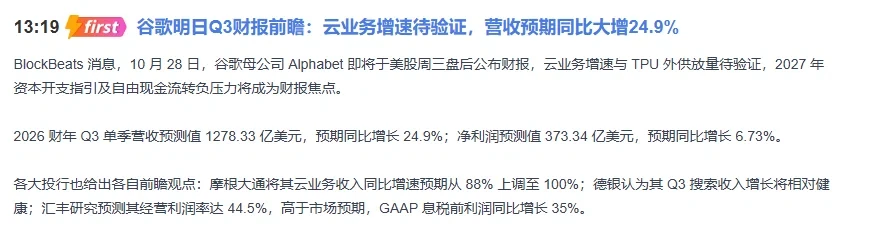
The most dangerous signal ahead of GOOGL's earnings isn't a crash—it's that the stock is still rising while money has already started flowing out!
Don't wait until the candlesticks come crashing down to realize that the breakout you chased may have been someone else's exit!
The outflow chart looks disastrous, with net outflows exceeding $5 million in 12 hours! This isn't accumulation at all—it's a classic “pump to lure in buyers” play.
The liquidation map shows a large buildup of short positions at 328–333, while around 314 below is where the bulls are most vulnerable. Everyone thinks the big
post-image
GOOGL+0.11%
The Fed decision is still ahead, but AI stocks are already taking off! The chip index rises 3.6 and
live-cover
LIVE1,992
Trenches
TTWO
T
bade
b
TTWO
TTWo...FbKo
Market Cap
$.
Change
.
24h Vol
$.
Holders
.
BNCB
B
bade
b
BNCB
0x49...ec3f
Market Cap
$.
Change
.
24h Vol
$.
Holders
.
DJT
D
bade
b
DJT
DJTu...xvoF
Market Cap
$.
Change
.
24h Vol
$.
Holders
.
ZIG
Z
bade
b
ZIG
0x8c...1145
Market Cap
$.
Change
.
24h Vol
$.
Holders
.
STONK
S
bade
b
STONK
6GmA...UNgx
Market Cap
$.
Change
.
24h Vol
$.
Holders
.
Attention, European Cryptocurrency Users! 14 Cryptocurrencies on Coinbase Will Be Restricted!
Coinbase has set a clear conversion date for European users who still hold certain tokens. On October 30, 2026, the exchange will automatically convert the remaining balances of 14 restricted crypto assets held by retail customers in the European Economic Area.
The list includes some familiar names: USDT, PYUSD, and DAI. If you hold any of these cryptocurrencies in your Coinbase account in the European Economic Area (EEA) and take no action, the system will ultimately decide which cryptocurrency you r
COIN+0.95%
PYUSD-0.09%
USDC+0.01%
USD1+0.00%
GUSD+0.00%
New Streamer] 🔹AI Stocks Take Off Ahead of the Fed Decision! The Semiconductor Index Jumps 3.6 and
live-cover
LIVE2,080
Two dormant $PEPE whales moved 2.27T $PEPE ($10.19M) today.
PEPE+0.97%
I wonder if it’s going to rain.
post-image
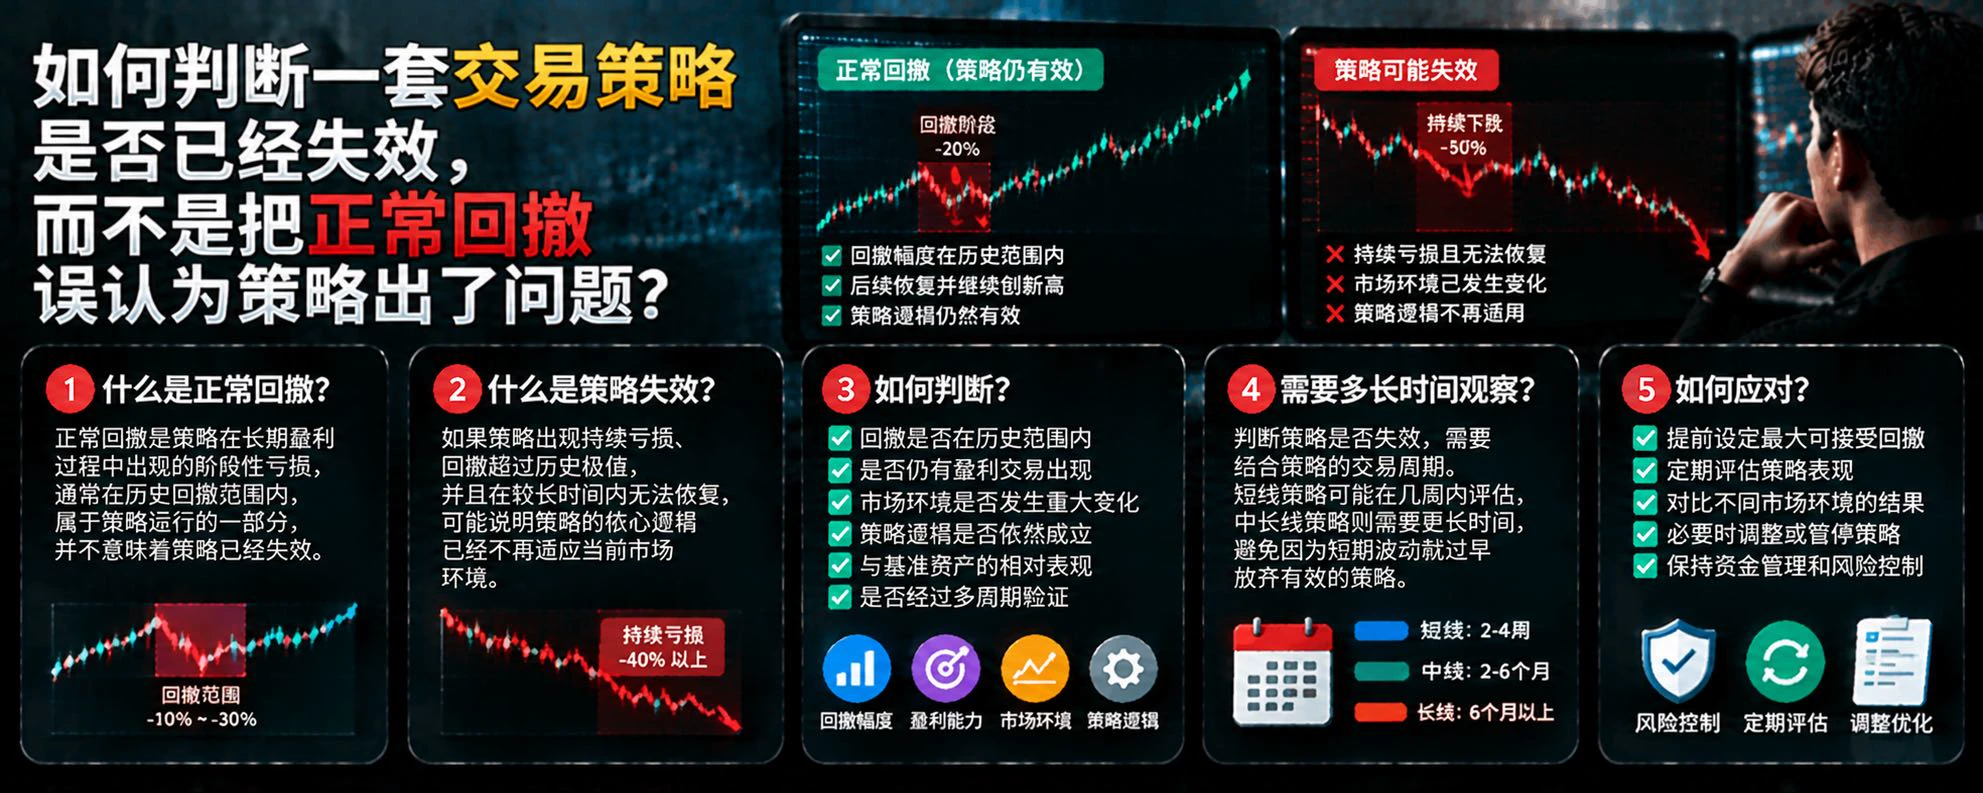
How can you tell whether a trading strategy has failed, rather than mistaking a normal drawdown for a problem with the strategy?
A strategy incurring losses while in use does not necessarily mean it has failed. Any strategy involving uncertainty may experience drawdowns. What matters is distinguishing normal fluctuations from signs that the strategy’s edge is fading.
First, check whether the drawdown exceeds its historical range. If the current drawdown is clearly beyond what was common in historical testing, it warrants further investigation. However, the historical maximum drawdown is not a
post-image
  • 2
#FedDecisionCountdown
#FedDecisionCountdown ⏳📊
Fed Decision Countdown: The Global Market Is Waiting for a Big Moment!
The countdown to the Federal Reserve's interest rate decision has become an important topic for investors, traders, and cryptocurrency enthusiasts around the world. As the financial market prepares for a major economic announcement, attention is turning toward inflation, interest rates, economic growth, and the future direction of monetary policy.
The Federal Reserve, commonly known as the Fed, plays a major role in the United States economy. Its decisions can influence borro
XAU+0.38%
BTC-0.67%
ETH-1.26%
  • 2
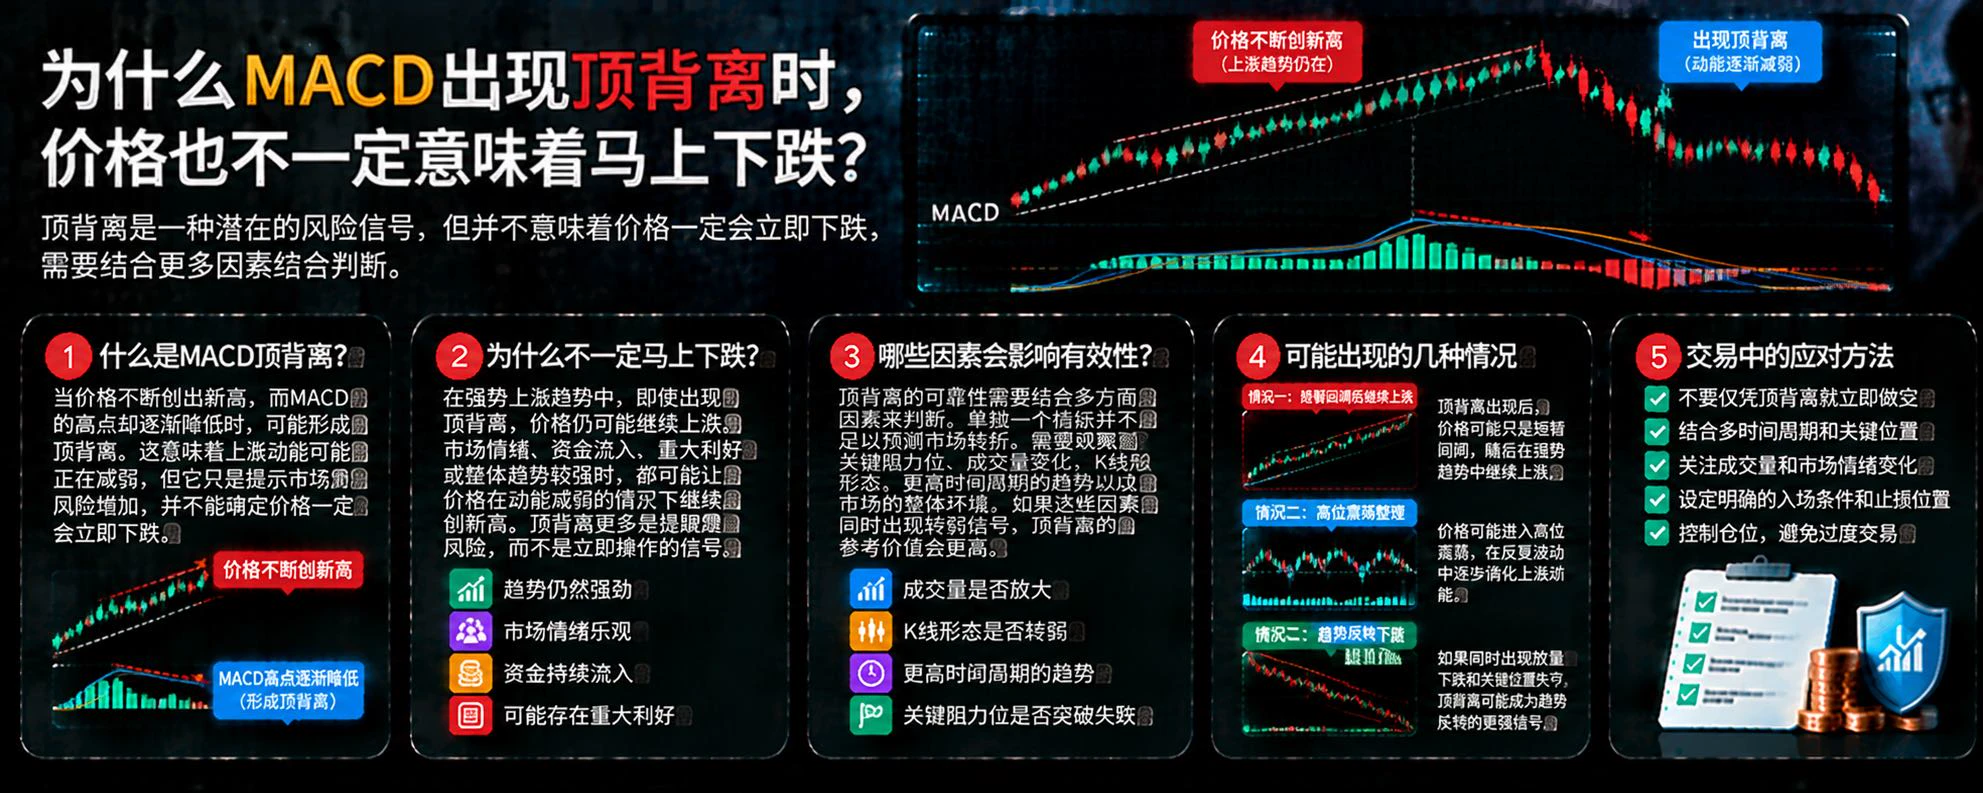
Why doesn’t price necessarily fall immediately when MACD shows bearish divergence?
In crypto markets, when price keeps making new highs while the highs on the MACD indicator gradually decline, bearish divergence may form. Many traders view it as a short signal, but bearish divergence indicates that upward momentum may be weakening; it does not mean price will necessarily fall immediately.
First, understand what bearish divergence means.
Bearish divergence usually appears when price highs keep rising while the corresponding MACD highs gradually decline. This may indicate that upward momentum is
post-image
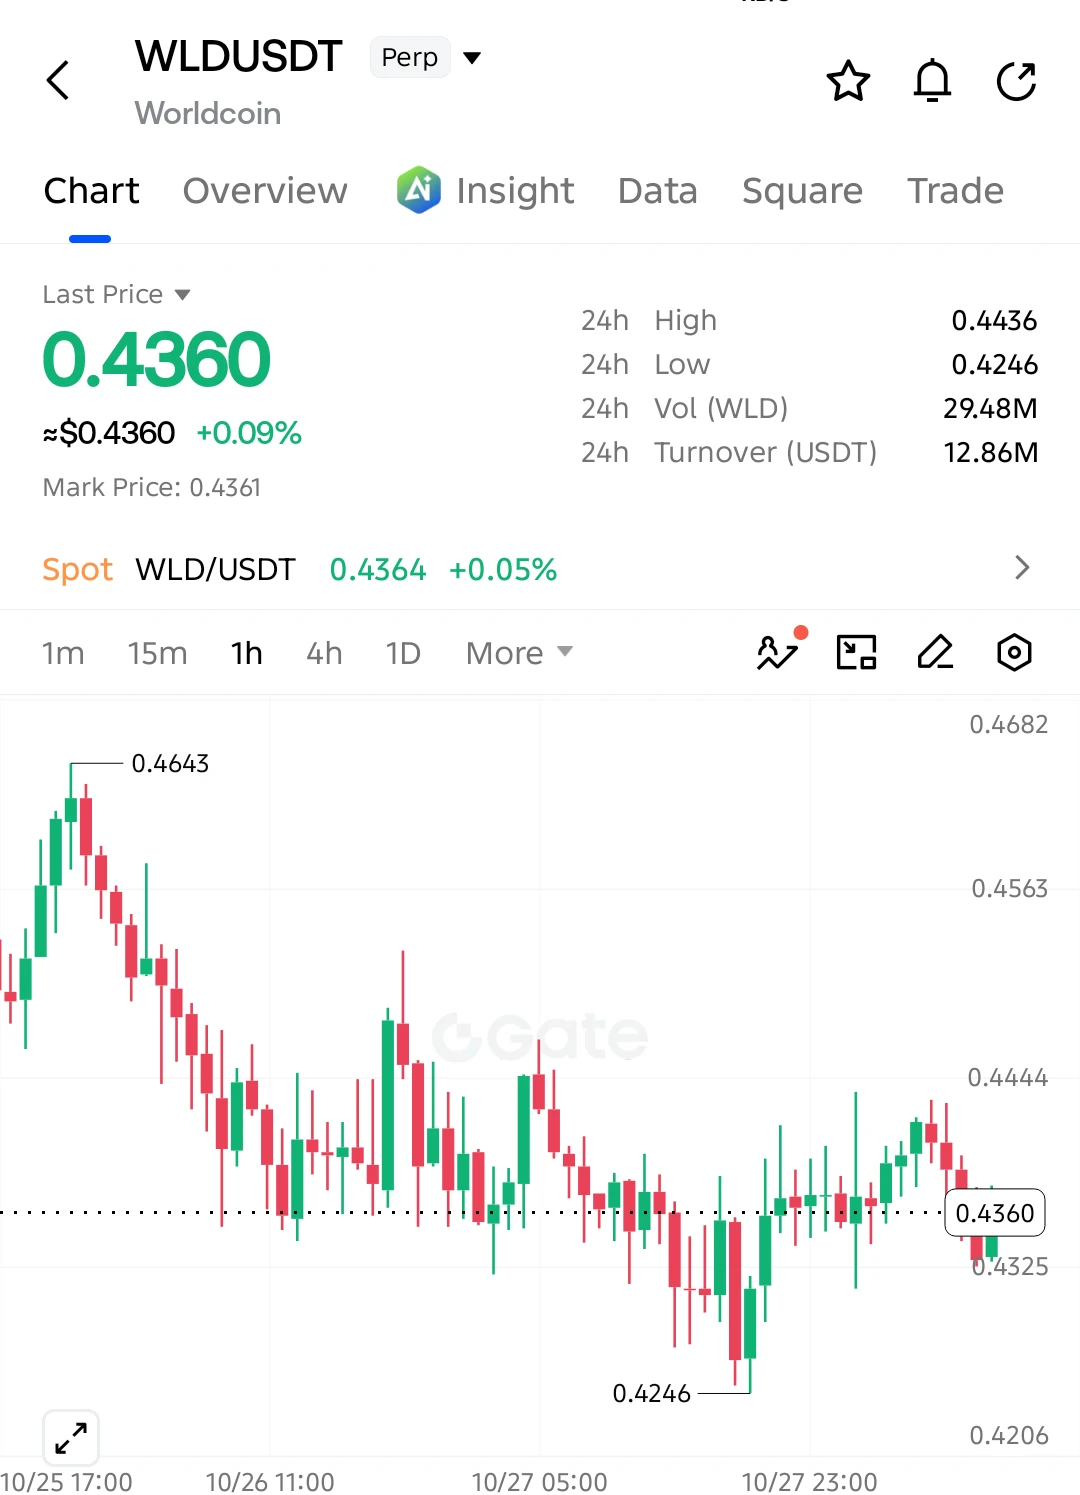
$WLD Struggling Below 0.444 — Is 0.42 the Next Target?
$WLD SHORT SETUP 📉
Entry: 0.4390–0.4420
SL: 0.4460
TP1: 0.4325
TP2: 0.4280
TP3: 0.4246
Extended Target: 0.4200
Trigger: 1H bearish rejection from the entry zone, followed by a close below 0.4380.
Invalidation: 1H close above 0.4460.
$WLD remains under selling pressure after falling from 0.4643. Recent recovery attempts have struggled near 0.444, while buyers are defending the 0.4325 area. If sellers regain control and support breaks, another decline toward 0.4246–0.4200 could follow.
post-image
WLD-5.61%
  • 5
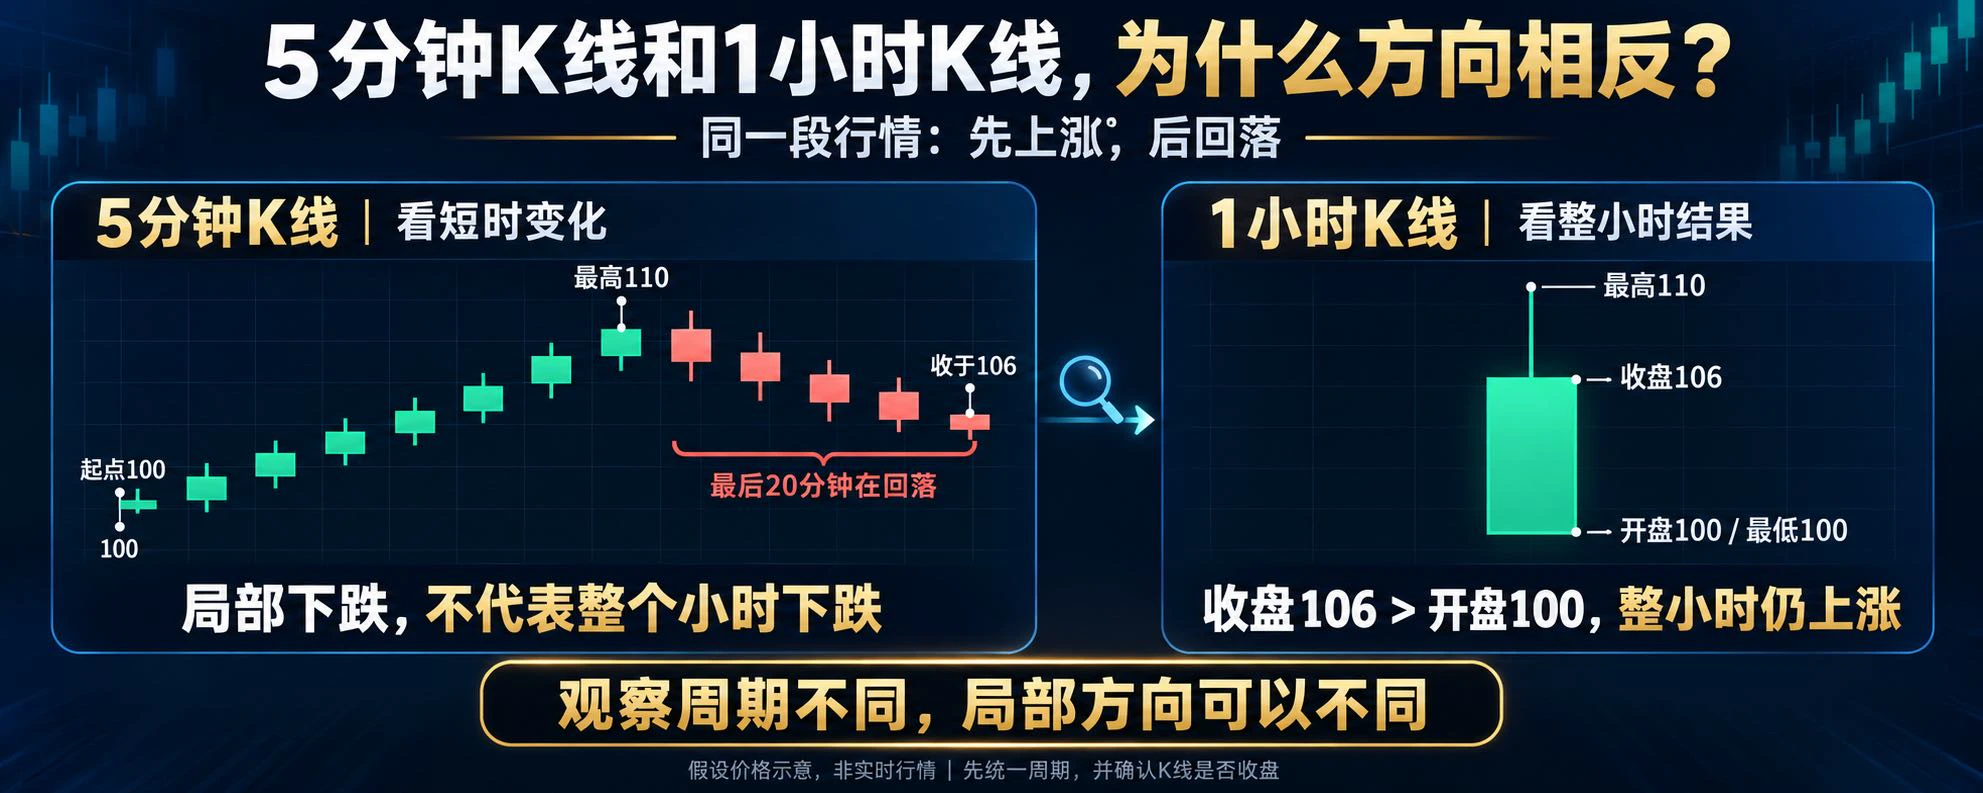
Why do 5-minute and 1-hour candlesticks seem to move in opposite directions?
A 5-minute candlestick records the open, high, low, and close over the corresponding five-minute period; a 1-hour candlestick records the entire hour.
Within an hour, the price may rise sharply and then dip slightly, so it is still up overall, even as the last few 5-minute candlesticks are falling. Different observation windows can show different local directions.
Before discussing price movements, clarify the time frame.
When I first started, I also found it easy to think that different charts contradicted each other
post-image
One sentence from Powell, and the entire crypto market loses sleep! At 2 a.m., who's really pulling the strings behind BTC?
The crypto market's alarms are set for tonight, as everyone waits for the Fed's decision and Powell's remarks afterward.
An unchanged interest rate is probably just the appetizer; how Powell describes inflation, the economy, and future policy could be tonight's main course. #美联储利率决议倒计时
#WeeklyShowcase
If he emphasizes that inflationary pressures remain stubborn and signals no plans to ease policy in the near term, the market may have to recalculate the valuations of risk
BTC-0.67%
ETH-1.26%
  • 41
You just happened to pass right by! I’m heading over to get ready to join the parade.
post-image
At first glance, I thought the pants had fallen down. Would anyone really buy a design like this?
Earnings Season: A Battle of Expectations
Every earnings season, we see some very interesting phenomena.
Earnings beat expectations, yet the stock plunges.
Results look unremarkable, yet the stock climbs steadily after hours.
The reason is simple.
Stock prices trade on expectations, while earnings reports reveal results.
The gap between the two often determines the market’s next move.
Here are several companies worth watching closely.
$MSFT Microsoft
Watch Azure cloud growth and whether AI capital expenditures can continue converting into revenue.
$GOOGL Google
Watch the resilience of its sear
MSFT-0.21%
GOOGL+1.15%
SNDK+3.84%
SK Hynix’s earnings came out during the overnight session, and the entire memory sector surged. Taking this opportunity, I’ll share my view again:
Wall Street is under orders to pump the market right now. It fell too fast before, so technically this is a rebound testing resistance; it actually has nothing to do with earnings. So many companies beat earnings expectations last week, and didn’t their stocks still crash?
At the neocloud level, Wall Street is temporarily ignoring their CDS and probability of bankruptcy, as well as financing risks. Is it because these risks really don’t exist?
At th
TOKEN-0.16%
MSFT-0.21%
SOXL+11.61%
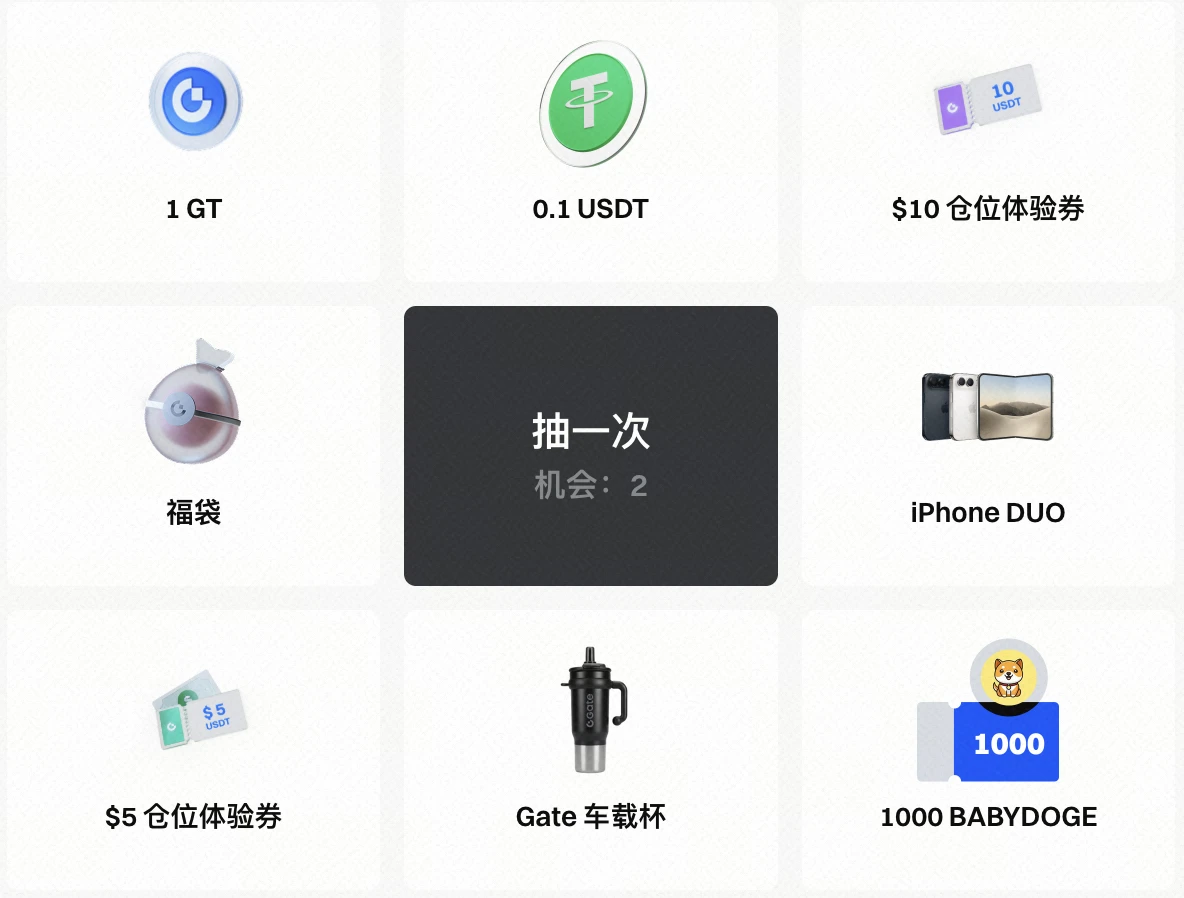
🎁 iPhone DUO, GT, USDT, and premium Gate merchandise are waiting to be won!
The Gate Live livestream check-in event is underway! Watch livestreams, post comments, and share livestreams to easily rack up Heat Points and unlock chances to enter the draw!
📌 Today's Tasks
Watch a livestream for 5 minutes: +10 Heat Points
Post 1 comment: +10 Heat Points
Share 1 livestream: +20 Heat Points
Book 1 livestream: +5 Heat Points
Visit the livestream page: +5 Heat Points
Earn 80 Heat Points in total to enter the draw once!
🏆 Leaderboard rewards: The top 10 by Heat Points will each receive 2 additional r
post-image
GT-2.41%
  • 7
  • 2
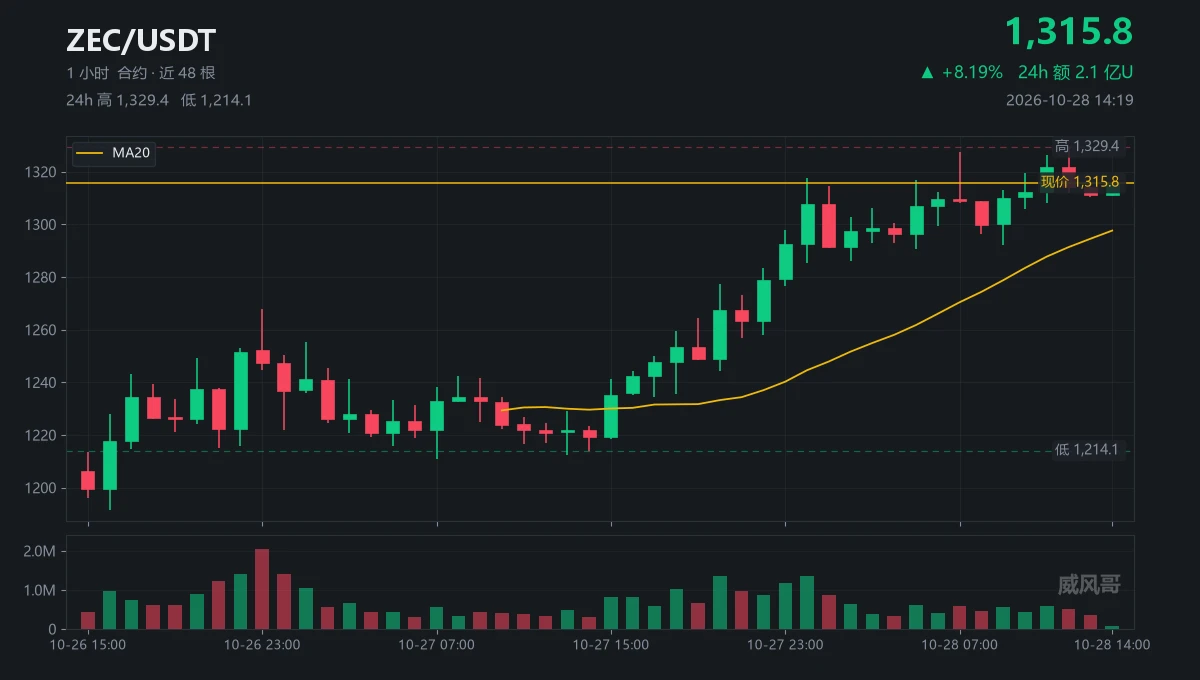
Watching ZEC since noon, and my hands have been itching
Still haven't bought; buying now would just be trading money for experience
Who sold that 1329.41 candle?
Volume was 524k contracts, not even reaching the average of 648k
It touched 1329.41, now it's at 1315.75
Fourteen bucks, given back in two hours
How much thicker are the orders stacked above than the buying interest?
The lows: 1305.84, 1308.00, 1312.00, 1310.54
Four hourly candles, and not one broke below 1305.84
Two consecutive lower highs, while the lows haven't retreated in four hours
The range has narrowed to just seven points, 13
post-image
ZEC+1.29%
ZEC 15m Setup: Resistance at the Highs—Short! 📉🎯$ZEC ZEC has seen a nice rally, but the 15-minute chart shows momentum fading near the 1,330 resistance level. We’re seeing some rejection wicks, suggesting sellers may be re-entering and triggering a short-term pullback. If selling pressure continues, here’s a clear short setup: 🔴 Direction: Short 📍 Entry: ~1,314.24 🎯 Take-profit 1: 1,294.00 🎯 Take-profit 2: 1,273.50 🎯 Take-profit 3: 1,253.50 🛑 Stop-loss: 1,350.50 ⚠️ Pro tip: Once take-profit 1 is hit, move your stop-loss to your entry price to make this trade risk-free! 🛡️ Would you s
post-image
ZEC+1.16%
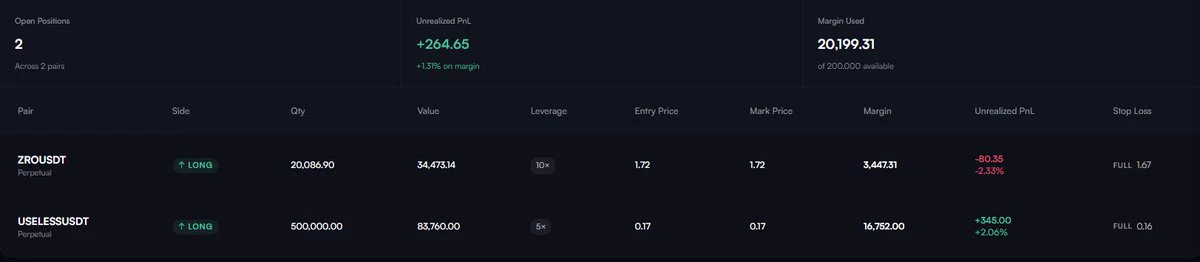
Took a long on $zro as well
sl: $1.6689
tp: $1.93
4.37R
0.5% Hyro risk.
*My Hyro trader discount code gives a 15% discount until October 31st.
post-image
ZRO-2.59%
Load More

Join 40 M users in our growing community

⚡️ Join 40 M users in the crypto craze discussion

💬 Engage with your favorite top creators

👍 See what interests you

Trending Topics

FedDecisionCountdown

26.27k Views1.22k Discussing

The Fed will announce its rate decision on October 28 at 18:00 (UTC), followed by a press conference at 18:30 (UTC). Markets widely expect rates to remain unchanged, with attention turning to future policy signals. Could this decision break crypto out of its trading range? What signals are you watching?

GateFirstToLaunchGoldCFD7X23Trading

37.41k Views6.34k Discussing

SKHynixQ3RevenueHitsRecordHigh

2.31k Views2.62k Discussing

View More