
Share your thoughts
placeholder
Article
Insiders are calling this range the setup that breaks short sellers

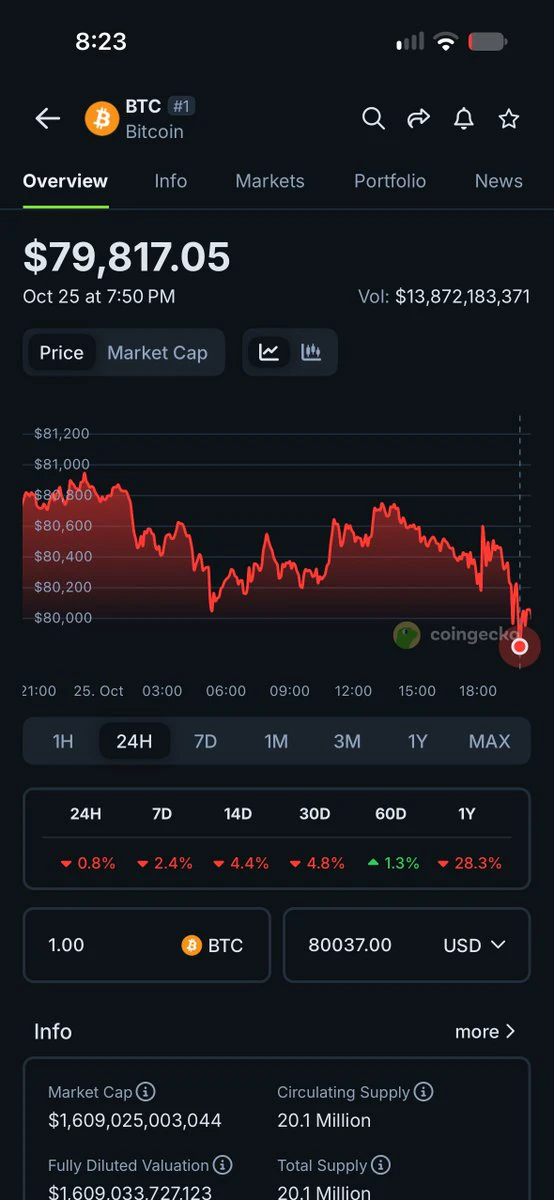
$BTC /USDT - SHORT

Trade Plan:
Entry: 79216.1 – 79363.5
SL: 79997.2
TP1: 78759.3
TP2: 78405.6
TP3: 77875.0

Why this setup?
Why now? The daily trend is range, so the market is coiled and waiting for a directional burst. The 1h ATR of 294.74 shows volatility is compressed enough for a sharp move, while the 15m RSI at 57.61 signals room to run lower before overbought. The entry zone sits at the 1h price of 79289.8, giving a precise fill, with TP1 at 78759.3 and TP2 at 78405.6 as the first two targets on the short side. The
BTC-1.06%
$ZEC Bro, you’re freaking amazing—did you really stop me out here? Set the stop-loss wider next time! For this position, I took 25% profit at 1140 and closed the entire position at 1111. I went to sleep thinking I’d wake up to a nice payout, only to find that it had hit my stop-loss right on the nose. You took me out with a 0.16 difference—I can only say, impressive. You came specifically to hunt me down... Set the stop-loss wider next time. That way, the risk-reward ratio will look better when we land a big result. What do a few U matter compared with the final big result? This trade offered
post-image
ZEC-4.64%
  • 4
>driving 1 mile to pick up groceries
>google maps:
post-image
After $LTC rallied, I didn’t exit my entire position. I took profit on 80% first and raised the protection level for the remaining position above breakeven. The quick pullback just now stopped out the remaining position, successfully locking in the profit.

The reason for entering was simple: after pulling back to the previous high on the hourly timeframe, the price did not continue lower. Instead, it reclaimed the area above the moving average on increased volume. This was a typical pullback confirmation. After going long, I set my stop-loss at the lower boundary of the small range.

After
post-image
LTC-0.61%
DOGE+0.72%
SNDK+1.34%
Market Alert

$XAU /USDT - SHORT

Trade Plan:
Entry: 4412.12 – 4417.04
SL: 4438.22
TP1: 4396.85
TP2: 4385.03
TP3: 4367.30

Why this setup?
Technical setup found.

Debate:
Thoughts?

⚠️ Personal market analysis only. NFA — manage risk and DYOR.
Educational content, not investment advice or a recommendation to buy, sell, deposit, or withdraw any asset. No paid promotion or referral/affiliate links.
XAU-0.17%
Everyone is about to get burned on $LAB /USDT.

$LAB /USDT - SHORT

Trade Plan:
Entry: 0.0697 – 0.0701
SL: 0.0716
TP1: 0.0686
TP2: 0.0677
TP3: 0.0664

Why this setup?
Why now? The 1d trend is bearish and the 4h setup is confirming it with 95% confidence, so the deck is stacked for more downside. The 1h price is sitting at 0.0699, right inside the entry zone of 0.0697 to 0.0701, giving us a clean trigger. The 15m RSI at 50.9 shows the market is neutralizing, not recovering, which means the short can hold. Meanwhile the 1h ATR of 0.000729 tells us the next leg should move the price from the e
LAB-2.01%
Market Alert

$DOGE /USDT - SHORT

Trade Plan:
Entry: 0.09038 – 0.09088
SL: 0.09298
TP1: 0.08886
TP2: 0.08769
TP3: 0.08592

Why this setup?
Technical setup found.

Debate:
Thoughts?

⚠️ Personal market analysis only. NFA — manage risk and DYOR.
Educational content, not investment advice or a recommendation to buy, sell, deposit, or withdraw any asset. No paid promotion or referral/affiliate links.
DOGE+0.72%
morning update 🥰🌹
live-cover
LIVE1,891
I was just about to go rant on the forum, but then I checked my balance—forget it, the market is always right.😌
A few days ago, I took one last look before bed. $SOL retraced to 84.84, but not only did it hold the level, the rebound grew stronger each time. I placed an order on the side, thinking the worst-case scenario would be getting stopped out. I didn’t expect to wake up and find the price had gone straight to 103.65.
The unrealized profit is now +2062.43%. Although I didn’t catch the entire move with a full position, I did hold on to the most comfortable part of the launch. Getting the
post-image
SOL-1.91%
SNDK+1.34%
LAB-2.01%
Nobody is talking about the quiet SYMBOL move that has ripe shorts positioned right now

$MU /USDT - SHORT

Trade Plan:
Entry: 1029.64 – 1031.68
SL: 1040.46
TP1: 1023.31
TP2: 1018.41
TP3: 1011.06

Why this setup?


Debate:
Are we testing TP2 at 1018.41 or is the range about to trap the shorts with a fake move back above 1031.68?

⚠️ Personal market analysis only. NFA — manage risk and DYOR.
Educational content, not investment advice or a recommendation to buy, sell, deposit, or withdraw any asset. No paid promotion or referral/affiliate links.
MU+2.04%
This was purely because market sentiment was good—the market casually tossed out a few gold coins, and one just happened to hit me on the head.

During the repeated intraday swings, I saw that $AERO had held its key level and that buy orders were still sitting at the bottom, so I went along with it and opened a long at 0.4598. The logic was straightforward: accept the loss if support broke, and let it choose its own direction if support held.

Taking another look just now, the price has already pushed up to 0.618, with unrealized profit on the position at +2443.04%. This was a satisfying pie
post-image
AERO+17.09%
ETH-0.78%
SNDK+1.34%
I had just switched the app to the background, and it shot up in an instant—it’s playing hide-and-seek with me.
During the repeated intraday swings, $ASTER /ASTER hovered around 0.6658 for nearly two hours without breaking out. The bottoming range was this stable, so funds had already quietly entered; the volume clearly showed accumulation, not distribution. Decisively went long and got on board, leaving the rest to the price action.
Don’t lose your patience in the range, then try to regain your dignity in a one-way move.
Now 0.7717 has given the answer directly, with +1129.39% secured. The tim
post-image
ASTER-1.11%
SNDK+1.34%
ADA-1.03%
hot Topics updates
live-cover
LIVE1,300
Market Alert

$SUI /USDT - SHORT

Trade Plan:
Entry: 0.811 – 0.819
SL: 0.850
TP1: 0.789
TP2: 0.772
TP3: 0.746

Why this setup?
Technical setup found.

Debate:
Thoughts?

⚠️ Personal market analysis only. NFA — manage risk and DYOR.
Educational content, not investment advice or a recommendation to buy, sell, deposit, or withdraw any asset. No paid promotion or referral/affiliate links.
SUI+1.78%
9.08 ETH Analysis
Analysis: Go long on a pullback to around 2450–2460, with defense at 2430; first target 2490, second target 2515
On the 1H ETH chart, the price came under pressure and pulled back after surging to the phase high of 2536.00, with the low reaching 2464.62. It is currently in a consolidation phase following the high-level pullback.
The short-term MA7 and MA30 are flattening and edging slightly downward. The price is trading below the moving averages, which are creating overhead resistance. After the continuous decline, bearish momentum is gradually being depleted. 2450–2460 is t
post-image
ETH-0.89%
The $SNDK long was a bit of a grind to hold, with one dip in between sweeping out quite a few short chasers and coming just a few points from my protective stop. I didn’t manually cut it at the time because the four-hour structure had not yet broken.
I entered based on a double bottom on the hourly chart. After the right-side breakout, it retested the prior-high neckline and held firm, so I went long after confirmation. The entry wasn’t particularly cheap, but the stop was very close—an attempt to use limited risk to capture a trend continuation.
After it rallied into the target zone, I manage
post-image
SNDK+1.34%
BTC-1.06%
ZEC-4.64%
In the early session, the price pulled back to around 828.40 and stabilized, so I went long directly. The plan is simple: as long as the hourly candle body does not break the level, the upside target is the high-volume trading zone, with the stop-loss placed at the same time.

After entering, the price consolidated for a short while, with one wick in between, but I did not adjust the position. Once the hourly chart closed bullish again and pushed upward on increased volume, I took 70% off at the first target and moved the stop-loss on the remaining position directly above the breakeven level.
post-image
ADA-1.03%
SNDK+1.34%
9.8 Gold Morning Review

Yesterday at midnight, support was correctly anticipated to hold, and the market maintained range-bound movement. The pace aligned with expectations from the analysis, with the current gold price around 4411.

Technical analysis: The 1-hour Bollinger Bands continue to narrow and flatten, with the gold price oscillating around the middle band; the 30-minute Bollinger Bands are narrowing, the KDJ indicator is turning downward, short-term rebound momentum is weakening, and the market has entered range consolidation. The bearish structure on the larger time frame remains
post-image
GLDX-0.06%
Scumbag’s Live Trade: SK hynix
Opening a position now,
Direction: long, 1369
Stop-loss, 1320
First take-profit, 1426
Second take-profit, 1550
The idea is to trade the breakout from the range and see whether it can reach the 0.5 and 0.618 Fibonacci levels.
The stop-loss is set near the upper boundary of the range. Since this is a long chase, a pullback is possible, as is the possibility that the morning surge was a false breakout.
post-image
Load More

Join 40 M users in our growing community

⚡️ Join 40 M users in the crypto craze discussion

💬 Engage with your favorite top creators

👍 See what interests you

View More