Share your thoughts
placeholder
Article
This is troublesome now—all the major events have been crammed into next week.
If the clear proposal fails to pass, and the Fed raises interest rates, with Japan following suit,
if several bearish factors erupt all at once, how badly will Bitcoin fall?
$BTC After this upward wick, all the liquidity above that needed to be swept has been swept, and it is time to take the liquidity below. It has also been consolidating at the top for more than half a month, so there is really no possibility of breaking above 83000 in the short term.
A breakout and reclaim of 77730 could support a short-term bull
post-image
BTC+0.17%
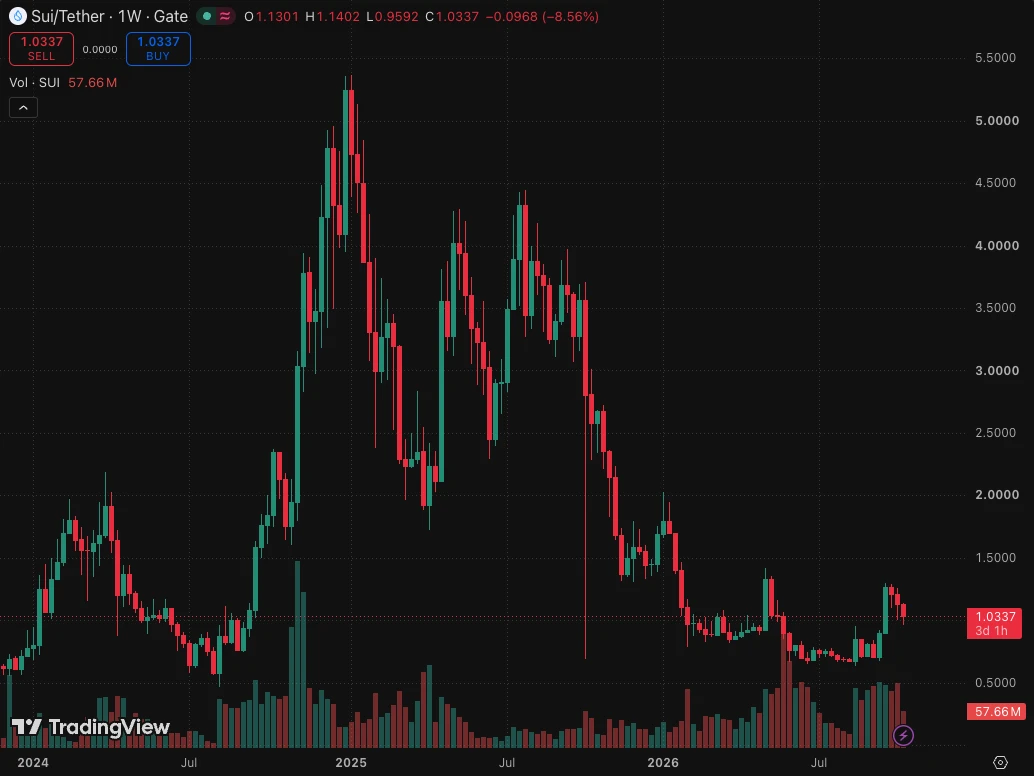
$SUI 4Hr Chart Analysis 👀
$SUI is looking bullish here it is likely a VERY good time to be accumulating more $SUI.
Its back in the high demand zone for accumulation.
The green falling wedge has broken out to the upside as it should. Falling wedges break upwards 68% of the time. The bullish retest of the breakout is currently in progress.
Then there is a pink Adam & Eve Double bottom reversal formation. This pattern is a strong downtrend reversal signal. The trigger line has been tested 2 times already. Next text will likely result in a breakout to the upside.
Price is just below the yellow 4h
post-image
SUI-0.56%
I just casually hit refresh, and it went up on its own, leaving me in a pretty passive position. When I checked the chart after lunch, $ZEC had already shot up to 1105.41, while my cost was still sitting at 857.01—who wouldn’t be momentarily stunned seeing that.
Looking back, this move wasn’t purely luck. It had been moving sideways at the bottom for so long, and funds stepped in to buy every pullback, which is why I took a bullish stance at the time. With unrealized gains now at +2057.32%, it definitely feels good.
That said, I’m definitely not holding this move forever. I’ll take profits on
post-image
ZEC-2.50%
ADA+0.10%
BNB-0.67%
[New Streamer] Market Prediction
live-cover
LIVE50
Antisemitism never died in Europe.
post-image
LDO pump pump bigpump ath go
post-image
LDO-1.36%
BIGPUMP0.00%
#晒出我的持仓收益 has already taken profit on half.
0.87 was just a tiny bit short.
post-image
#Web3SecurityGuide
Web3 security in 2026 is no longer just a question of whether a smart contract has been audited. The bigger question is much closer to the user: who controls the wallet, who can access the signing authority, and what exactly is being approved? CertiK recorded 344 crypto security incidents in the first half of 2026, with total losses reaching approximately $1.315 billion. That number makes one point very clear: security failures are still happening at a scale where a single careless signature, compromised credential, or stolen key can become extremely expensive.
The wallet d
post-image
The stop-loss I nervously canceled a few days ago looks, in hindsight today, like it saved my life.

A few days ago in the afternoon, $SNDK ’s rebound lacked momentum. Every upward push fell just short, volume failed to follow, and the resistance above was obvious. I judged it to have strong bull-trap vibes, so I kept holding the short. From 1651.77 to 1583.46, +293.48% gave us the answer. It really dragged at first, but once it moved, it felt great. Those on board should be waking up laughing.

Close 80% first, and protect the remaining 20% at breakeven. If it continues to sell off, let the
post-image
SNDK-3.80%
BNB-0.67%
LAB+5.11%
$1000 to $100,000 Crypto Trade Challenge Today
live-cover
LIVE573
#WeeklyShare
Solana has slipped below the psychologically important $100 level, with SOL/USDT trading around $99.99, down 1.59% over the last 24 hours, according to Gate market data.
The move is small on a percentage basis, but the $100 level matters technically and psychologically. Once a major round-number support is lost, traders usually start watching whether price can quickly reclaim it or whether the level turns into resistance.
The first signal to watch is $99–$100. If buyers defend this area and SOL moves back above $100 with stronger volume, the breakdown could prove to be only a sho
post-image
SOL-0.34%
I’m watching $SOL for a short here.
SOL has recovered nicely from $99.42, but the bounce is now running into the $101.2–$101.5 area. Price still has resistance overhead, so I’m watching for sellers to step back in around here.
Entry: $101.15–$101.45
Targets:
TP1: $100.75
TP2: $100.20
TP3: $99.55
Stop: $101.80
For me, $101.5–$101.8 is the key zone. Staying below it keeps the short setup interesting. A strong reclaim above $101.8 would make me step aside.
#CoinDeskRevealsGateRWAPerpetualsTop3Globally #AugustCoreCPIBeatsExpectations
post-image
SOL-0.34%
  • 5
  • 1
I came up with a riddle, and surprisingly, no one has guessed it correctly so far?
【Enjoy the moon together and make friends through literature】Guess a Chinese character.
Is it difficult?
post-image
Solana (SOL) Technical Outlook: SOL Holds Above $100 as Bulls Target Higher Resistance
SOL is currently trading around $101.25, consolidating above the psychological $100 level after a strong recovery from the June lows.
The broader structure is showing signs of improvement, with SOL now trading above all four major EMAs. However, price is facing a significant resistance cluster around $102.29–$104.64. Bulls need a clean breakout above this zone to open the path toward the $107–$109 area and the $129.49 Fibonacci resistance.
📈 EMA Structure
20 EMA: $99.76
50 EMA: $92.04
100 EMA: $87.25
200 EM
SOL-0.34%
🍎 #AppleiOS27$AAPL : A Major Software Update Arrives
Apple is preparing to roll out iOS 27, its major software update for iPhone users, with the release scheduled for September 14, 2026. The update comes shortly after Apple’s latest product event, where the company introduced the iPhone 18 Pro lineup and its first foldable iPhone.
📱 A New Software Cycle for Apple
While new hardware often receives the most attention, Apple's software ecosystem remains one of the company’s strongest competitive advantages. iOS connects the iPhone with services, applications, accessories, security features, and
post-image
Apple
Will Apple release iPhone 18 in 2026?
Yes 100%
No 0.05%
AAPL+1.71%
Is it a motor...😂😁
post-image
XRP is range bound, but one number says short is the only play that matters.

$XRP /USDT - SHORT

Trade Plan:
Entry: 1.352 – 1.356
SL: 1.372
TP1: 1.341
TP2: 1.332
TP3: 1.319

Why this setup?
Why now? The 1h price sits at 1.354, which is also the entry reference, and the daily trend is range, meaning the move has to come from within a tight band. The 15m RSI at 58.22 shows the asset is not overbought yet, so a short bias still has room to breathe. The 1h ATR of 0.007382 confirms the 1h candles are printing enough volatility to push from the entry zone toward TP1 at 1.341 and TP2 at 1.332. Th
XRP-0.62%
Why is the 1h ATR narrowing just as the daily trend turns range-bound?

$WLD /USDT - SHORT

Trade Plan:
Entry: 0.3939 – 0.3959
SL: 0.4047
TP1: 0.3876
TP2: 0.3827
TP3: 0.3754

Why this setup?
Why now? The 1h price is hovering near 0.3949, which is the exact entry_ref for a short setup inside the 0.3939 to 0.3959 zone, and the 1d trend being range means momentum is exhausted after a prolonged move. The 15m RSI at 52.3 shows neither overbought nor oversold, so the market is coiling for a directional break. The 1h ATR of 0.00407 confirms that volatility is still contained, making the TP1 target
WLD-3.16%
REZ was 0.0040 yesterday and 0.0048 today. Restaking tokens have been in the green for two consecutive days, while ETH has not surged in tandem, indicating a catch-up rally among second-tier assets.
$REZ
post-image
REZ+16.99%
Load More

Join 40 M users in our growing community

⚡️ Join 40 M users in the crypto craze discussion

💬 Engage with your favorite top creators

👍 See what interests you