Share your thoughts
placeholder
Article
How is this a rebound? This is CPR for my account, isn’t it? $DELL It just hit 522.17, with +727.91% in the bag. I stared at the screen for several seconds to make sure I was looking at the right account.
When I opened the market this morning, buying pressure was clearly getting stronger, and each pullback was becoming smaller. It was obviously not an ordinary dead-cat bounce. Around 453.65, I said it plainly: the risk-reward here was good enough—take the loss if wrong, and if right, it would be a big win.
Looking back now, the timing was perfect. Here’s the position update: I took 75% off the
post-image
DELL+1.53%
SNDK+11.82%
BTC-2.01%
No execution, no analysis—just sheer luck. Even saying these results out loud feels embarrassing. During the intraday plunge, $SHEIN actually made plenty of fake moves, but I focused on just one thing: low trading volume, a weak rebound, and no buyers on the way up—that’s a breeding ground for bears. When it bounced back to 6.624, I entered a short position without hesitation.

Now? 4.943, +251.69%. It really dragged at first, but the result feels great.

Even if you only catch one wave, as long as you can take the profit with you, it’s yours; no matter how much floating P&L there is, that b
post-image
SHEIN-8.28%
LAB+0.98%
BNB-0.59%
#USELESSSurgesAnother67%
$USELESS IS MOVING INTO A NEW MOMENTUM ZONE 🚀
USELESS has taken another major step higher, with the token now trading around $0.26 after an explosive run that has completely changed its short-term market structure.
What makes this move interesting is not simply the percentage gain. It is the speed at which USELESS has transitioned from a relatively quiet setup into a high-volume momentum market. Buyers have continued stepping in aggressively, pushing price through previous resistance areas and now placing $0.25 firmly in the spotlight.
The big question is no longer w
USELESS+27.68%
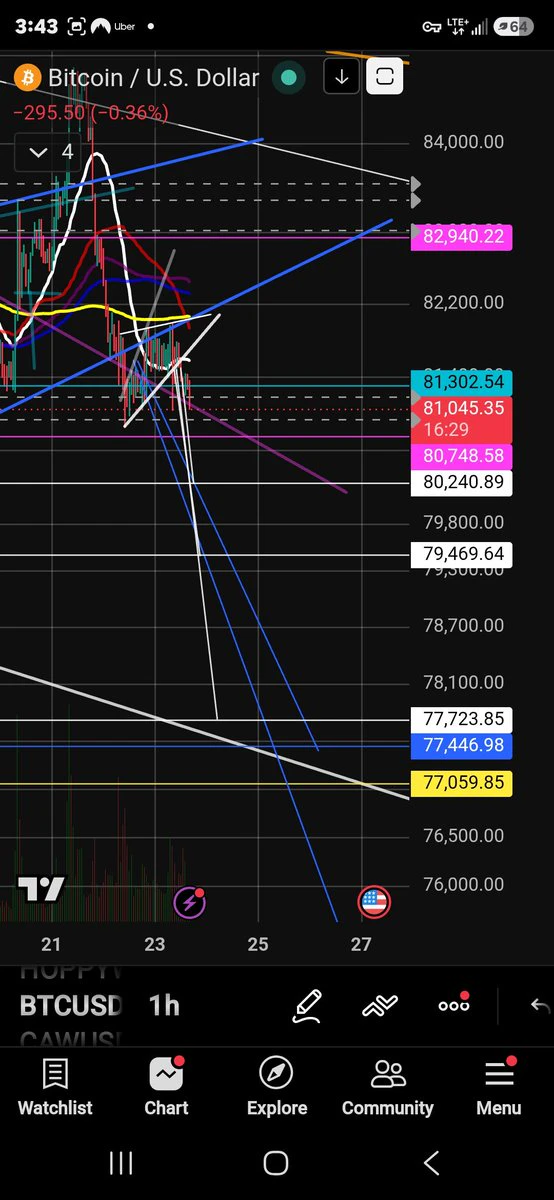
A deeper correction sub 58k would be a movie 🍿📺
$BTC
post-image
BTC-2.03%
  • 2
$DASH Signal】1H volume breakout, long attack
$DASH 1H volume breakout above 59.89, with the current price at 59.09 hugging the upper Bollinger Band. RSI at 80.92 is in the overbought zone, while the MACD histogram is expanding. Sell orders are stacked heavily on the order book, with a buy ratio of 0.64, but the price is holding firm at the top. The 4H Bollinger Bands are opening, with EMA20/50 in a bullish alignment. The funding rate is 0.01%, keeping the cost of going long low.
🎯 Direction: Long
⚡ Entry: 58.9127 - 59.0900
🛑 Stop-loss: 56.1355
🚀 Target 1: 63.5218
🚀 Target 2: 65.7376
🛡️
post-image
DASH+31.92%
BTC-2.03%
ETH-2.16%
SOL-1.89%
Everyone’s staring at DOGE’s breakout—but the 4H clock just flipped against the crowd.

$DOGE /USDT - SHORT

Trade Plan:
Entry: 0.08454 – 0.08496
SL: 0.08672
TP1: 0.08327
TP2: 0.08228
TP3: 0.08080

Why this setup?
Why now? The 1D is a boring range, yet the 4H bias is SHORT (55% confident). RSI on the 15m is at 44.8—not oversold, just weak. Price is hovering at 0.08475, but the real tell is the invalidation line at 0.08548. If we lose 0.08454, the path to TP1 (0.08327) is a straight shot. The ATR (0.000822) says volatility is coiling—this isn’t a dip; it’s a pre-breakdown squat.

Debate:
Wi
DOGE-3.44%
When I was checking the charts after lunch, the price action felt off. When $CTR plunged in the morning session, I stared at the chart for a long while—the buying support was too weak. Every rebound was just feeding fuel to the bears; not shorting this setup would have been doing myself a disservice.
And the result? The short entered at 0.02063 has now dropped to 0.00986, bringing in a juicy +1026.01% profit. It feels so good—the market practically insisted on feeding me, and I simply opened my mouth and took it.
Operationally, 70% of the position has already been taken in profit, while the st
post-image
CTR-2.08%
LAB+0.98%
DOGE-3.44%
Who is actually buying this shit and why?
post-image
PARABOLIC SEASON LOADING 🚀🚀
BE READY🤯🤯
#shillb#crypto
post-image
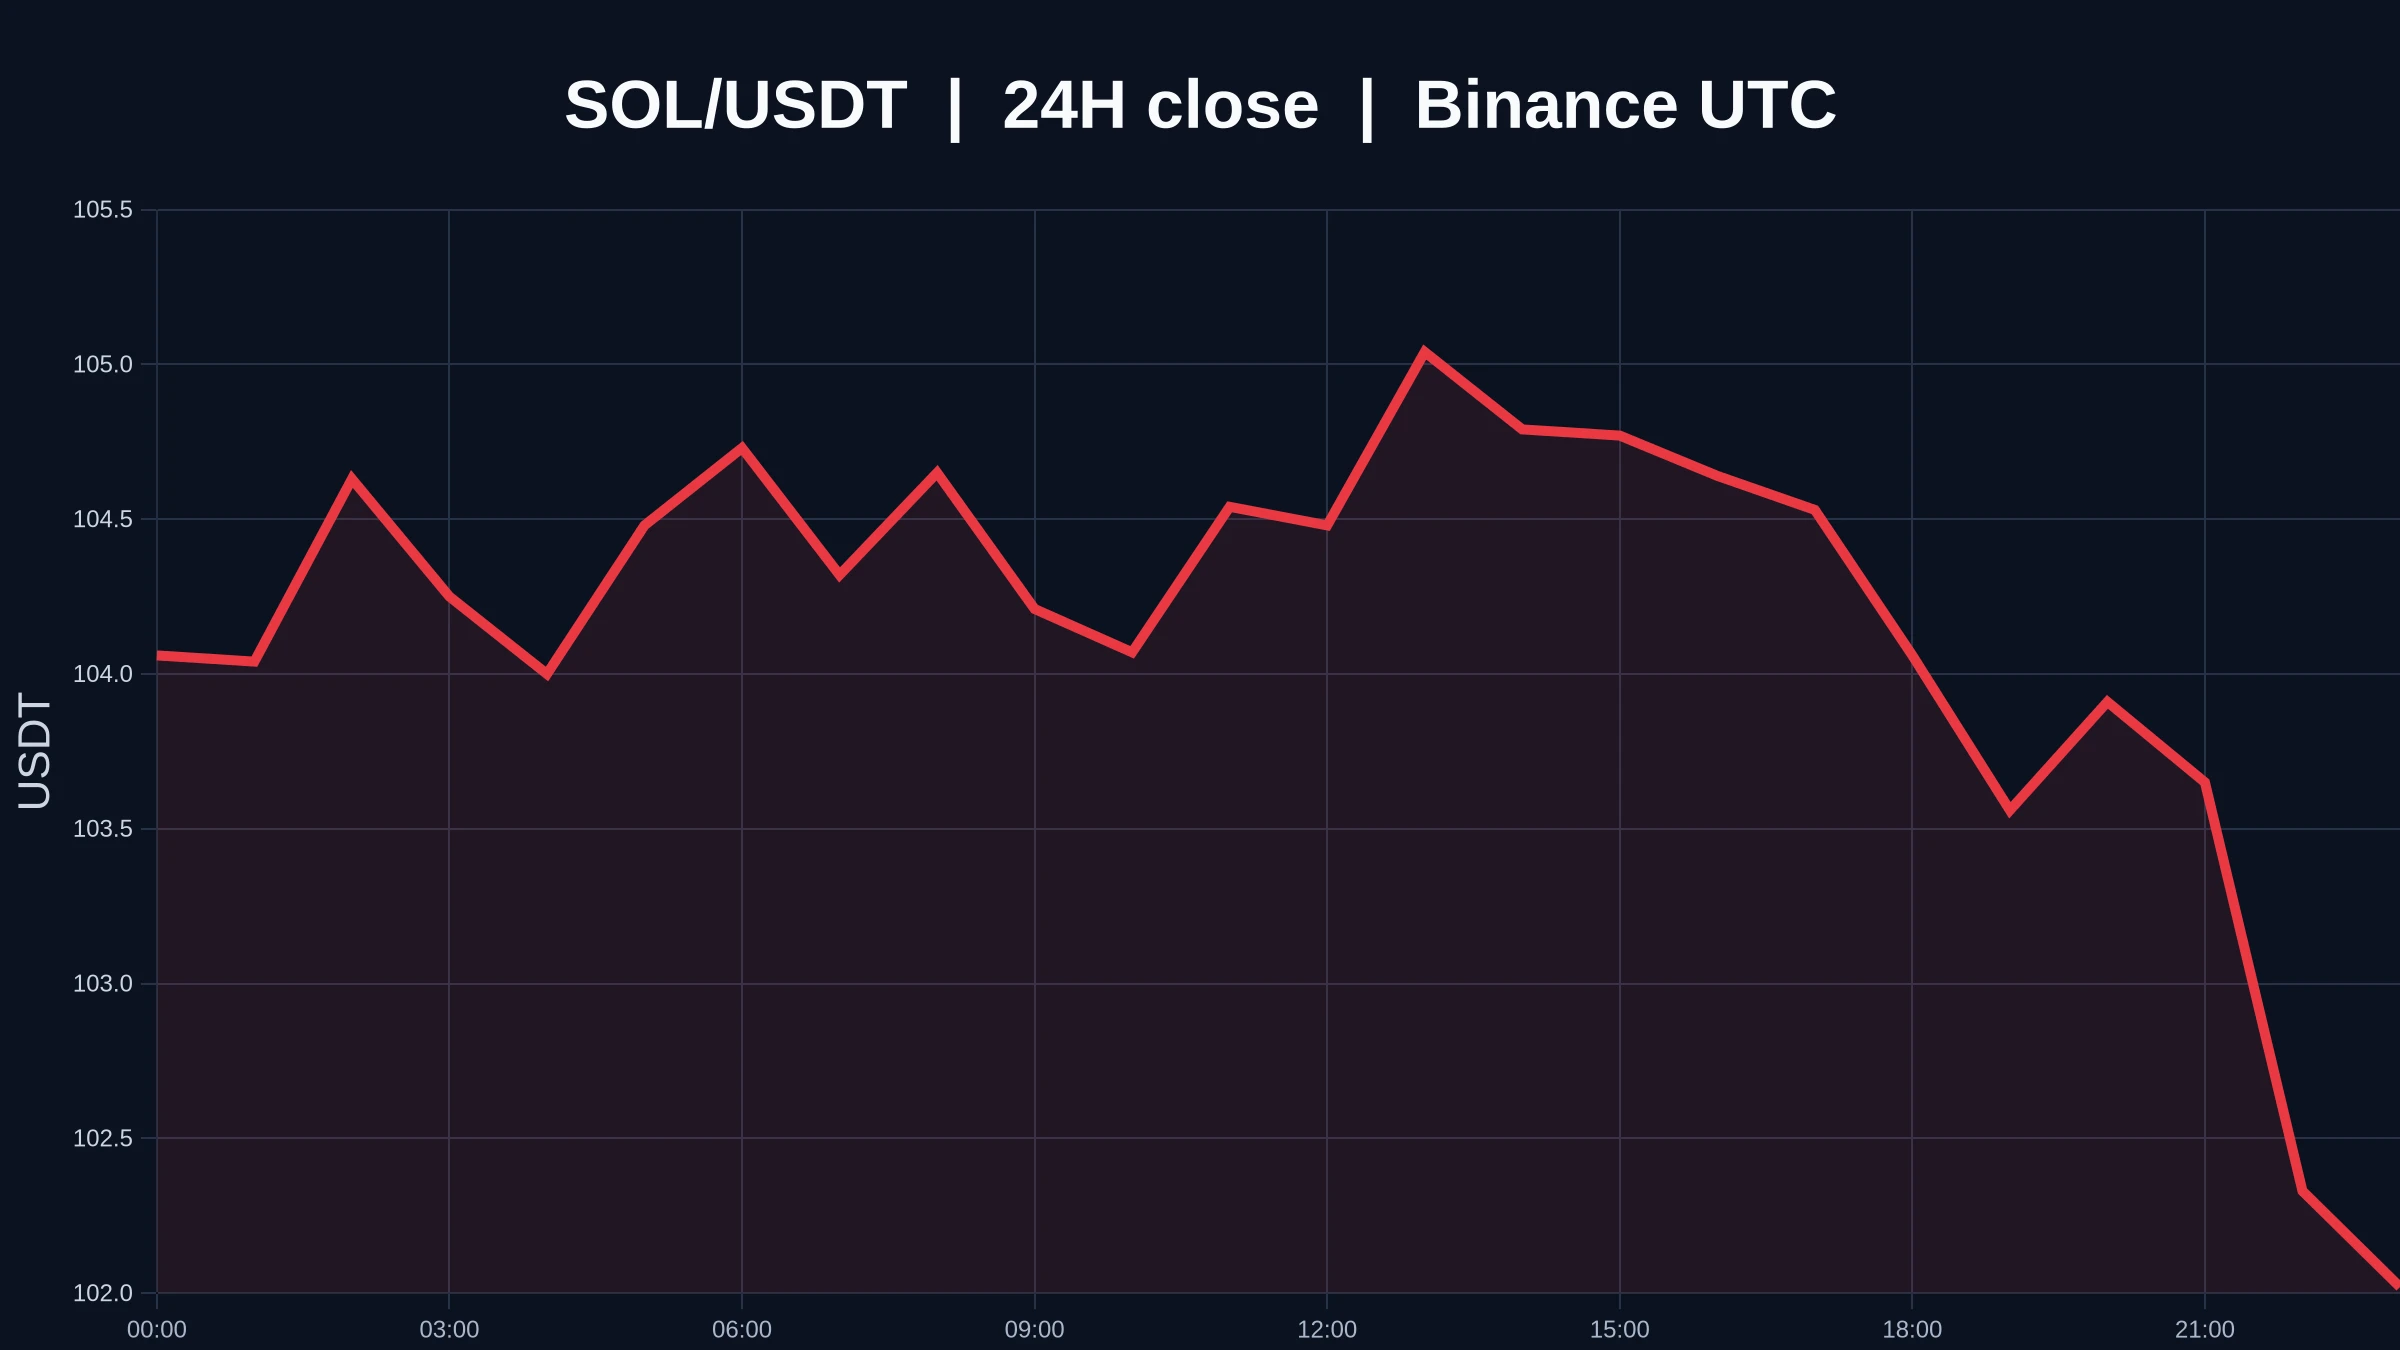
Most traders are buying $SOL /USDT at 101.63 right now—but the 4h chart just whispered a secret they can't hear.

$SOL /USDT - SHORT

Trade Plan:
Entry: 101.40 – 101.86
SL: 103.80
TP1: 100.00
TP2: 98.92
TP3: 97.29

Why this setup?
- RSI 15m at 48 shows zero momentum push; we're in the dead zone.
- ATR 1h (0.90) is thin—this is a coiled spring, not a breakout.
- 1D trend is *range*: no fuel for longs, but TP1 at 100.00 is a magnet.
- Why now? Entry 101.63 sits under 102.37 invalidation—one rejection and we slide to 98.92 fast.

Debate:
If price taps 101.86 first, do you short the fake
SOL-1.92%
A few days ago, the hand that set the stop-loss trembled slightly. This morning, I realized that was unnecessary filial devotion.

A few days ago before bed, $LINK was still moving sideways at the bottom, testing my patience, but I took a look and saw it hadn’t broken down, so all was well. I entered at 9.352 then.

This morning, I saw 11.613, with a return of +1715.16%. Staying up wasn’t for nothing—I finally got a bite of this meat 😌. Managing risk in advance is called rationality; cutting after taking losses is called a heroic last stand.

Take 80% off the table first, and move the sto
post-image
LINK-1.56%
LAB+0.98%
ZEC+7.58%
【Price Trend Analysis】
1. Candlestick Patterns:
* 4-hour chart: A massive bearish candle appeared at 20:00 on September 4, followed by two candlesticks fluctuating at low levels. The current candlestick’s closing price is near its low, indicating that bearish forces are dominant.
* Daily chart: A bearish candle with long upper and lower shadows closed on September 4. Its body was relatively large, the closing price was below the opening price and the previous day’s closing price, indicating that bulls encountered strong selling pressure after pushing toward the high.
2. Technical Indicator
ETH-2.13%
BTC-2.01%
  • 1
market update
live-cover
LIVE81
$PUMP I’m bullish. Whales’ long-to-short ratio is 2.59 times that of retail traders, and the gap is right there—the price is 0.00421, down 23% from the 90-day high, yet retail traders are still desperately piling into short positions while whales are taking the opposite side and going long. The $93.0M in futures open interest also shows that the positions haven’t dispersed; this isn’t an abandoned market. Over the next 24 hours, I expect a bullish, consolidating range with limited downside, looking more like a gradual grind designed to wear down retail shorts. The 2.59x gap is right there, and
post-image
PUMP-1.90%
Why is $CL /USDT quietly sliding while everyone watches the wrong timeframe?

$CL /USDT - SHORT

Trade Plan:
Entry: 90.61 – 90.95
SL: 92.37
TP1: 89.59
TP2: 88.79
TP3: 87.60

Why this setup?
- 4H bias flips SHORT with 55% confidence—not a screaming sell, but a tactical fade.
- Price sits at 90.78, hugging the 1H pivot; RSI 15m at 46.95 shows zero momentum to the upside.
- ATR 1H (0.66) confirms a tight coil—compression precedes expansion.
- Target ladder: 89.59 → 88.79 → 87.60. Invalidation only if 88.47 cracks (trend1D remains "range," so this is a scalp, not a trend trade).
**Why n
CL-0.69%
Crypto Prediction and Trading Insights
live-cover
LIVE1,093
The biggest change at present is that BTC pulled back after rising back to around $82,000, while ETH failed to break above its previous high, indicating that ETH's short-term strength relative to BTC remains insufficient. On September 4, U.S. nonfarm payrolls added 162,000 jobs in August, significantly above expectations, while the unemployment rate was 4.1%; the strong employment data led the market to raise expectations for a September rate hike again, and the 2-year U.S. Treasury yield briefly rose to 4.38%.
Therefore, my current assessment of ETH is:
Short term: Range-bound with a bearish
BTC-2.03%
ETH-2.16%
CRYPTO THINGS YOU MAY HAVE MISSED — LAST 24 HOURS | 4 SEPTEMBER 2026
Institutions bought nearly $1B through crypto ETFs—yet bitcoin:native fell after one macro release.
That divergence matters.
🧵👇
1/3 — US JOBS CRUSHED EXPECTATIONS
August payrolls rose 162,000 versus 56,000 expected. Unemployment held at 4.1%.
Markets lifted the probability of a September Fed hike to roughly 62%.
Higher-rate expectations strengthened the dollar, pushed yields higher and sent bitcoin:native down 2.3% to around $79,595.
Translation: liquidity remains more powerful than crypto-specific narratives. BLS | Reuters
post-image
BTC-2.35%
ETH-2.49%
HBAR-1.18%
XLM-2.57%
XDC-1.56%
BlackRock says rising government debt and weakening currency strength are driving Bitcoin's rally.
Bitcoin is up 23.4% over the past 30 days, but still down 8.9% year to date.
Meanwhile, gold is up 5.5% over 30 days and 3.5% year to date.
BLK-0.37%
BTC-2.03%
$PI Pi (π) is an irrational number, which means its decimal digits never end and never repeat in a specific pattern.
Mathematicians have calculated it to more than 100 trillion digits using supercomputers, but we are still far from "solving it," because it has no end.
For context, NASA uses only 15 digits of Pi for its most precise interplanetary calculations. Everything beyond that is purely mathematical curiosity, not a practical necessity.
Pi's infinite, patternless nature makes it a favorite symbol for concepts that resist simple boundaries, which is fitting given how often the crypto com
post-image
PI-1.65%
Load More

Join 40 M users in our growing community

⚡️ Join 40 M users in the crypto craze discussion

💬 Engage with your favorite top creators

👍 See what interests you

View More