Share your thoughts
placeholder
Article
The privacy sector is really strong this time. That day, after catching a wave of zec, I casually chased dash.
I took a look today when I had some free time. Even zen, with its Christmas tree structure, is pumping.
All I can say is, the market is really full of fomo.
$ZEC $DASH #美国8月非农超预期
ZEC+16.22%
DASH+0.22%
  • 10
  • 2
$$EPIC 15 minutes ago it was still sitting at 0.3657, and now it has shot straight up to 0.4440, with $21 million in 24-hour trading volume—this is no longer a rise; someone is grabbing tokens by the sack. If you didn't get in earlier, the risk of chasing higher and the anxiety of missing out are now fifty-fifty. Weigh it yourself.
Let's start with the projection: 0.4783 is today's high and also the resistance level. If this is a launch after a shakeout, a pullback that holds above 0.42 would be the best entry for the next leg; but if volume contracts and it breaks below 0.40, the trapped hold
EPIC+17.47%
Everyone’s staring at Bitcoin, but this 4h chart on ETH/USDT is quietly screaming something else.

ETH/USDT - SHORT

Trade Plan:
Entry: 2489.83 – 2496.05
SL: 2522.75
TP1: 2470.58
TP2: 2455.67
TP3: 2433.31

Why this setup?
Why now? The 1D trend is range-bound, but the 4h bias flips SHORT at 55% confidence. RSI on the 15m sits at 44.24—weak momentum, no bounce fuel. Entry zone 2492.94 with a tight ATR of 12.42 means volatility is compressed; the path of least resistance is down toward TP1 at 2470.58 and TP2 at 2455.67. The invalidation at 2467.53 is below TP2, so if we break that, the bear th
ETH+1.62%
Could buying a fleet of these cabs and operating them be a profitable business model? All you’d need is a garage and some maintenance. Thoughts?
post-image
Winners are always lonely! If you can't stand solitude, you can't enjoy your prime! $ZEC
ZEC+16.22%
  • 2
I originally wanted to sell at a loss to appease the heavens, but the ritual failed and the meat ended up cooking itself. As the price repeatedly swung around during the session, $ZEC was still hovering near 833.19. Watching that low-volume surge, I knew right away—the rebound was weak, support was insufficient, and there would be no one to catch it even if it pushed higher. This was clearly a bull trap with a strong whiff of deception.
At the time, I told the brothers to open longs without hesitation and not get lured in by that little rebound. Hold as long as the trend remains intact; run w
post-image
ZEC+16.22%
ETH+1.67%
DOGE+6.04%
$ZIVIDEND coded
Be early
It's already on FOMO 👇👇👇
post-image
#USELESSSurgesAnother67%
USELESS is currently trading near 0.25 after another sharp upward move that registered approximately 67 percent gains in a recent 24-hour window.
The token, a Solana-based meme coin, has shown repeated strength over the past week. Market data places the current price in the 0.248 to 0.252 range, with a market capitalization around 249 to 252 million dollars. Twenty-four-hour trading volume has remained elevated, frequently exceeding 140 to 150 million dollars on spot markets and significantly higher when futures volume is included. This level of activity indicates gen
post-image
Falcon_Official
#USELESSSurgesAnother67%
$USELESS
MOMENTUM IS STILL RUNNING
USELESS has once again become one of the most aggressive momentum stories in the market. After its explosive multi-day rally, the token is now trading around $0.22, following a powerful move that previously pushed price toward the $0.25–$0.28 region. The latest market data shows just how extreme the move has become: USELESS has gained roughly 250%+ over seven days, while 24-hour trading volume has expanded above $200M.
THE BIGGER PICTURE
What makes this setup interesting is that USELESS is not simply experiencing a one-candle pump. The rally has developed across several sessions, with price moving from roughly $0.06–$0.07 at the beginning of the recent acceleration toward the $0.20+ area. Recent daily data shows gains of approximately 31.8% on Aug. 31, 24.8% on Sept. 1, 9.7% on Sept. 2, and 68.1% on Sept. 3, followed by another strong session on Sept. 4.
$0.22 IS THE NEW BATTLEFIELD
At the current $0.22 area, the chart is entering a completely different phase. Buyers have already demonstrated extraordinary strength, but the question now is whether they can maintain that momentum after such a rapid expansion.
The first level I would watch is $0.25. This remains the major psychological barrier because it represents a clean round number and sits close to the recent high zone. A strong daily close above $0.25, supported by sustained volume, would strengthen the continuation setup.
UPSIDE LEVELS
If USELESS successfully reclaims and holds $0.25, the next area to watch would be approximately $0.258–$0.26. A clean break there could put $0.30 back into focus.
Above $0.30, the $0.31–$0.312 region becomes an important technical target. From $0.22, a move to $0.25 would represent roughly 13.6%, while $0.30 would require about 36.4% upside. Reaching $0.312 would mean approximately 41.8% from the current level.
BUT THE CHART IS EXTREMELY HOT
This is where traders need to separate trend strength from risk. USELESS has already moved several hundred percent in a very short period, and current market activity confirms that speculation is intense.
The latest 24-hour range has been extremely wide, with market data showing price moving between roughly $0.18 and $0.28. That means double-digit percentage swings can happen quickly, even without a major fundamental change.
After such a vertical rally, chasing every green candle becomes increasingly dangerous. A strong asset can continue higher, but the probability of sharp profit-taking also increases as early buyers lock in gains.
THE SUPPORT MAP HAS CHANGED
For me, the most important question is whether previous breakout areas can become support.
The first zone is $0.21–$0.20. Holding this region after the recent acceleration would be constructive because it would show that buyers are defending the new higher price structure.
Below that, I would watch $0.18–$0.176. This area becomes much more important if the current momentum starts cooling. A controlled retracement into this region would not automatically destroy the larger rally.
The next deeper zone is around $0.15. Losing that level with heavy volume would suggest that the market is moving from healthy consolidation into a much deeper correction.
VOLUME TELLS THE STORY
The volume expansion is one of the strongest parts of the current setup. Current market data places USELESS around $220M+ in 24-hour trading volume, showing that this rally is happening alongside substantial market participation rather than disappearing liquidity.
But volume needs to be interpreted together with price. If buyers continue producing higher highs while volume remains elevated, momentum can continue. If price repeatedly fails near $0.25–$0.26 while selling volume increases, that would be a very different signal.
THE OVERBOUGHT PROBLEM
Momentum indicators are another reason I would avoid blindly chasing the current move. Previous technical readings already showed RSI entering an extremely overbought area, while MACD and moving averages remained strongly bullish.
That combination tells an important story: the trend is strong, but the entry risk is also rising.
An overbought RSI does not automatically mean price must crash. In powerful momentum markets, RSI can remain elevated for longer than expected. The better signal is whether price starts losing support while momentum indicators roll over.
BULLISH SCENARIO
My bullish scenario is simple: USELESS holds $0.20–$0.21, buyers return with strong volume, and price reclaims $0.25 decisively.
If that happens, $0.26 becomes the first confirmation zone, followed by $0.30 and potentially $0.31–$0.312.
The key is not simply touching $0.25. I want to see acceptance above it rather than another temporary wick followed by immediate rejection.
BEARISH SCENARIO
The risk scenario starts if USELESS repeatedly fails around $0.25 and then loses $0.20 with strong selling pressure.
That could trigger a cooling phase toward $0.18, followed by the $0.15 area if sellers remain aggressive. Such a pullback would not necessarily erase the entire multi-week rally, but it would indicate that the parabolic phase is losing momentum.
MY CURRENT VIEW
At approximately $0.22, USELESS remains one of the strongest momentum charts to watch, but the setup has changed significantly from the beginning of the rally.
The data shows extraordinary seven-day performance, huge trading activity and a market that has already demonstrated its ability to move tens of percent in a single session.
For me, the three levels are clear:
$0.25 — breakout confirmation
$0.20–$0.21 — immediate support
$0.176–$0.18 — deeper trend support
Above $0.25 with strong volume, $0.26 → $0.30 → $0.31+ becomes the upside roadmap.
Below $0.20, I would become much more cautious and wait for the market to establish a new base.
USELESS is still bullish from a momentum perspective, but after a 250%+ seven-day rally, the biggest opportunity may no longer be predicting whether the next candle is green. The real test is whether buyers can convert the explosive move into a sustainable higher-price structure.
If $0.25 breaks and holds, $0.30 comes back into play. If $0.20 breaks, the market may need a serious cooldown first.
@Gate_Square
repost-content-media
USELESS-0.17%
  • 1
$IOST Signal】4H momentum continuation, 1H low-volume pullback
$IOST 4H RSI above 90, MACD bullish histogram expanding, with price consolidating at elevated levels after breaking above the upper Bollinger Band. 1H MACD histogram narrowing, bid depth share at 0.44, with sell orders clearly dominant. Funding rate 0.01%, OI stable, with no signs of a liquidation cascade for now. The current price of 0.0007782 is within the recommended entry range, while the 1H low at 0.00073 forms short-term support. Dense selling pressure is concentrated at 0.00079-0.00080 above.
🎯Direction: Long
⚡Entry/limit o
post-image
IOST+22.09%
Why is everyone still long SKYAI when the 4h chart is screaming the opposite?

$SKYAI /USDT - SHORT

Trade Plan:
Entry: 0.05904 – 0.05970
SL: 0.06254
TP1: 0.05699
TP2: 0.05541
TP3: 0.05303

Why this setup?
- 95% confidence on a SHORT setup while the daily trend is already bearish—this isn’t a guess, it’s a follow-through.
- RSI on the 15m sits at 39.4, meaning momentum is fading, not reversing.
- Entry zone at 0.05937 with TP1 at 0.05699 gives a clean 4% move before the real drop to 0.05541.
- The invalidation at 0.05863 is tight—if price reclaims that, the thesis dies fast. Why wait
post-image
SKYAI+1.07%
Why do you always “make small gains and suffer big losses” in crypto?
When prices rise, you can’t hold on; when they fall, you stubbornly hold on; you chase at the highest point and sell at the lowest point; you stare at the market every day until you’re exhausted, yet your account keeps shrinking.
The problem isn’t the market at all—it’s that you don’t have a trading system of your own.
September is about helping you sort this out:
How to use a small position for quick in-and-out short-term trades, how to switch between swing trading and mid- to long-term strategies with a medium-sized positi
post-image
BTC+0.17%
#RedBullTradingTourSeason6
Red Bull Trading Tour Season 6 is now live on Gate, marking the largest edition of this ongoing collaboration between Gate and Red Bull Racing. The event transforms regular crypto trading into a structured, multi-stage competition modeled after a Grand Prix, complete with qualifying rounds, themed city stages, and a final race.
Participants can compete either solo or by forming squads of three to five traders. Points are earned through a combination of trading volume, daily profitability, consecutive winning days, and team coordination. Every 1,000 units of eligible
post-image
GT+6.38%
#GateTops7DayNetInflowsGlobally
The global crypto market continues to evolve at a rapid pace, and seven-day net inflow data can provide an important window into where capital is moving across digital assets and trading platforms. The latest discussion around Gate’s seven-day net inflows globally highlights growing attention toward liquidity, user activity, market participation, and the broader flow of capital within the cryptocurrency ecosystem.
Net inflows are an important metric because they help indicate whether more capital is entering an ecosystem than le
post-image
BTC+0.17%
ETH+1.62%
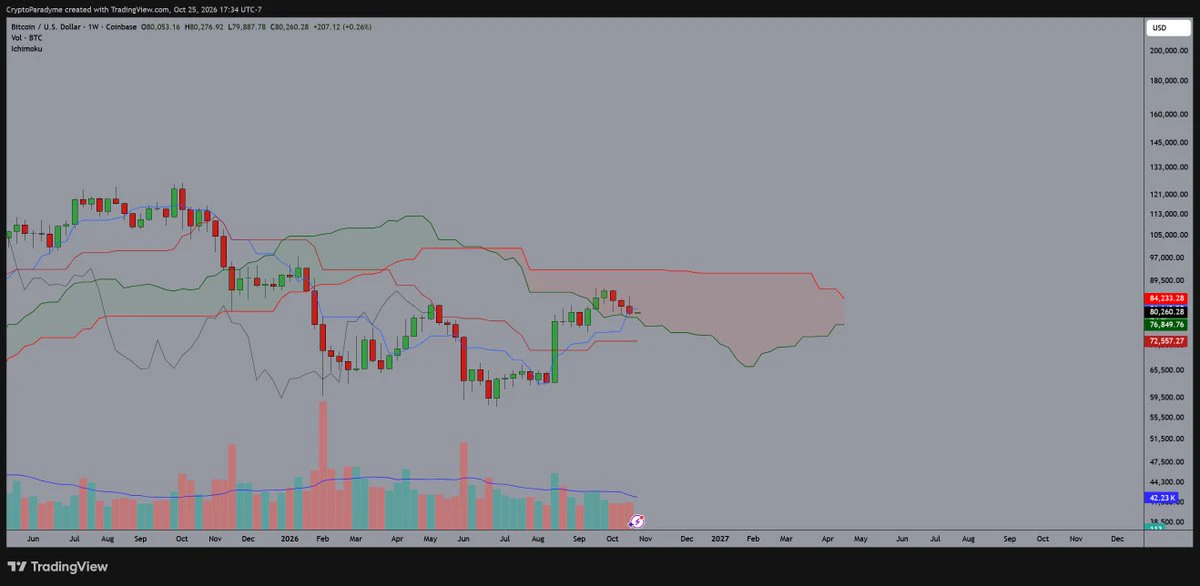
$BTC is holding above the 79,400–79,600 support/retest zone after the strong breakout. So far, the structure remains bullish, with buyers defending the breakout area.
📌 Trade Setup 🟢 LONG: 79,400 – 79,600
🎯 TP1: 80,500
🎯 TP2: 81,200
🎯 TP3: 82,000 – 82,800
🛑 SL: 78,460
As long as BTC holds the support zone, the bullish setup remains valid. A clean break above 81,500–82,000 could open the door for another push higher.
Still holding the BTC Long?
Drop a 🔥 if you're riding this move with us! 🚀
#GateTops7DayNetInflowsGlobally #BTCReclaims80K #Web3SecurityGuide
post-image
BTC+0.17%
market update
live-cover
LIVE953
BTC returns to $78,000! The market rebounds after finding suppor
live-cover
LIVE660
#USELESSSurgesAnother67% — Momentum Gets Serious
The crypto market has once again shown how quickly sentiment can change, and USELESS has become one of the most eye-catching names in the meme-coin sector. According to reports from September 4, the Solana-based meme coin gained another 67% in 24 hours, pushing its market capitalization to approximately $213 million, while 24-hour trading volume reached around $38 million.
What makes this move particularly interesting is that it did not happen in isolation. USELESS had already attracted significant attention earlier in the month, when it report
post-image
USELESS-0.17%
Everyone’s chasing gold—but $XAUT /USDT just flashed a 15m RSI of 29. Who’s buying this dip?

$XAUT /USDT - SHORT

Trade Plan:
Entry: 4419.8 – 4421.6
SL: 4429.7
TP1: 4413.9
TP2: 4409.4
TP3: 4402.6

Why this setup?
- 4h bias is SHORT (Conf 55), and 1D trend is *range*—not a breakout.
- Entry zone 4419.8–4421.6 sits right under rejection; TP1 at 4413.9 is the first magnet.
- RSI 15m oversold means a dead-cat bounce could fake you out—but the range top is capped at 4432 in the alt scenario.
- Why now? Price is mid-range with bearish pressure building; the 55% confidence says probability,
XAUT-0.15%
$ETH Signal】Long: 1H order book dominance + 4H momentum expansion
$ETH 1H order book dominance, buy/sell depth ratio 4.02, imbalance 60.19%. 1H MACD momentum is contracting, while 4H momentum is expanding; RSI 58 is not overbought. The 1H Bollinger upper band is 2520, and the 4H Bollinger upper band is 2544. Price is trading above the middle bands, with the two upper levels within reach.
🎯Direction: Long
⚡Entry: Snipe the current price at 2495.5; add to the position on a pullback to 2488.014
🛑Stop-loss: 2455.246
🚀Target 1: 2555.880
🚀Target 2: 2586.070
🛡️Trade management: - After reaching
post-image
ETH+1.67%
Everyone’s watching gold’s breakout—but the 4h chart just whispered a trap most will ignore.

$XAU /USDT - SHORT

Trade Plan:
Entry: 4431.56 – 4433.80
SL: 4443.44
TP1: 4424.61
TP2: 4419.23
TP3: 4411.16

Why this setup?
- $XAU /USDT is pinned at 4432.68 with a **SHORT bias** (55% confidence), yet the 1D is *range*, not momentum.
- RSI on 15m is **29.24**—oversold bounce fuel, but the 4h structure says fade it.
- TP1 at 4424.61 is only 0.18% away—quick, but TP3 at 4411.16 offers 0.48% if range breaks.
- Why now? The 1h ATR (4.48) is tight—compression precedes expansion, and the alt targ
XAU-0.13%
Load More

Join 40 M users in our growing community

⚡️ Join 40 M users in the crypto craze discussion

💬 Engage with your favorite top creators

👍 See what interests you

View More