Midan15

vip
Active for: 3.1y
Peak Tier 5
Market Analyst
Crypto analysis expert / market analysis / technical market analysis.
$SPCX XUSDT | The Reclaim Isn't Over Yet
SPCXX is trying to create a base following the fast decline from 146.45 to 130.51.
Since the lowest point of 130.51, the price has made its way up to 135.61. However, judging from the 4H timeframe, price action still seems to be more consolidative rather than having reversed up. The price is sitting near the 14-period moving average of 135.60. Meanwhile, the 28-period moving average of 136.51 and 28-period exponential moving average of 136.63 are above price.
This makes 136.50-136.65 an important price zone for decision making.
What I'm watching currentl
post-image
SPCX+6.05%
What's most interesting with BTCUSDT now is not the bounce itself but the reaction coming after the spike to $79.3K.
Currently trading at $76.9K, the cryptocurrency gained 1.8% in the last 24 hours, with the daily range between $76.53K and $78.80K (about 3%) and daily spot turnover of about $42.5B.
Even with the recent pullback, the setup remains positive. The price rose from around the $64K level to $79.3K over several sessions, but rejection above $79K and a retreat to $76.5K means that buyers should prove their ability to take the additional supply.
This idea is supported by the following m
post-image
BTC+0.66%
Gold is doing something interesting at the moment, and I want to explain exactly what is happening.

XAUTUSDT has jumped to 4,522.20, and the increase is not significant in itself with the additional 1.12%. However, the most interesting aspect is that we have seen consolidation against the level of 4,473.45, which repelled several price attempts. Now, the pair is holding above it.

First, let’s look at the current situation and see what the most important facts and details are.

The first obvious observation is today’s range. The asset has reacted very well after the test of the 4,433.40
post-image
XAUT-0.27%
$AAVE USDT looks good here, but the chart is suggesting otherwise with a potential risk of price staying tight and thin

.

$SAVE chart analysis: range pressure, but participation is light.

Asset

$SAVE :

Price: ~$0.1531

24H: ~+0.1%

24H High: ~$0.1549

24H Low: ~$0.1524

7D Range: ~$0.1508-$0.1549

24H Volume: ~$292.6

1H Market Structure

The short-term structure for SAVE has been generally range-bound, with the asset consolidating around ~$0.1508-$0.1524 and testing the top of the range at ~$0.1549 several times for the last 24 hours without a confirmed breakout. M
post-image
AAVE-2.26%
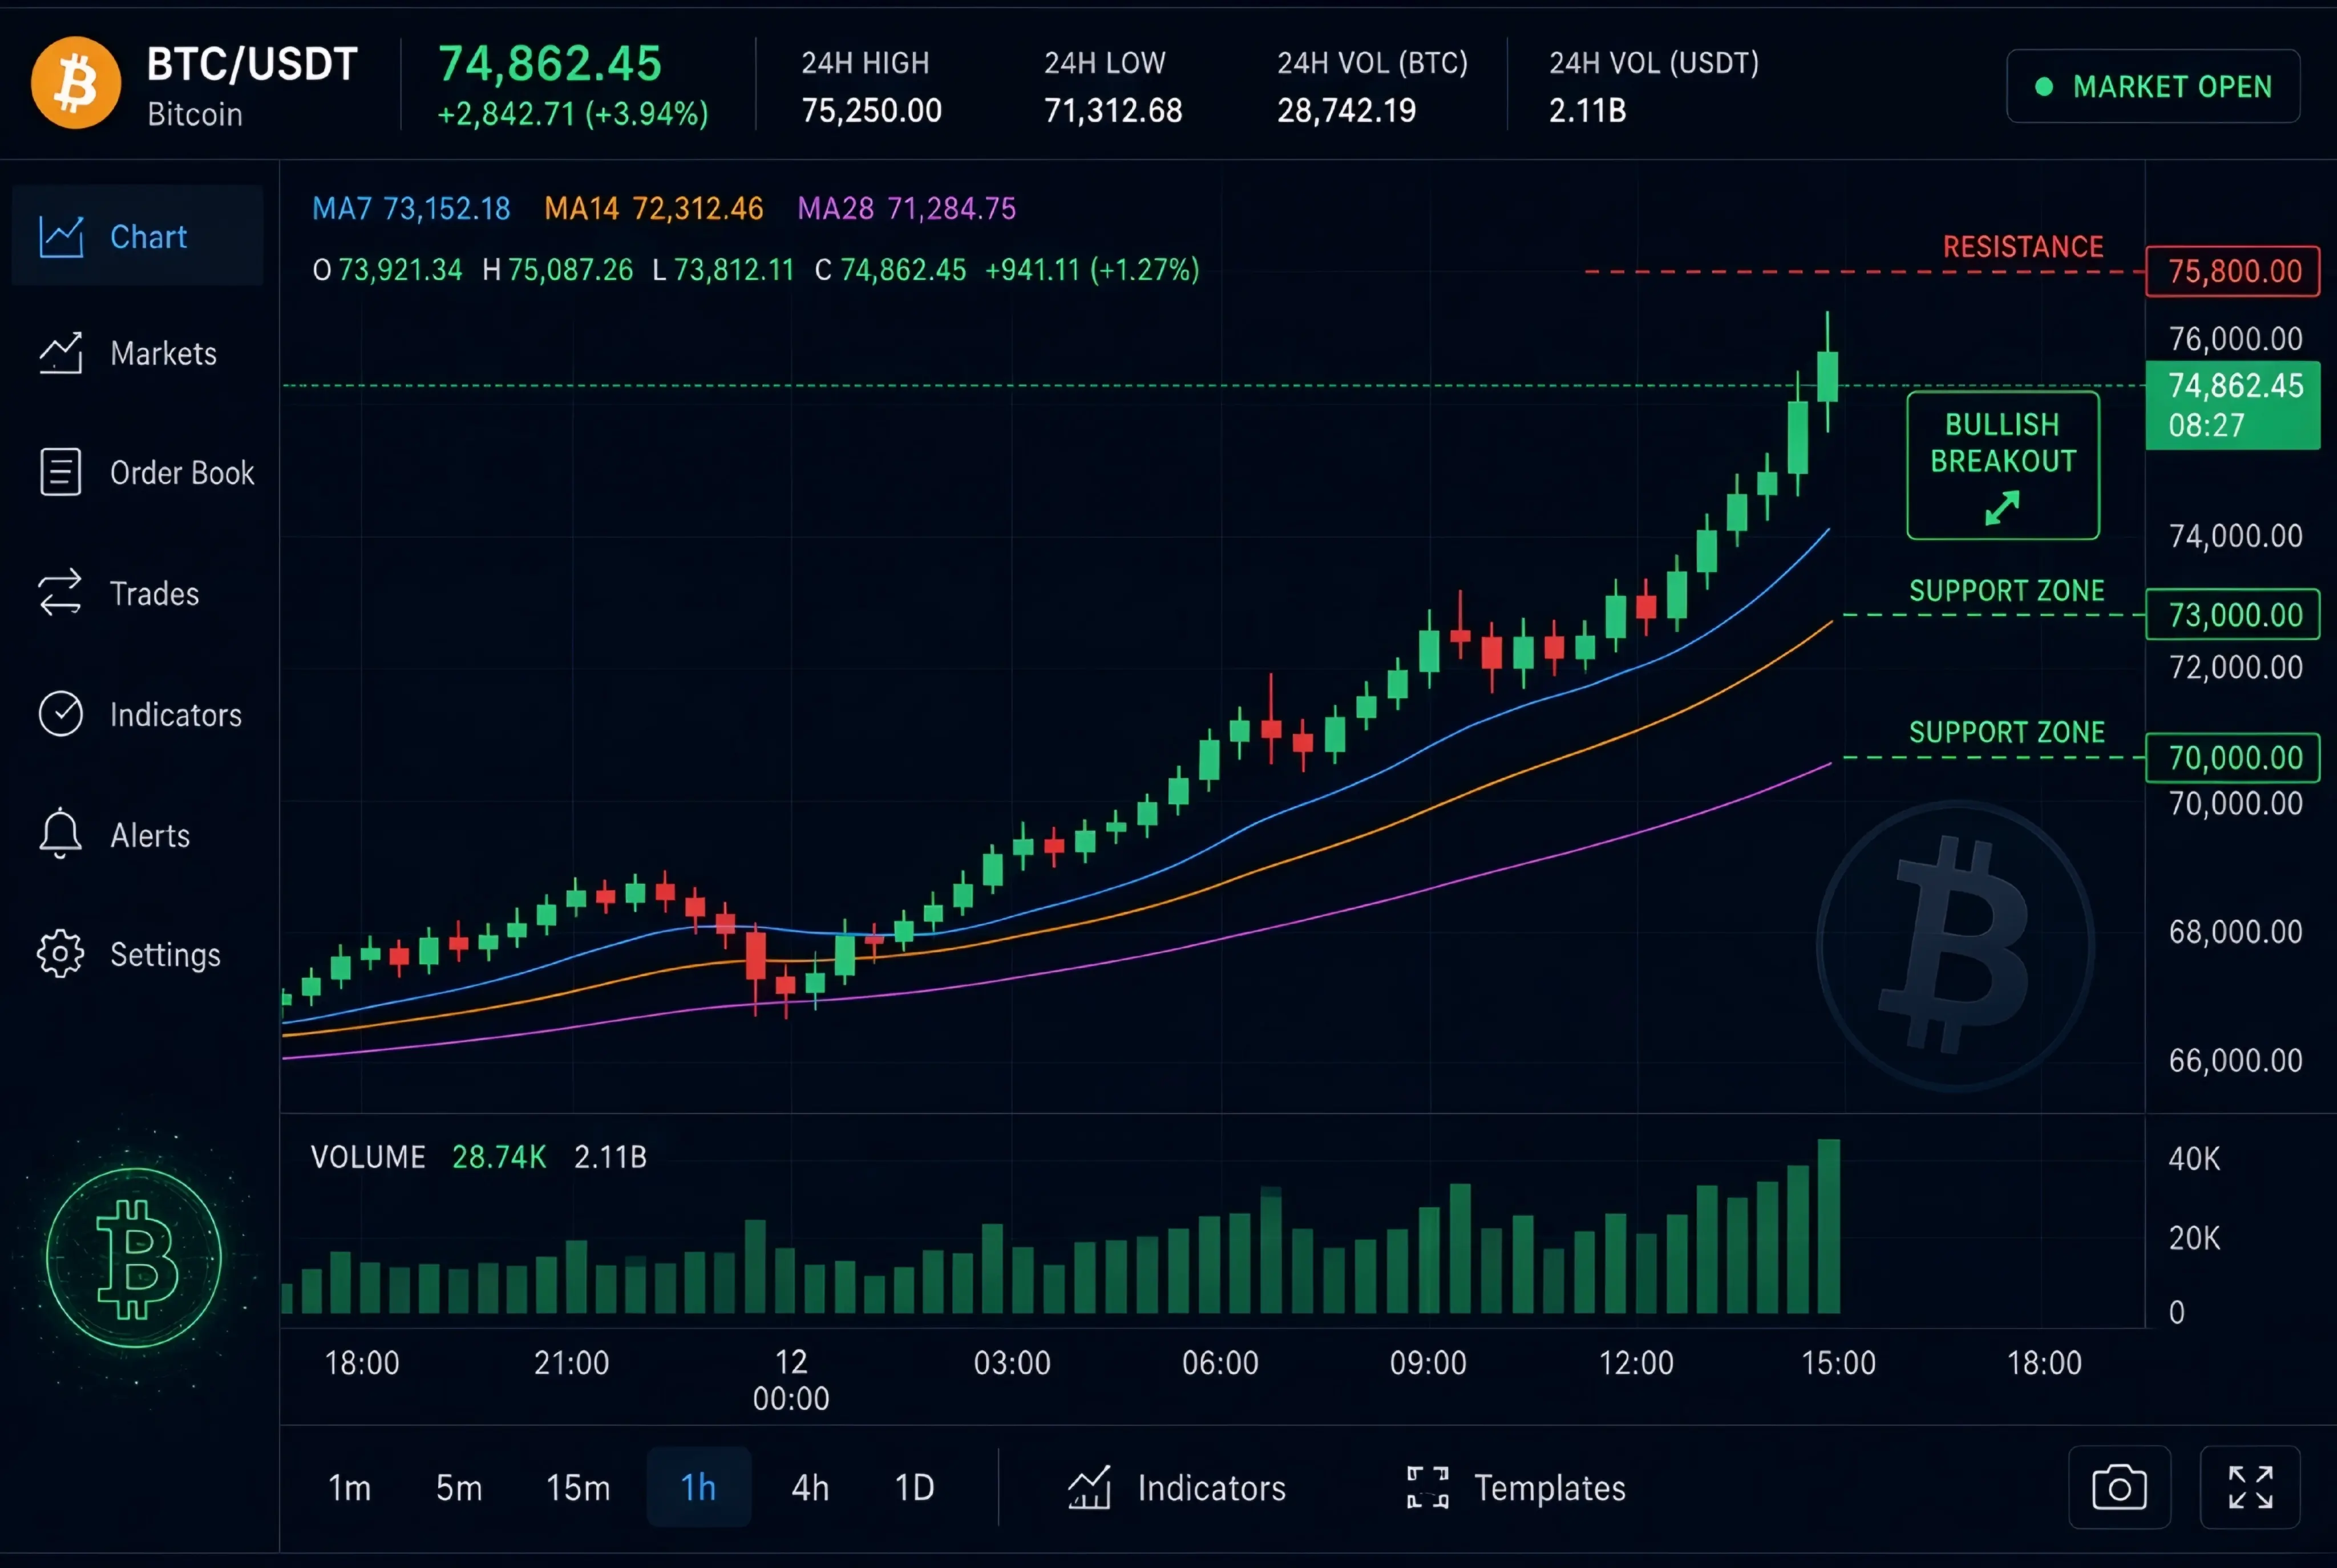
I almost ignored this because +7–8% on Bitcoin is strong but not unheard of — then I checked the volume structure and it forced me to look closer.
$BTC USDT currently around 74,500 – 75,000. 24h high near 75,500–75,800, low around 68,900–69,000. That’s roughly a 9–10% range from bottom to top. Massive move. Turnover is extremely heavy (30B+ range across majors).
The setup (1h chart):
MAs are fully stacked bullishly. Price is well above MA7, MA14, and MA28 with clear separation and strong upward slope. Volume on the expansion candles has been running significantly above the recent MA5 and MA10 a
post-image
BTC+0.66%
ETH+0.73%
  • 2
I prefer to buy $XAUT USDT does around $4,390 than to sell at $4,350.

The latest cross-market snapshot suggests XAUT is around $4,340-$4,350 versus the nearby spot gold of $4,360 per ounce after the short-lived selloff. The bigger picture remains focused on the upcoming Fed minutes, while the lower Treasury yields managed to propel gold to the next level.

The chart is currently placed in the “indecision zone”

with the next critical barrier at $4,390, the structure starts looking much cleaner. Reuters also identifies $4,390 as the crucial bullish trigger. Meanwhile, $4,505 is the next p
post-image
XAUT-0.27%
Gold just reached a level where the downside pressure may finally run into serious demand - and XAUUSD is now testing whether this support can trigger the next reversal.
The 5-minute chart tells an interesting story. Price sold off aggressively from the 4,400 area, broke through the lower intraday structure, and has now reached the major support zone around 4,330- 4,338.
This is not a level where I want to blindly catch a falling market. The idea becomes interesting only if buyers defend the zone and price starts reclaiming the nearby structure.
Above current price, the chart has several areas
post-image
XAUT-0.27%
  • 4
$XAUT USDT stuck under EMA7, not impressed yet
Gold bounced off the 4,361 low but stalled right under 4,383 (EMA7). Volume is weak 462 vs 940 MA5 so this isn't a real buy signal yet. It's a dead cat with a pulse.
What I'm actually watching:
4,383 is the line in the sand. Break above with volume = maybe we see 4,413.
Rejection here = back to 4,361 or worse, 4,347.
Trade plan (simple, no overthinking):
Entry: Only above 4,385 on a 15m close with
volume picking up (above 900).
SL: 4,358 (tight, below today's low).
TP1: 4,413.
TP2: 4,424 if momentum carries.
If it rejects: I'm not shorting here-too
post-image
XAUT-0.27%
  • 7
  • 1
I've been staring at this $NEAR USDT 4H chart for the last hour, and one thing that stands out is how cleanly price has rejected the 1.5350 swing low. We swept that level, wicked below it, and immediately reclaimed it. That's classic liquidity grab behavior before a potential reversal.
What caught my attention is the current consolidation directly inside the 1.5820-1.6540 range. We're sitting at 1.6250, which is the mid-point of this recent balance area, and the EMA's (7,14,28) are all tightly coiled between 1.6255 and 1.6268. This tells me momentum is compressed and a breakout is imminent.
I'm
post-image
NEAR+12.68%
BTC+0.66%
  • 2
😬 I almost ignored this because +11.79% is a strong move, but then I saw the volume structure.
$VVV USDT +11.79% today price at 13.107, below the 24h high of 13.207 low was 11.638 that's a 13.5% range from bottom to top strong move turnover 658.67K moderate liquidity.
The setup (4h chart):
MAs are stacked bullishly Price is above MA7 (12.378), above MA14 (12.149), and above MA28 (12.088) all three aligned with clean structure MA7 MA14 MA28 is a perfect bullish stack with healthy separation.
Volume printed 5.65K on the last 4h candle MA5 is 9.52K, MA10 is 6.18K that's below MA5 (59.3% of averag
post-image
VVV+10.02%
SXAUTUSDT this one actually made me double take.
+1.00% is usually background noise.
But then I saw the volume spike and had to look again.
Price: 4,404.1
24h High: 4,408.4
24h Low: 4,351.0
Range: Tight 1.3%
What I'm seeing on the 1h:
MAs are bunched up at
MA7: 4,389.4
MA14: 4,383.9
MA28: 4,373.7
They're all clustered together within 15.7 that's textbook something's about to break.
Volume just printed 16.870 while MA5 is 142.439 and MA10 is 93.320.
That's below the average.
00 Here's what caught my attention:Price barely moved while volume exploded in the last two candles.
That's absorption so
post-image
XAUT-0.27%
  • 6
$NXPC USDT 🔥 this one actually made me double take
+10.21% is usually background noise but then I saw the volume spike and had to look again.
Price: 0.2073
24h High: 0.2126
24h Low: 0.1881
Range: Tight 13%
What I'm seeing on the 4h:
MAs are bunched up at
MA7: 0.1982
MA14: 0.1946
MA28: 0.1882
They're all clustered together within 0.0100 that's textbook something's about to break.
Volume just printed 93.09K while MA5 is 191.25K and MA10 is 392.58K that's below the average.
00 Here's what caught my attention:
Price barely moved while volume exploded in the lasttwo candles.
That's absorption. Some
post-image
NXPC-0.81%
  • 13
I almost ignored this because -0.08% is flat, but then I saw the volume structure.
$XAUT USDT -0.08% today price at 4,359.5, at the 24h low of 4,359.5 high was 4,366.2 that's a 0.15% range from bottom to top extremely tight move turnover 1.43M moderate liquidity.
The setup (1D chart ):
MAs are mixed to bullish: Price is below MA7 (4,364.7) but above MA14 (4,295.6) and above MA28 (4,178.5) price is above the 14 and 28, but MA7 is acting as overhead resistance the MA structure is not cleanly stacked (MA7 highest, then MA14, then MA28), so this is a mixed trend with short-term weakness but long-te
post-image
XAUT-0.27%
  • 4
I almost ignored this because +50.78% is an explosive move, but then I saw the volume structure.
$PORTALUSDT +50.78% today price at 0.016447, below the 24h high of 0.018309 low was 0.010806 that's a 69.4% range from bottom to top massive explosive move turnover 1.71M solid liquidity.
The setup (1D chart):
MAs are stacked bullishly: Price is above MA7 (0.011773), above MA14 (0.011421), and above MA28 (0.010826) all three aligned with massive gaps extremely bullish structure on the daily.
Volume printed 116.61M on the last daily candle MA5 is 29.58M, MA10 is 17.25M that's above MA5 (394% of aver
post-image
BTC+0.66%
  • 3
I almost skipped this trade because -0.08% is flat, but then I noticed the volume structure.

$XAUT USDT -0.08% at 4,359.5 today's price, 24h low of 4,359.5 and 24h high of 4,366.2 is a 0.15% range from bottom to top extremely tight move, turnover of 1.43M is a moderate liquidity.

The setup (1D chart):

MAs are mixed and bullish

Price is below MA7 (4,364.7), but above MA14 (4,295.6) and above MA28 (4,178.5) price is above the 14 and 28, but MA7 is overhead resistance the MA structure is not cleanly stacked (MA7 is highest, then MA14, then MA28), so it's a mixed trend with short term w
post-image
XAUT-0.27%
  • 3
Investment logic for NVIDIA + Market & liquidity analysis
Several common logics for holding or monitoring NVIDIA (not investment advice):
Market positioning & relative strength
Tokenized NVIDIA currently trades near the $225 zone, closely tracking the underlying equity. It sits in a consolidation range after recent moves, with nearby support around the $212–$220 area and resistance near $230–$236. Price action is primarily driven by traditional equity market factors (earnings, AI demand, semiconductor cycle) rather than pure crypto catalysts, though it still experiences crypto-market volatil
post-image
  • 9
XAUT Market Recap | Low volume sideways consolidation, patiently waiting for a directional breakout.

I almost got caught up in the trap of XAUT’s sideways trading today! In general, the structure of the current price action is nice to look at, though.

As of now, the price of XAUTUSDT is at 4362, without any significant changes during the last 24 hours. The price range within which the asset has been fluctuating today is 4359-4366, or 0.16%. In general, the trading volume is mediocre, and the volume at smaller time frames has been gradually declining, which is typical for consolidation of
post-image
XAUT-0.27%
  • 2