Square
Following
Hot
News
Notifications
Profile
Share your thoughts
placeholder
Article
On November 5, Eastern Time, contracts signed in 2022 by the five members of @NewJeans_ADOR and their label ADOR, when the members were 14 to 17 years old, were made public: clauses in the South Korean government's standard artist contract guaranteeing minors’ rights to education, physical and mental health, sleep and rest, and protection from forced overtime work had been removed from the contracts.
The contracts state that they remain valid until 2029; after expiration, the company may continue using the members’ names, likenesses and voices and license them to third parties, including for A
post-image
HYBE-1.67%
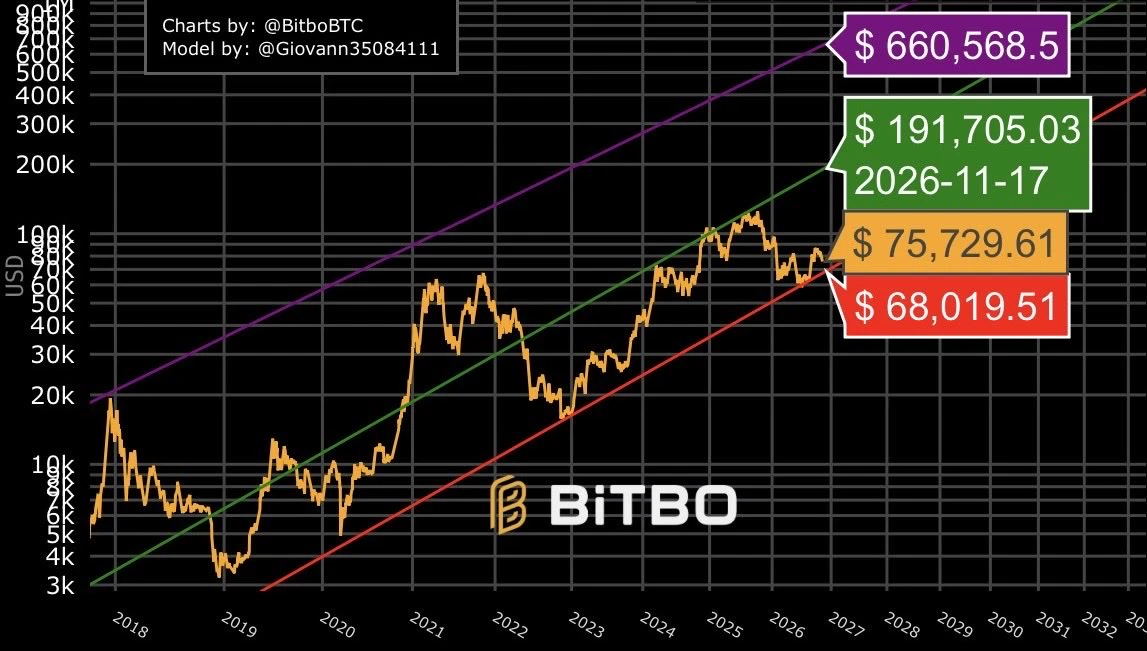
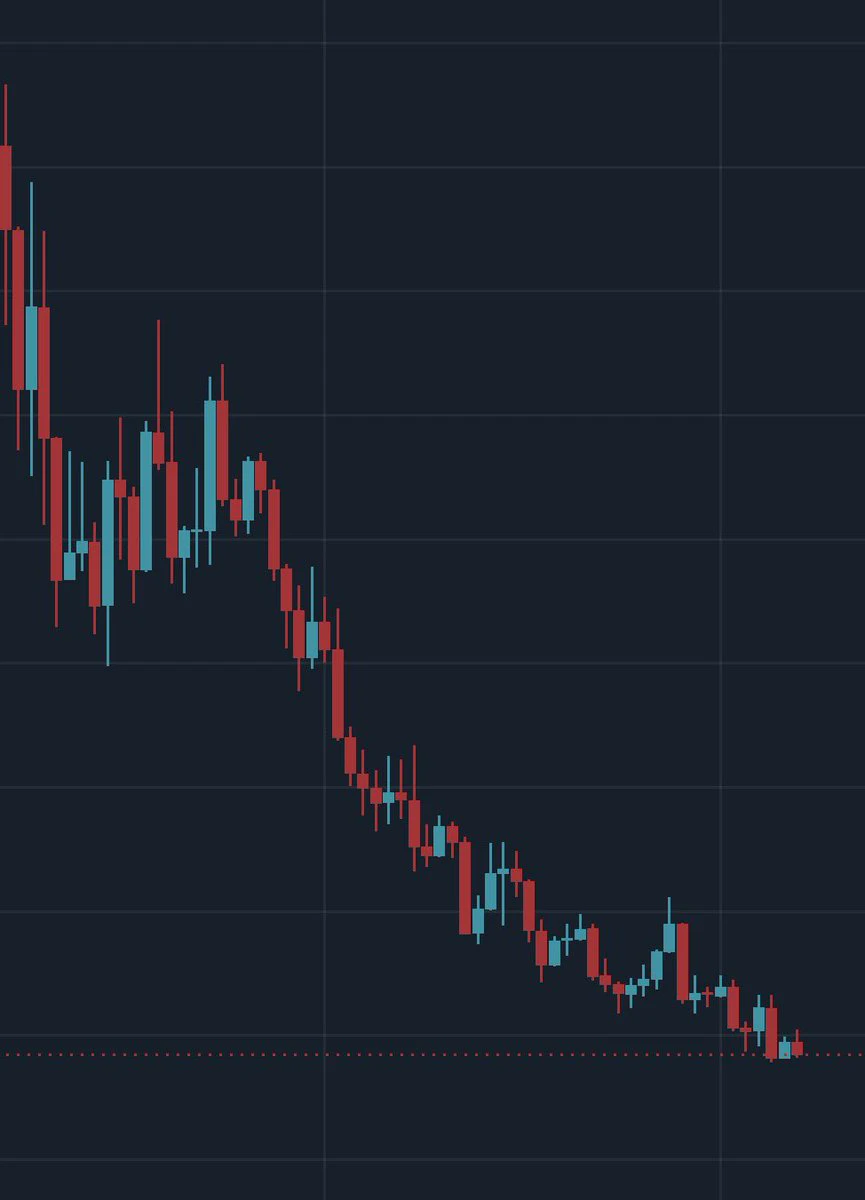
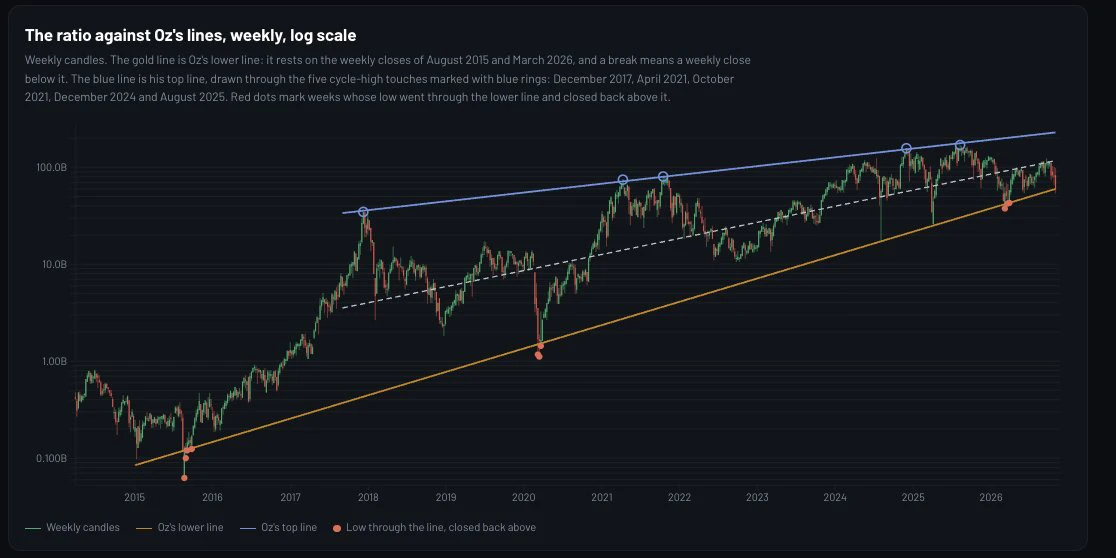
During the 2020-21 bull run bitcoin was trading significantly higher than fair value (green line) during a large portion of the cycle.
During the 2024-2025 bull run bitcoin barely even touched fair value and has been stuck between the support (red line) and fair value channel since 2022.
Today we’re sitting only 11% above support and a trip to resistance (purple line) would require a 771% price surge.
Bitcoin historically spends very little time near this red line and in the last 4 years has barely broken fair value.
No model is perfect but sentiment right now feels exactly the same as this
post-image
BTC-0.67%
Trenches
ZIG
Z
bade
b
ZIG
0x8c...1145
Market Cap
$.
Change
.
24h Vol
$.
Holders
.
BTC
B
bade
b
BTC
C5xp...pump
Market Cap
$.
Change
.
24h Vol
$.
Holders
.
José
J
bade
b
José
87CQ...1UJT
Market Cap
$.
Change
.
24h Vol
$.
Holders
.
IDOL
I
bade
b
IDOL
0x3b...ab07
Market Cap
$.
Change
.
24h Vol
$.
Holders
.
STONK
S
bade
b
STONK
6GmA...UNgx
Market Cap
$.
Change
.
24h Vol
$.
Holders
.
Robinhood chain visualized
post-image
HOOD+4.25%
More and more people are waking up. I don't know if that's a good thing or a bad thing.
What do you mean, your social security is hitting you?
I don't even know how to respond to that 🙈
post-image
The herd stuck in the old easy market days
Those days are far behind us
In the past I've explained how u only get a small window of a gold rush during a market mania phase
The bubble burst in 2024 with KOLs reaching max extraction
Markets only get harder with saturation
-Reaper
post-image
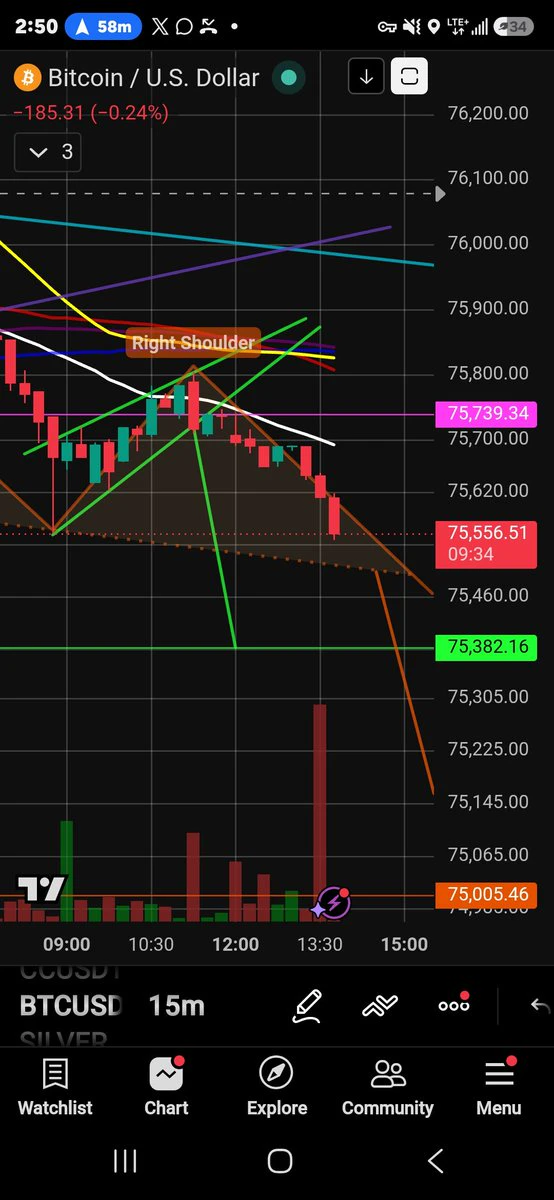
SOL | Short 🔴 | Bearish | 15m24h: -0.68% | Volume: 470.3M USDT Short rationale: Price below EMA200; EMA20/50/200 are bearishly aligned; RSI14 is 43.0; MACD histogram is negative; ADX14 is 18.3; volume is 0.60 times the 20-candle average; trend pullback/continuation. Entry: 89.5 Stop loss: 89.9345 Take-profit 1: 88.9569 | Take-profit 2: 88.6311 | Take-profit 3: 88.1966 Entry for reference only; do not chase the price. The strategy is invalidated if the stop-loss level is hit. Technical analysis strategy only; not financial advice. $SOL
post-image
SOL-0.77%
$BTC 1st Short-Term Target Hit! 💥🎯
post-image
BTC-0.67%
$Bull Run is staging a strong bullish rebound, up more than 10% and nearing the $0.0600 resistance level! If the breakout is confirmed, the rally could extend to $0.0630. Trading plan (long): Entry: $0.0585 – $0.0593 Target levels: $0.0600 / $0.0615 / $0.0630 Stop-loss: $0.0570
post-image
牛来-1.82%
Guys, I'm opening a long position on $ZEC here‼️ Take profit: $1,290 / $1,310 / $1,340 Stop loss: $1,238.62 Be sure to manage risk and wait for a confirmation signal.
post-image
ZEC+1.16%
🚀 Let's grow together on X!
🤝 Followed? I’ll follow back!
❤️ Like, comment, and share.
🔁 Retweet to show your support!
Nobody grows alone here. Together, we’re stronger! 💪
#SDV #FollowForFollow #LeftFollowsLeft
post-image
Crypto Market update
live-cover
LIVE51
OpenAI CFO: Data center investments will not change due to the midterm elections.
live-cover
LIVE73
Notice how Protestants have no issue calling each other brothers in Christ but condemn the apostolic Churches for referring to their priests as “Father” without understanding what Jesus meant
St-Paul told the Christians in Corinth the he was “their father in Christ” - 1 Cor 4:15
post-image
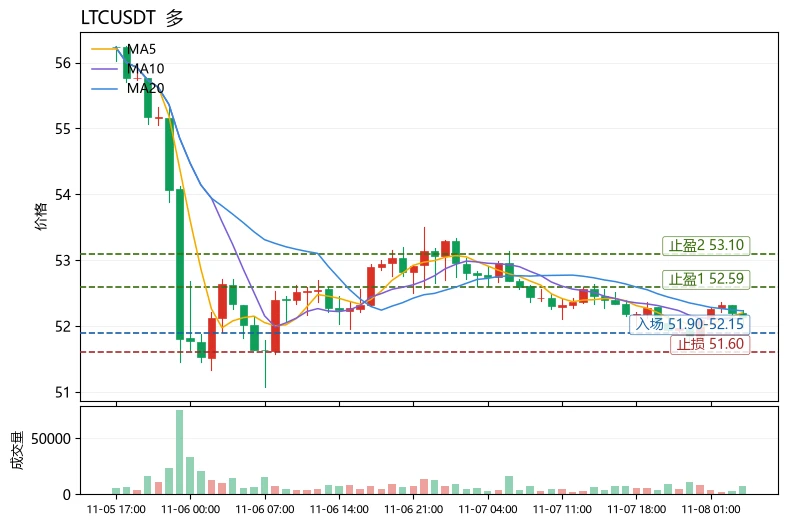
$LTC Current price: 52.14. The first resistance above is the Bollinger upper band at 52.59, and support below is the Bollinger lower band at 51.87. These two levels are where bulls and bears are currently locked in a short-term battle. Why give the price levels before explaining the logic? Because the first step in reading a chart is always to establish your bearings, not to predict.

Using LTC as an example, here's a reusable way to assess trend health: moving averages show direction, MACD shows momentum, and RSI shows positioning. A healthy trend requires all three to align. Currently, MA5=5
post-image
LTC-0.09%
PEPE+0.97%
Everyone’s saying the S&P 500 has topped, but I haven’t seen enough reason to believe that. The chart does look like 2000, but expensive valuations don’t mean an immediate drop. Back then, it kept climbing for more than six months before crashing. I had my stop-loss set too tight and got stopped out twice. I’ve learned my lesson. I hope I’m wrong this time—if I am, that means the rally is still going. Keep an eye on what I’m watching.
post-image
SPX500+0.19%
US500+0.69%
Just as I thought..
Midline mayhem
BTC/VIX
post-image
BTC-0.67%
$XRP On the 4-hour chart, bears are still firmly in control, with the price stuck near 1.16 while the 4-hour EMA50 has slipped to 1.24; trading below the moving average indicates that sellers are still setting the pace. My plan is to open a short in the 4-hour resistance zone, with an entry range of 1.161–1.163. As long as 1.16 is not decisively broken, I’m looking at three successive targets below: 1.157, 1.153, and 1.148. I’ll set the stop-loss at 1.171; if the price breaks above 1.17, this bearish thesis is invalidated, and I’ll exit without hesitation. Based on the risk calculation, the s
post-image
XRP-1.15%
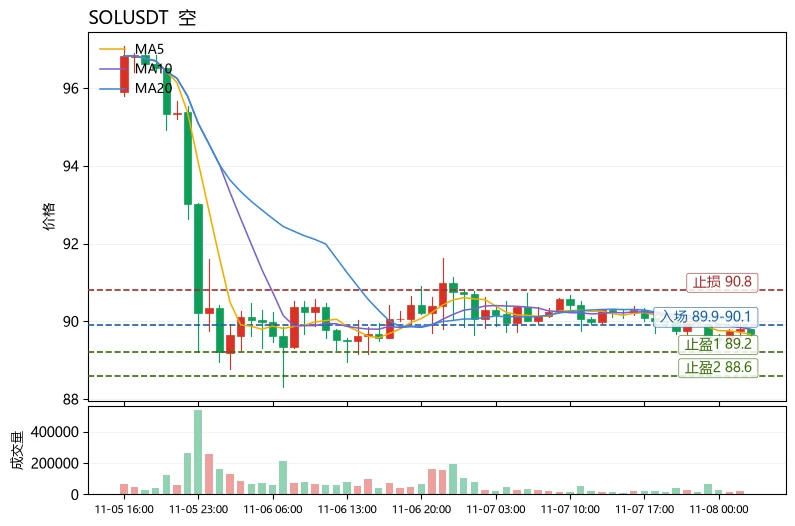
A common misconception is to see the price near the lower Bollinger Band and the RSI falling to around 40, then assume “oversold means a rebound is inevitable” and rush to buy the dip. Technically, oversold is simply one expression of weakness, not a reversal signal. Until the moving average structure recovers, the odds of catching a rebound are not high. $SOL is currently in this state.
The moving averages are bearishly aligned, with MA5=89.66 below MA20=90.019. The price is trading below the short-term moving averages, so a rebound would only be meaningful if it first holds around 89.7. The
post-image
SOL-0.77%
TRX+0.42%
XRP-1.15%
Load More

Join 40 M users in our growing community

⚡️ Join 40 M users in the crypto craze discussion

💬 Engage with your favorite top creators

👍 See what interests you

Trending Topics

USAIStocksHitHard

21.1k Views3.67k Discussing

U.S. stocks sold off sharply on Thursday, November 5 (UTC). The Nasdaq closed down around 5.5%, entering correction territory, while the Philadelphia Semiconductor Index plunged roughly 12%, with chip stocks including $NVDA and $AMD posting steep losses. Beyond profit-taking, investors are growing concerned about the pace of AI data center construction, capital spending, and future returns on investment. The key question now is whether the AI sector’s lofty growth expectations need to be repriced. Where do you think the next opportunities will emerge: chip stocks, tech giants, or other sectors?

USNonfarmPayrolls

34.41k Views4.34k Discussing

StakeOnLaunchpoolToShare450KVLX

9.9k Views828 Discussing

View More