Square
Following
Hot
News
Notifications
Profile
Share your thoughts
placeholder
Article
$SOXL ’s hourly chart flashed an RSI oversold signal, so I decisively entered for the rebound. After momentum shifted, the price made a clean 56% move up, and I locked in profits. This pattern is worth monitoring; next, I’ll focus on whether $BTC and BLESS show similar oversold reversal setups.
I remain bullish on the long thesis for $SOXL , and the trade plan is ready: entry zone 47.46–48.53, first target 50.69, second target 52.85, with a stop at 45.56. Bottom signals are already fairly clear, and a rebound could begin at any time, so it may be worth being a little more aggressive.
That sai
post-image
161
161161
Pump.Fun
MC:$2.19KHolders:2
2.08%
SOXL-1.16%
BTC-0.67%
Once you’ve firmly chosen a direction, don’t let a few bullish candles shake you out!
The easiest way to lose money in trading isn’t getting the direction wrong—it’s flip-flopping: going long today, short tomorrow, and letting every move follow your emotions.

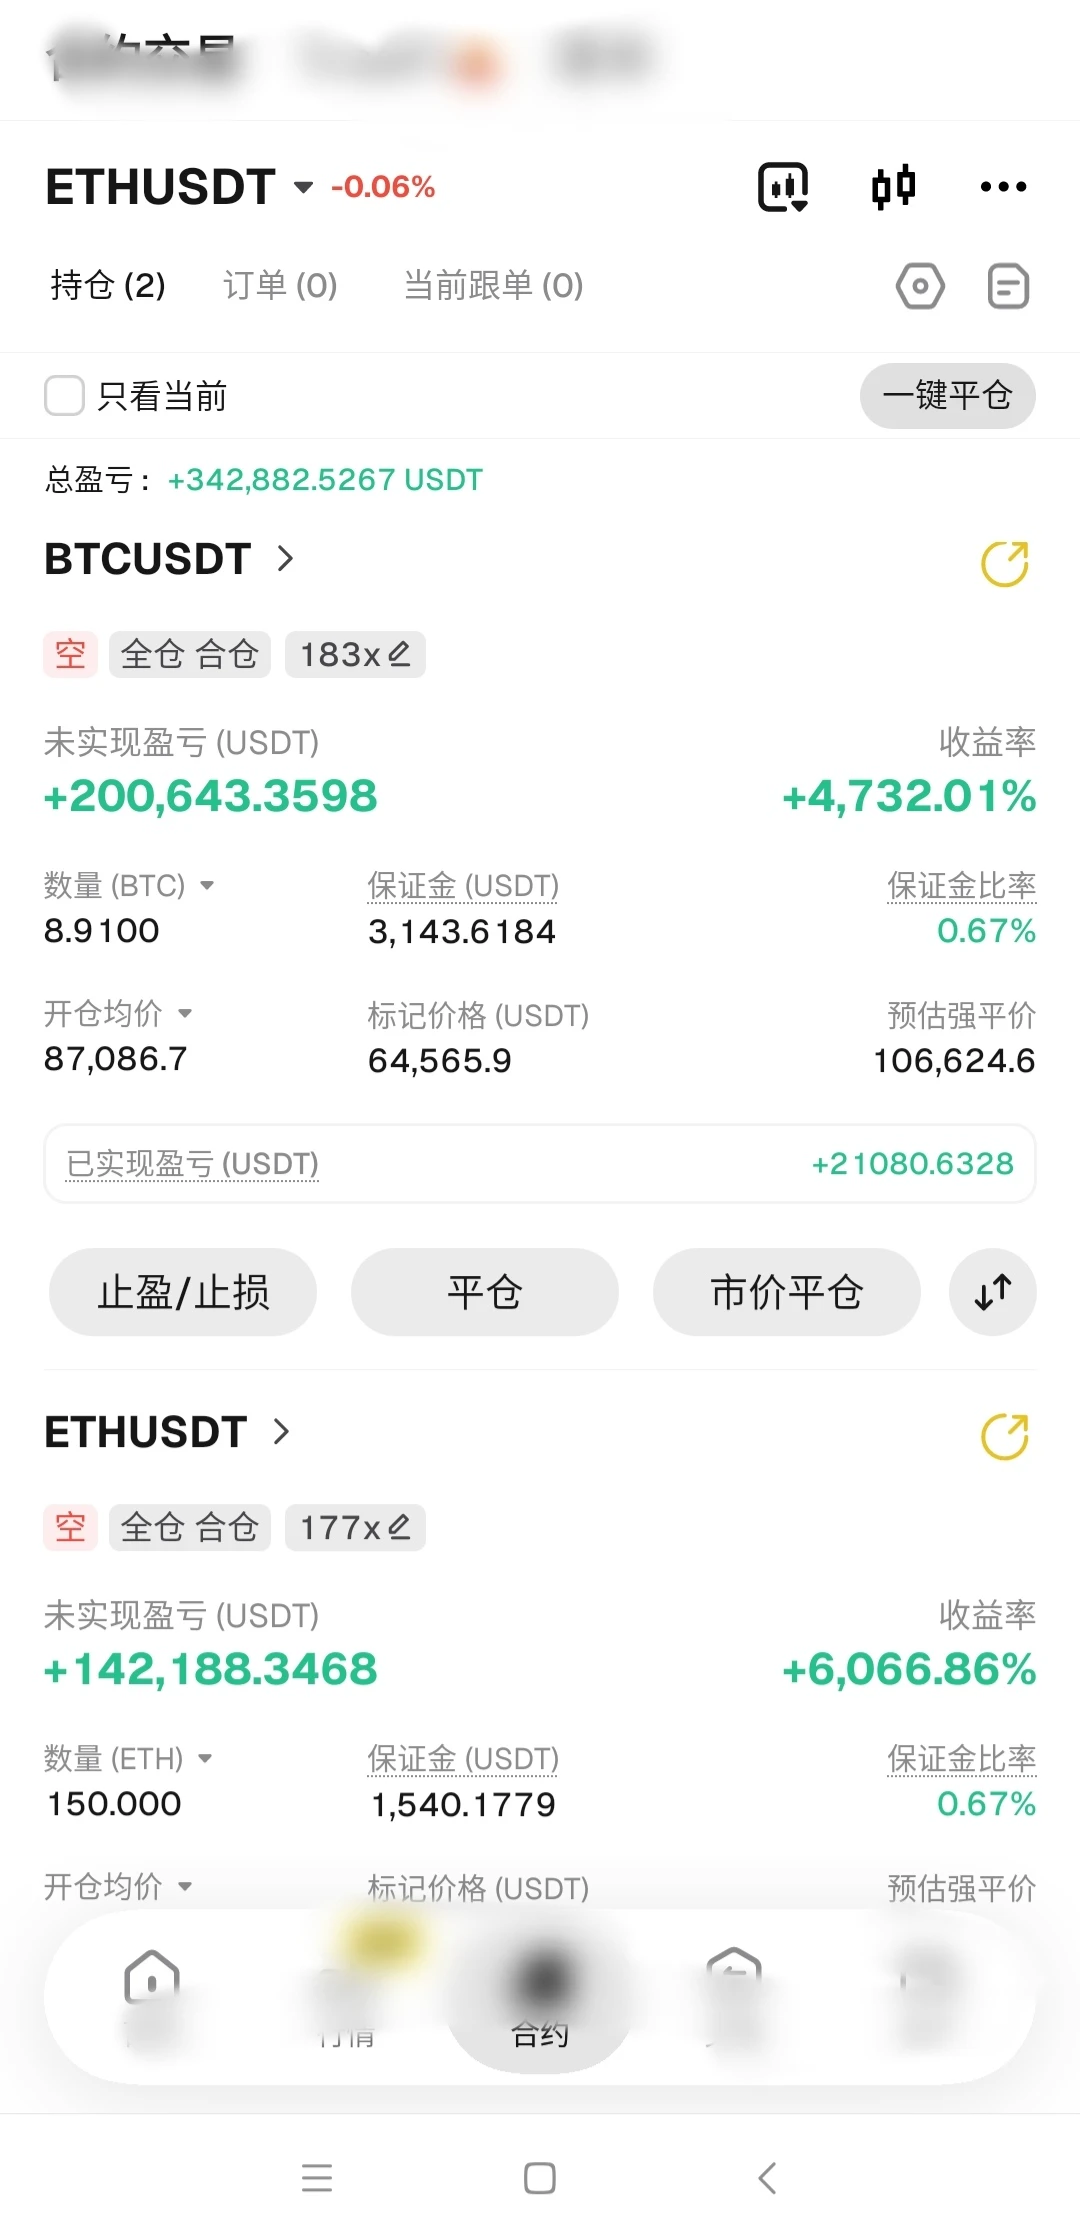
Ever since Bitcoin was above 87,000, I’ve repeated just one thing: short every rebound!
There have been bounces along the way, bull traps, and calls to buy the dip everywhere, but my thinking hasn’t changed from start to finish. Don’t try to call the bottom or catch a falling knife. A few bullish candles won’t shake my view of the trend.
post-image
BTC-0.65%
ETH-1.23%
Trenches
BP
B
bade
b
BP
BPxx...jPCy
Market Cap
$.
Change
.
24h Vol
$.
Holders
.
BAWSAQ
B
bade
b
BAWSAQ
4La9...pump
Market Cap
$.
Change
.
24h Vol
$.
Holders
.
mihao
m
bade
b
mihao
4Cxj...pump
Market Cap
$.
Change
.
24h Vol
$.
Holders
.
Marvin
M
bade
b
Marvin
HkRQ...pump
Market Cap
$.
Change
.
24h Vol
$.
Holders
.
GTA6
G
bade
b
GTA6
4kjr...zDnz
Market Cap
$.
Change
.
24h Vol
$.
Holders
.
11.16 BTC trade review
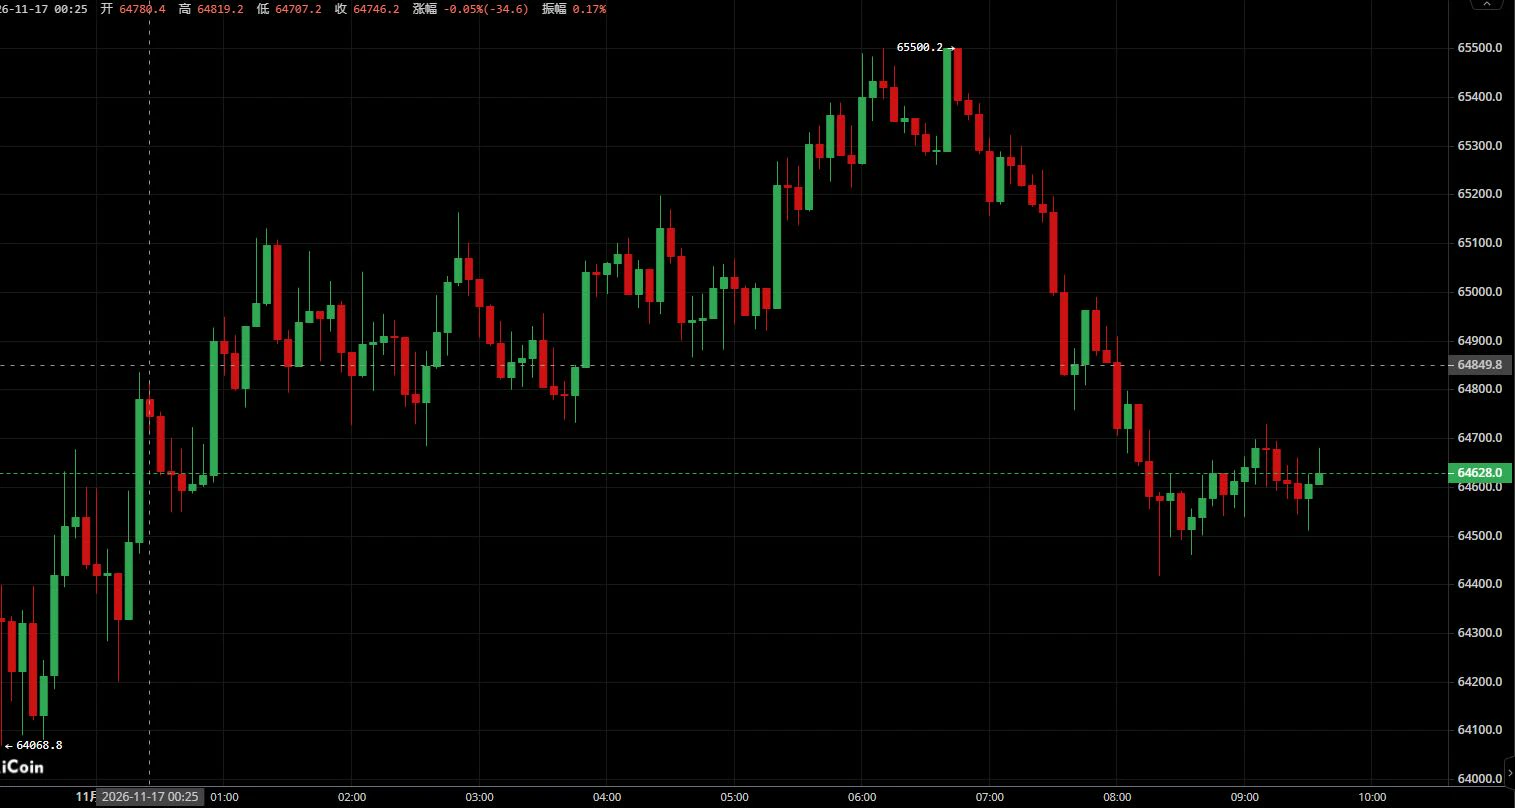
Yesterday morning, I identified 65200-65500 as a resistance zone for short entries. After rebounding to that area, the market turned lower, and the pullback followed the expected pace, playing out as planned.

Understand the market structure and stick to your entry conditions. Then just let the market do the rest. $BTC #Gate直通IPO第三期Anthropic
BTC-0.65%
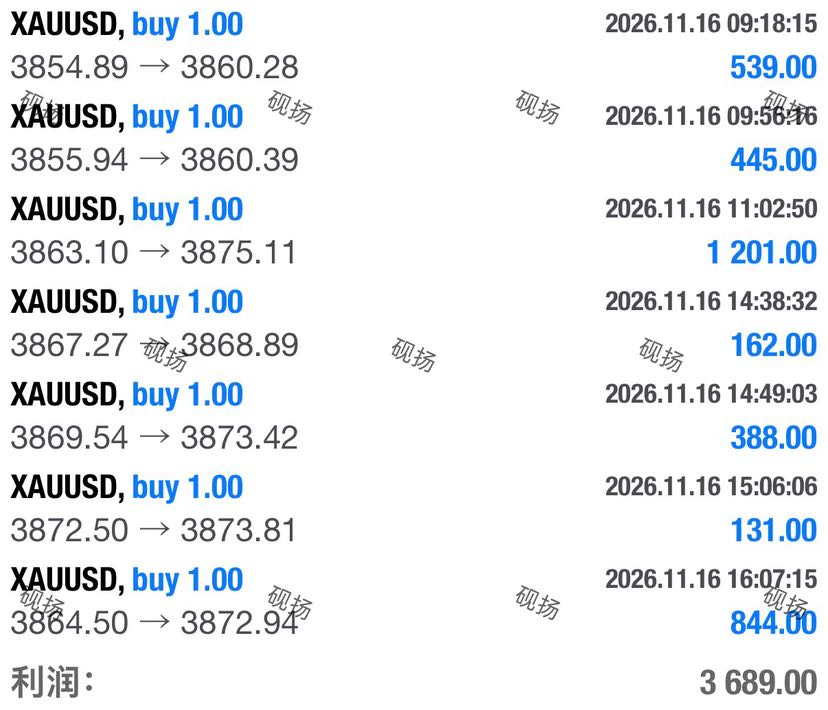
Step by step, put it into action; deliver every time. Keep the rhythm, and rewards will follow. $XAU
post-image
XAU+0.38%
11.17 $BTC Silk Road Today
Bearish trend persists; rebound faces resistance and retreats
The overnight rebound climbed to the 65500 level before meeting resistance and pulling back. Bullish momentum remains insufficient, and the price has returned to the low-level consolidation range. The weak structure of progressively lower highs remains unchanged. Overall, the market is still in a recovery phase following the decline, with no clear sign of stabilization or reversal for now. After facing resistance, the rebound still has room to move lower.
#BTC跌破关键支撑市场陷入极度恐慌
Resistance: 65000-65200, 65500
post-image
BTC-0.67%
  • 2
2026.11.17 Spot Gold Market Analysis#黄金 #大跌
GLDX-0.40%
PAXG+0.37%
Whales Moves In Sync!
live-cover
LIVE1,878
One of the easiest draws of the year this week.
post-image
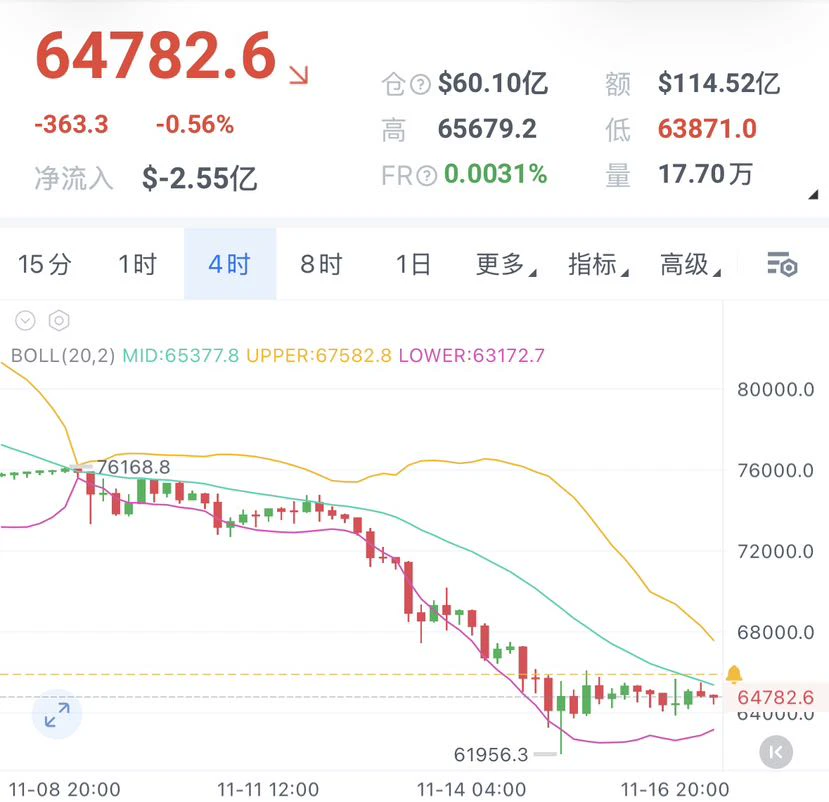
Tongge’s BTC outlook for 11.17
$BTC Enter short around 655-660, stop loss at 665, targets: 640-630-620-608.

Day two, and the price is still grinding back and forth within the 640-660 range. On the short-term chart, the 1-hour MACD has formed a golden cross, and the 4-hour histogram is also expanding, so it does seem to be recovering. But don’t celebrate yet: after three days of recovery, it still hasn’t even gotten above the 4-hour middle band at 65377. Is this what recovery looks like? This is the weakest kind of rebound—it can’t fall further, but it can’t rise either.

Some of you are bound
post-image
BTC-0.65%
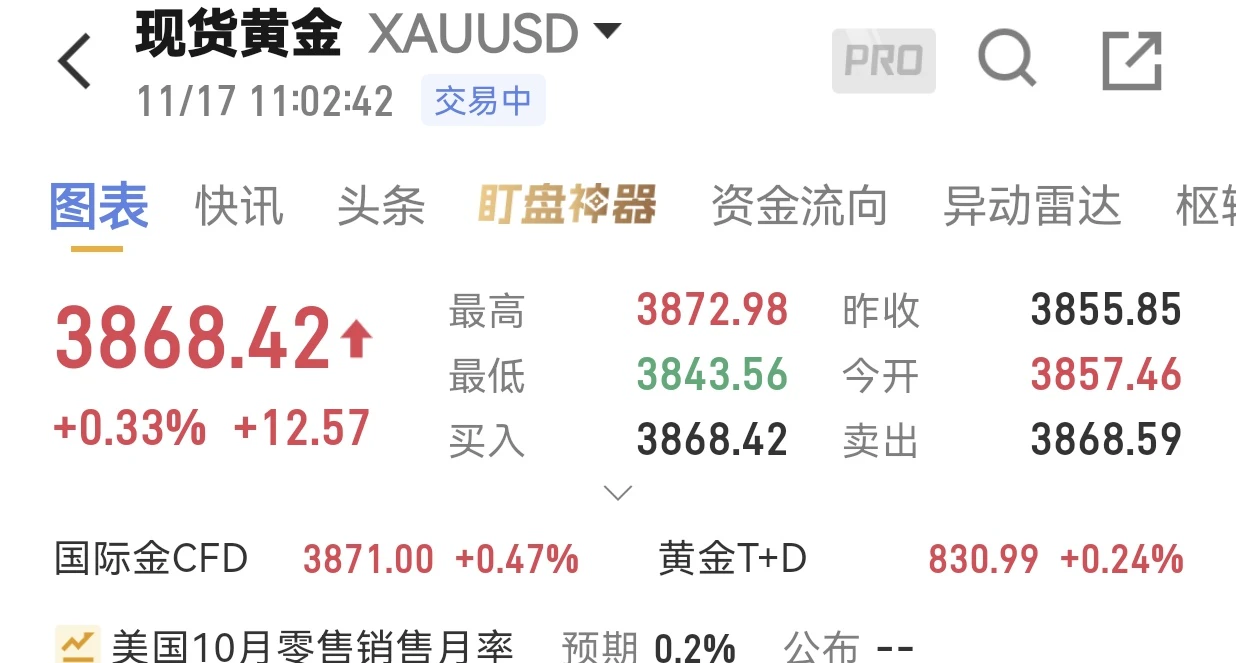
Bullish at 3868, stop 60, targets 3875 and 3885$XAU #黄金
post-image
XAU+0.38%
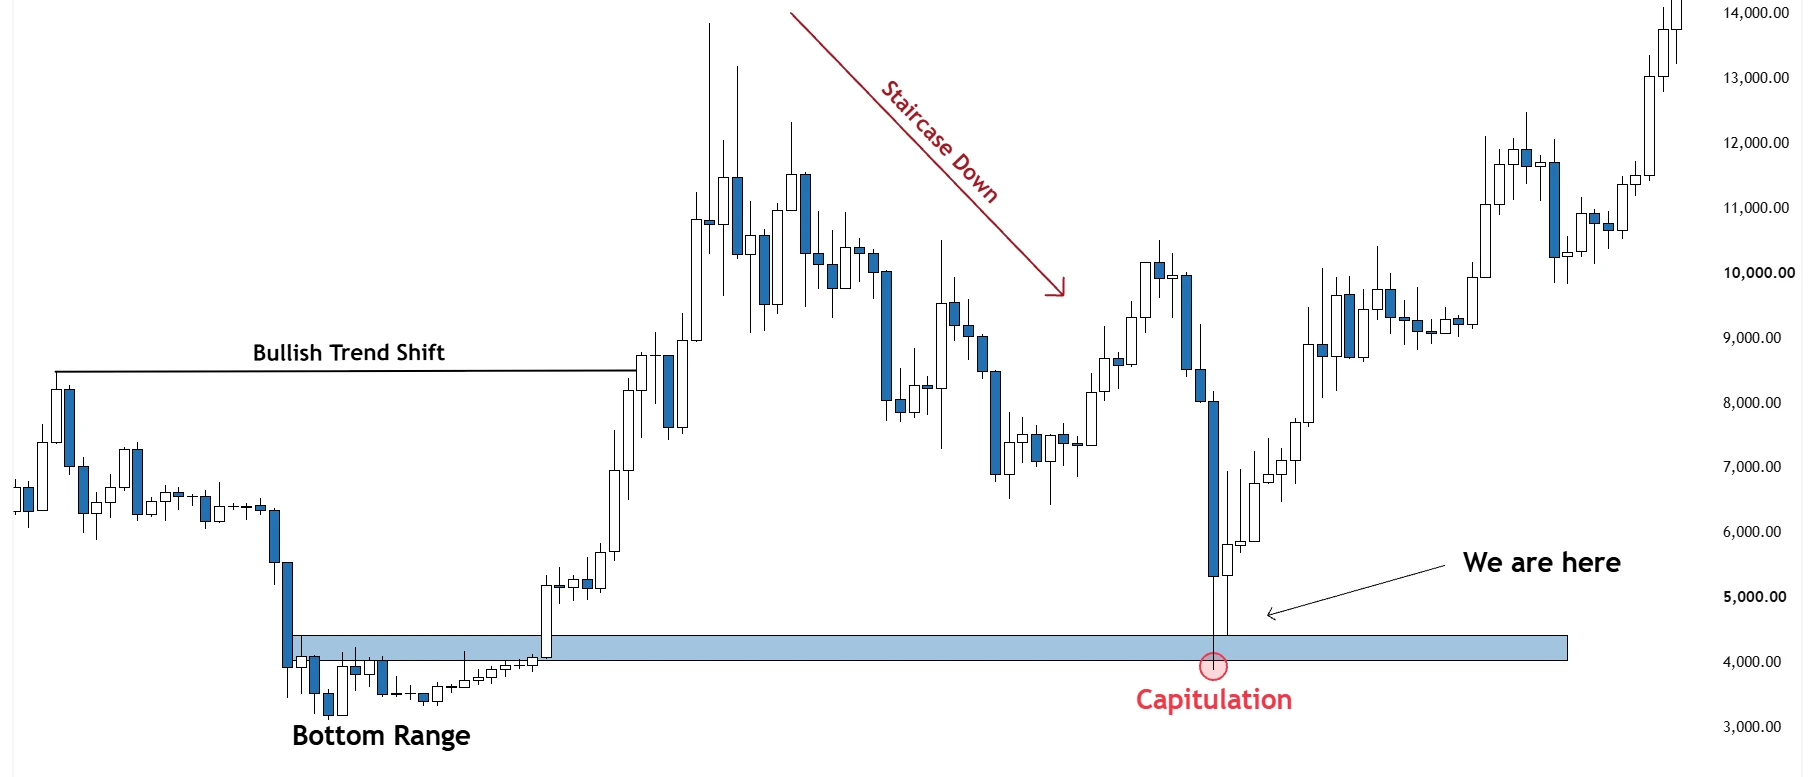
$BTC Up until this latest dump, BTC's price action had closely resembled the 2022 bear market.

Now that comparison is starting to break down.
But I think this actually makes sense.

When price was forming its bottoming range, I repeatedly pointed out that we hadn't seen real capitulation yet.

Even though sentiment was already terrible, people still seemed far too comfortable.

Now we're seeing traders calling for $10K and even predicting the complete failure of Bitcoin.

That's the kind of capitulation I felt was missing back then.

And interestingly, we've seen something similar before.

Af
post-image
BTC-0.67%
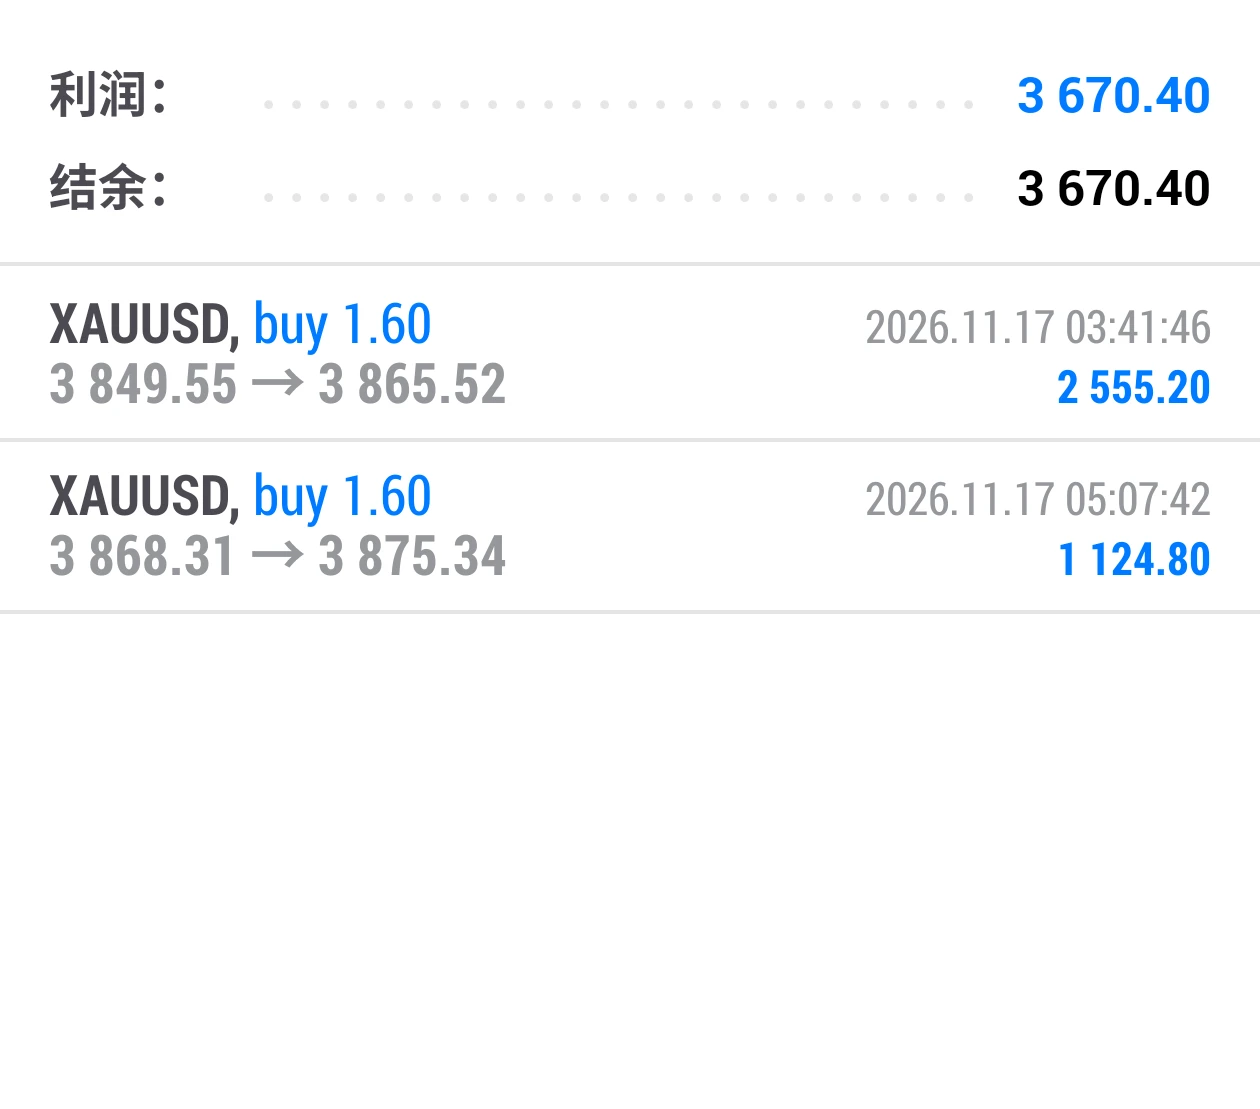
Two wins in a row intraday! Long at 3868, exited at 3875, capturing a $7 move and $1124!
$ETH $XAU #黄金 #Strategy增持485枚BTC
post-image
ETH-1.23%
XAU+0.38%
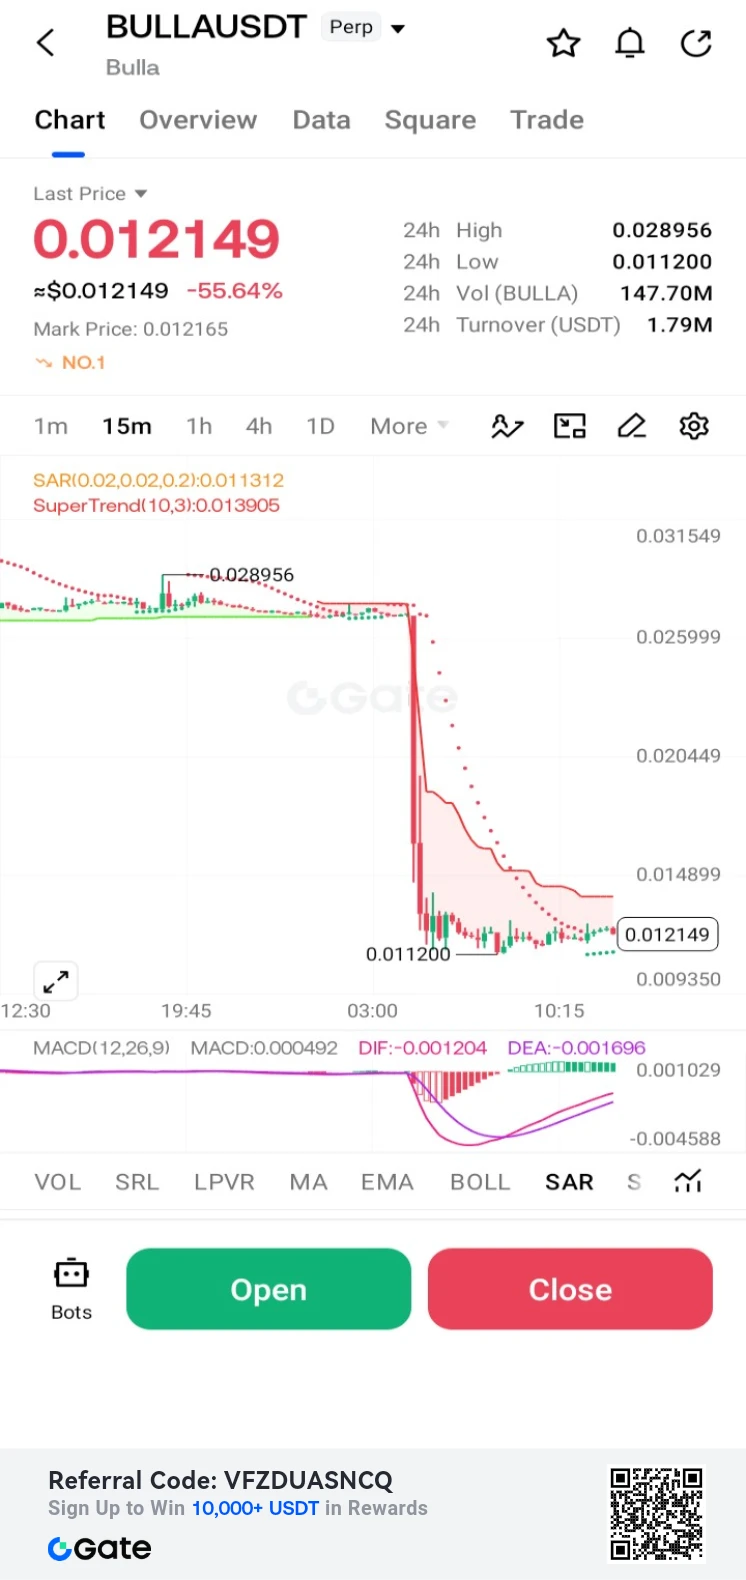
**$BULLA /USDT Perp – "Flash Crash Recovery – Long"**
Trading Plan Long $BULLA
Entry: 0.012149
SL: 0.011200
TP1: 0.013905
TP2: 0.014899
BULLA crashed massively (-55.64%) but is stabilizing above the 0.011200 low. MACD histogram is turning positive, indicating a potential relief bounce toward the 0.013905 SuperTrend resistance. High risk.
post-image
BULLA+10.92%
$AKE It's going to crash hard next, so just sit tight.
AKE+6.07%
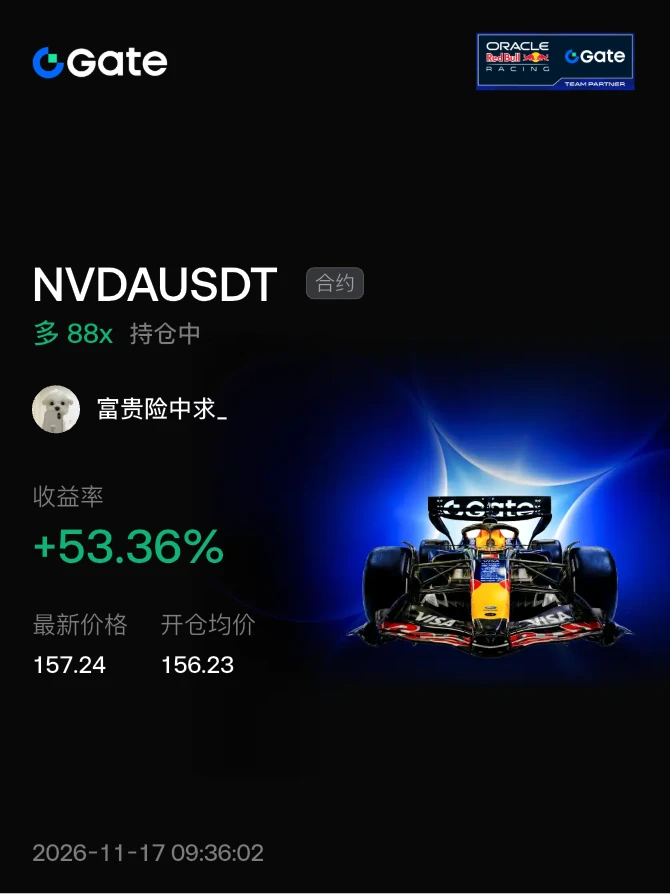
#晒出我的持仓收益 If you can't hold your positions, grab a hoe😐
post-image
NVDA-0.35%
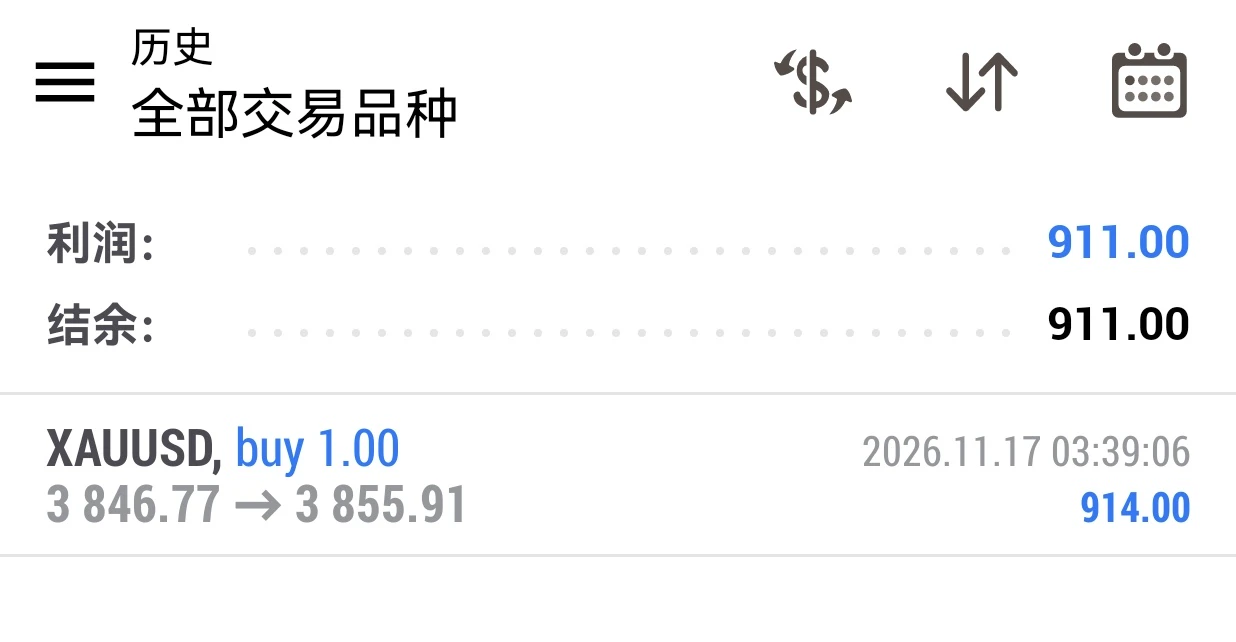
First trade of the day: went long at 3846.77, exited at 3855.91, and gained 914 $XAU #黄金
post-image
XAU+0.38%
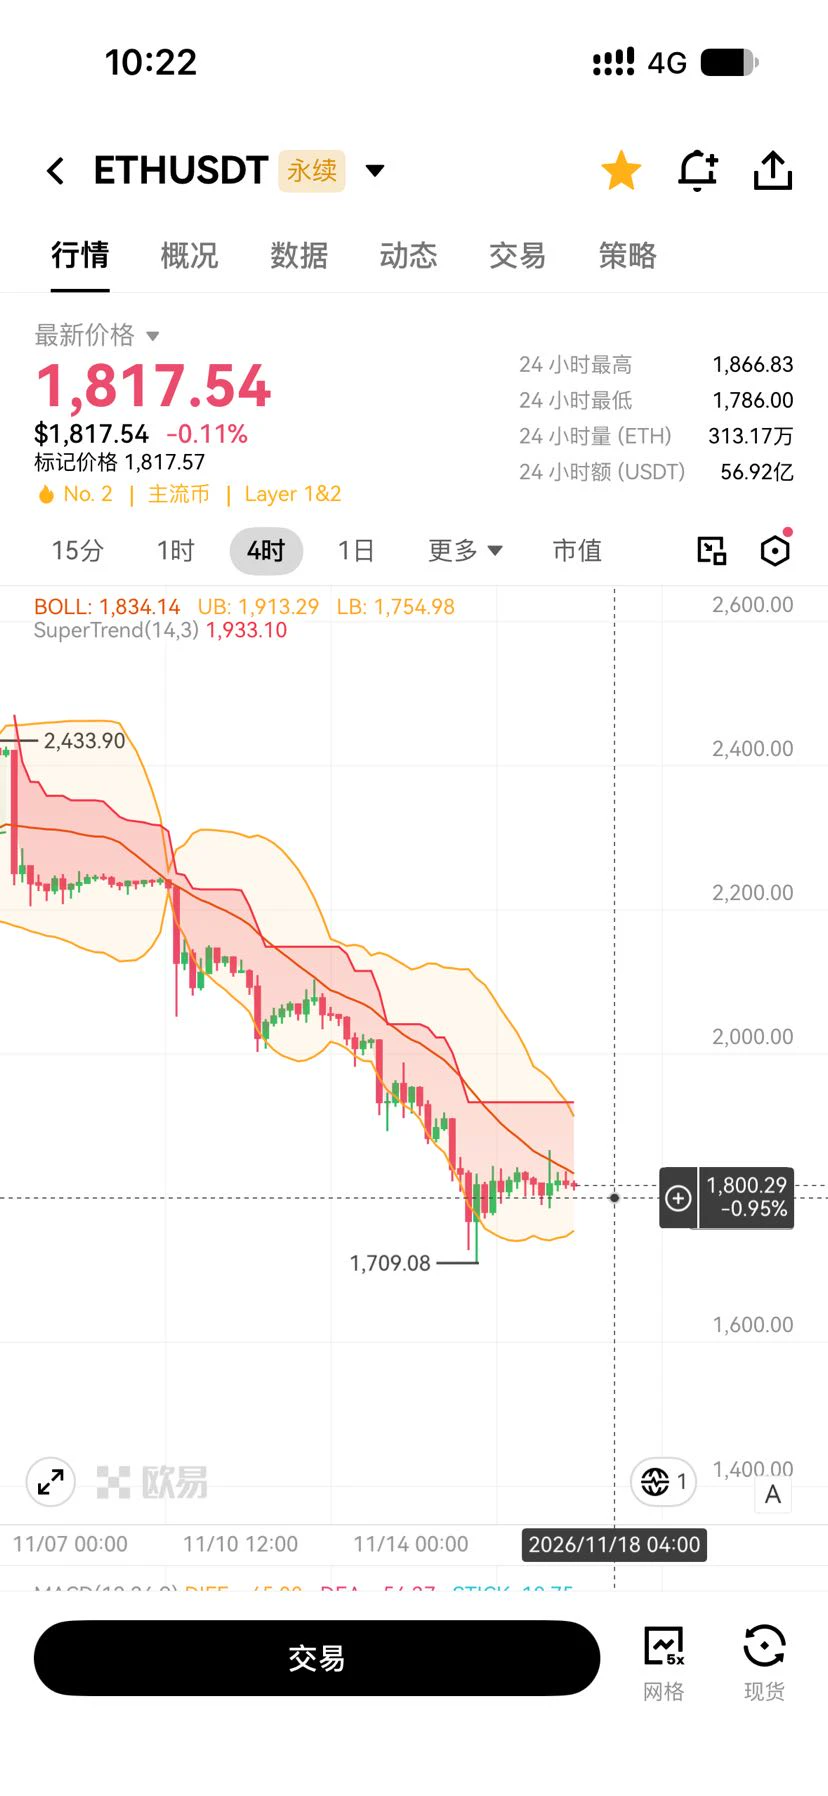
#ETH
There have been no major moves up or down over the past two days, and the market has entered a consolidation phase.
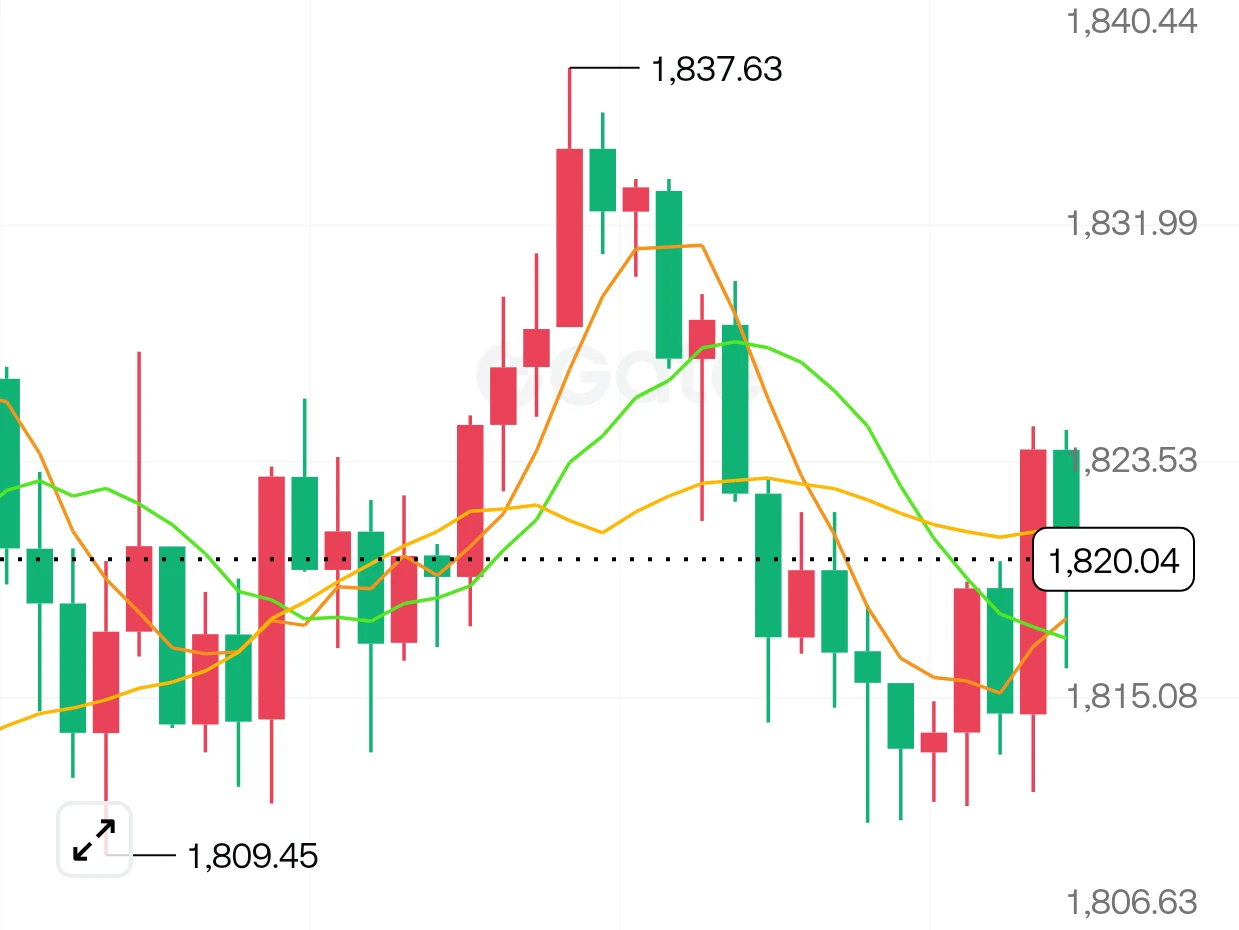
Since Sunday, the price has repeatedly fallen after touching around 1840, with each drop amounting to roughly 40 points. Market control remains as steady as ever. Trading during consolidation has become simple: just sell high and buy low. The current relatively narrow trading range is 1845—1785. If the price can move a little lower, to around 1745, and then move back and forth several times within the 1745—1840 range, allowing the overhead selling pressure and the support be
post-image
ETH-1.26%
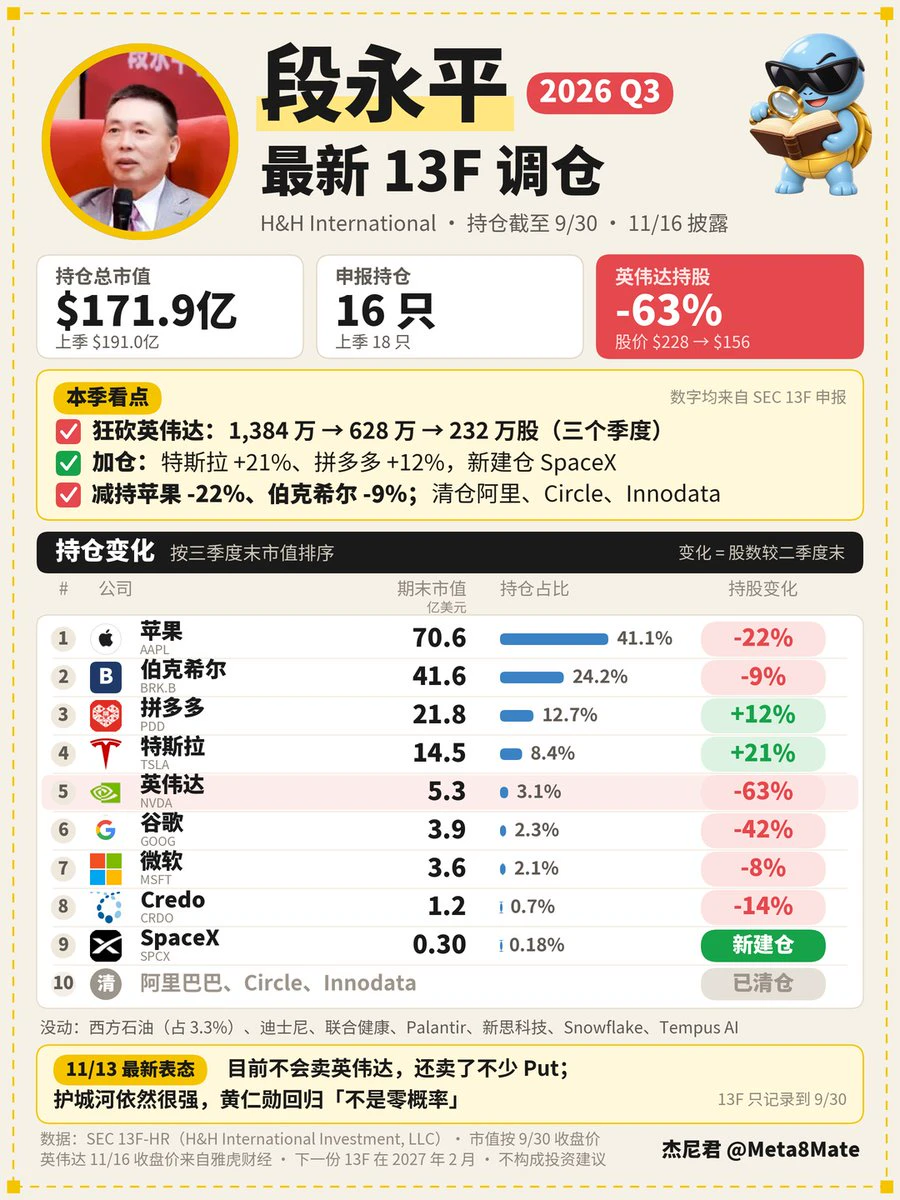
You’ve got to hand it to Dadao—
Nvidia really moves fast.
Duan Yongping’s latest 13F shows that in Q3, $NVDA was cut from 6.28 million shares to 2.32 million, a 63% reduction. He had held 13.84 million shares at the end of Q1.
At the end of September, $NVDA was still at $228. After Huang left, it’s now down to just $156.
Then last week, Duan said he wasn’t selling anymore—and had sold quite a few puts, waiting to buy back at even lower prices. Is he trying to have it both ways?
Selling shares at the top, selling puts at the bottom,
talking up the stock while unloading shares—
that’s Dadao’s
post-image
NVDA-4.11%
11.17 Market Analysis
ETH Strategy Reference Setup
Rebound range: around 1820–1850
Key level: 1880
First target: 1790, second target: 1740
ETH has ended its weak downtrend after bottoming at 1785. The Bollinger Bands have shifted from narrowing and flattening to opening upward, and the short-term trend has switched from weak consolidation to a relatively strong pattern. The price is now consolidating around 1820 to absorb the gains from the rapid rally. Overall, the strategy is to go long on pullbacks to support, while taking light short positions at resistance to trade a short-term pullback.�
post-image
BTC-0.65%
ETH-1.23%
Load More

Join 40 M users in our growing community

⚡️ Join 40 M users in the crypto craze discussion

💬 Engage with your favorite top creators

👍 See what interests you

Trending Topics

GateIPOAccessAnthropic

431.6K Views3.1K Discussing

Gate IPO Access Phase 3 features Anthropic (ANT), with USDT subscription interest starting from 100 USDT. Successful allocations will be delivered as real shares to Gate Stock Accounts. Indicative price: $70–$78/share Subscription: Nov 12–17 (UTC+8) Allocation is not guaranteed. Please manage risk accordingly.

Dr.HanOxfordUnionSpeech

327.7K Views1.7K Discussing

ANTPreMarketFuturesNowLive

355.6K Views3.6K Discussing
View More