Share your thoughts
placeholder
Article
The hand that set the stop-loss a few days ago trembled slightly; this morning, I realized that act of filial devotion had been unnecessary. During the repeated intraday swings, while everyone else was selling at a loss, I saw $OKB hold firmly at 96.30, with pullbacks never breaking the level and funds quietly entering. I said at the time that this was a position worth trying. As a result, today it surged straight to 113.82, delivering +444.41%—what a rush. This run was worth the wait. I’ve taken profit on 80% first, locking in the gains; I’ll move the stop-loss on the remaining 20% closer to
post-image
OKB+0.82%
ZEC+19.75%
XRP+0.64%
I didn’t chase $LIT when it surged during the day, as a long-term trendline was directly overhead and it would have been difficult to place a stop-loss after entering. I waited for it to pull back and regain stability before entering a long position based on the lower-timeframe structure.

After entering, it consolidated for a while. I didn’t rush to trade in and out; once the price moved a certain distance away from my entry zone, I first closed 80% to lock in the profit on the core position, leaving the remaining 20% to follow the trend.

After the breakout candlestick appeared, I first to
post-image
LIT-5.26%
SNDK+0.77%
BNB-1.87%
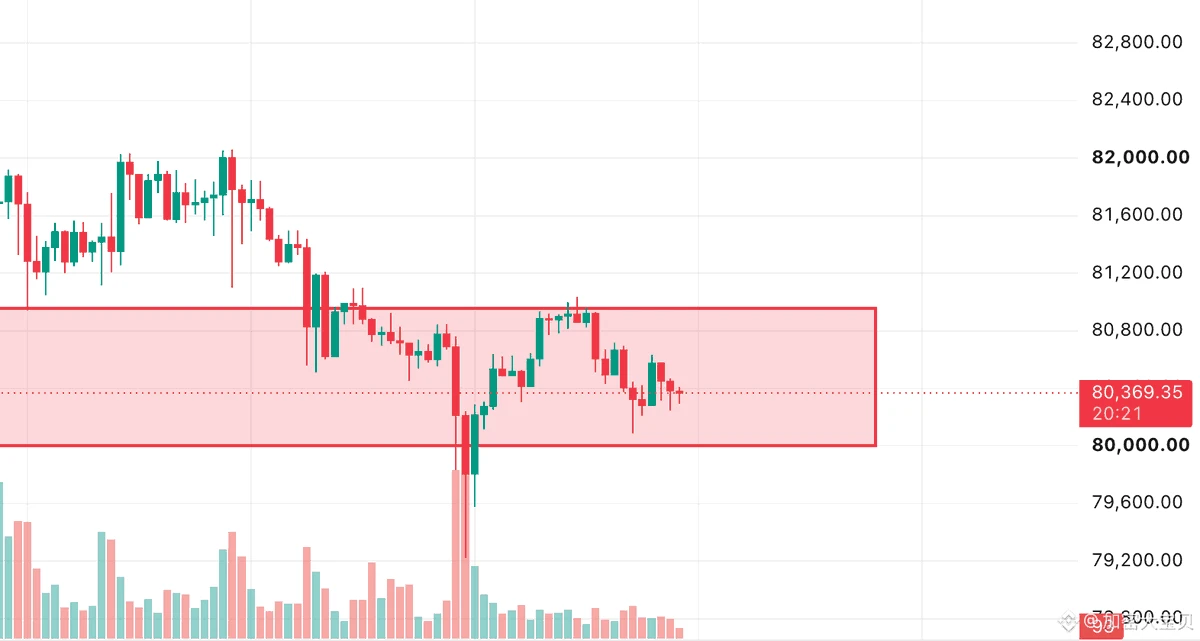
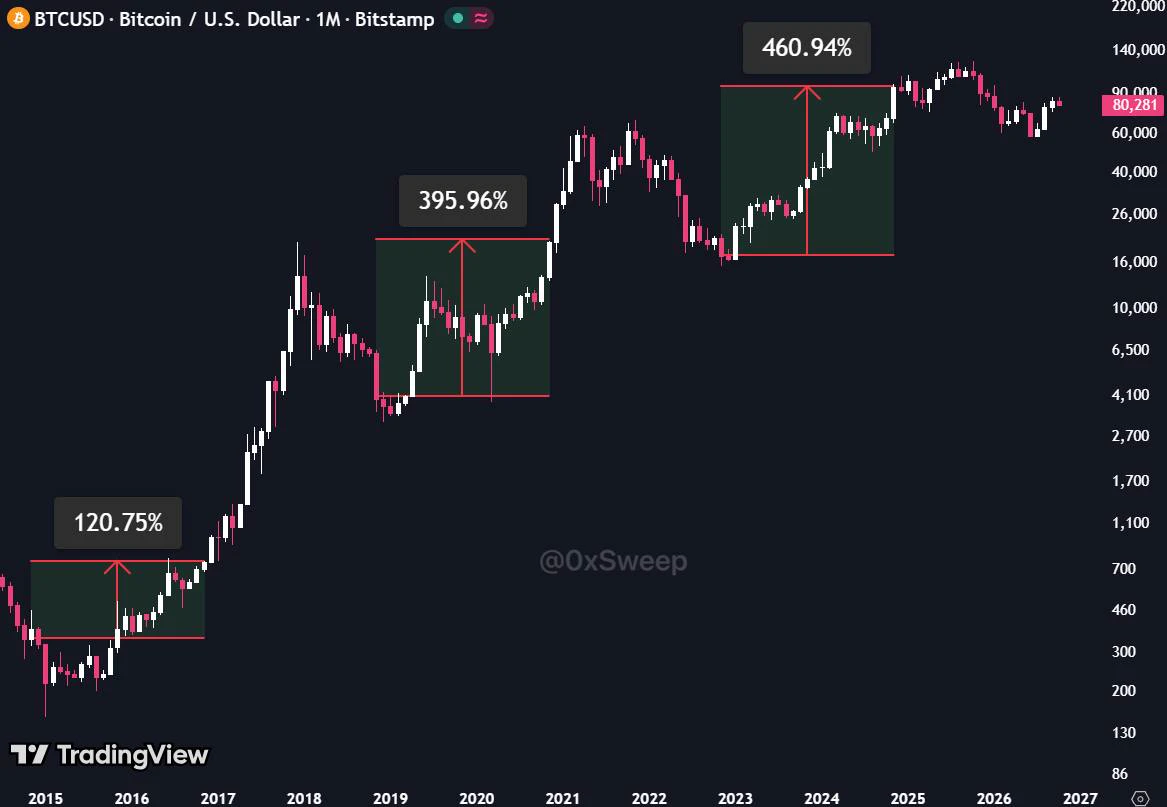
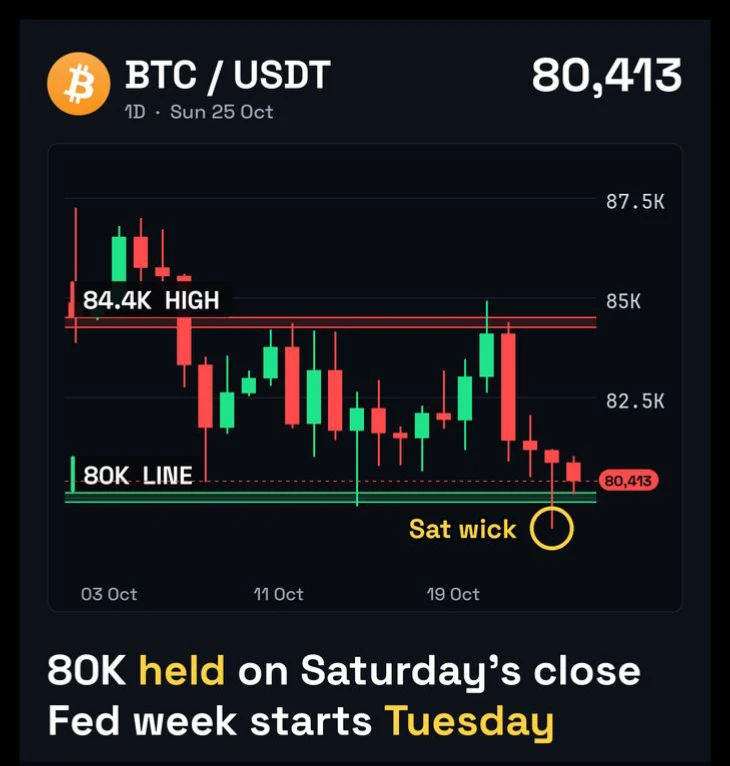
BTC and bears/bulls battle again at the $80,000 level
Bitcoin started this rally from its mid-August low of 62,681, rising sharply on expanding volume and reaching a high of 82,282.8, up more than 30%. After the surge, it pulled back. The current price is 79,958, fluctuating and consolidating repeatedly around the $80,000 level.

4-hour chart breakdown:
The Bollinger Bands are still opening upward overall. The middle band is at 80,074, with the current price pulling around the middle band, indicating intense competition between bulls and bears at this level. The upper band at 81,362 is the fi
post-image
BTC+0.71%
Financial News, Crypto Updates, Real-World Strategies
live-cover
LIVE1,442
$$COLLECT 24-hour drop of 29%, with trading volume surging to 38.8 million—this script is almost a carbon copy of the big bearish candle on May 19, 2021. The historical pattern is clear: the 6th–8th month after the halving is always a brutal shakeout. October 2020 was like this, and August 2016 was too. Each time, the main uptrend only began 30–60 days after the crash.
The current 0.0405 level happens to be the 0.618 golden retracement level of the previous rally. Yesterday’s sell-off occurred on exceptionally low volume, but trading value continued to expand, indicating that funds were buying
Proper capital management is crucial when trading options! Do not use more than 1.5x leverage at most. Here is some advice for everyone trading options!
📉 Three warning levels for the equity curve📈
Plot the account's net value as a line chart and monitor three levels:
1️⃣ Yellow line (10% drawdown): Stop adding to positions; only reduce, never add. Review the three most recent losing trades
2️⃣ Orange line (20% drawdown): Cut each position size in half; only trade the setups you know best. Return to normal only after two consecutive bullish candles
3️⃣ Red line (30% drawdown): Stay completel
post-image
Layout for Bitcoin, Ethereum, and Dogecoin
live-cover
LIVE3,660
  • 1
I originally wanted to cut my losses and sacrifice the flesh to heaven, but heaven never got its offering—the meat roasted itself. A few days ago, I was still staring at the chart before bed, worried and thinking this move was completely over, but in the middle of the night $ZEC gave the answer directly.
During the bottoming phase, I said that once the pullback held, buying pressure was quietly strengthening, so don’t let intraday decoys trick you into selling. Those who got in around 610.37 are now looking at a price of 1219.29, up +7085.23%—that’s a satisfying piece of meat, right? The key
post-image
ZEC+19.75%
XRP+0.64%
BTC+0.71%
$PI Once again, those clues are being spread for the thousandth time.
This, of course, is not a coincidence
The Beta System is shedding its old shell and will soon transform into its planned version, its ideal version
If you know, you know
PI-0.75%
Name that token $______
#memecoins
post-image
September 7 Jinman Gold Morning Review:
Spot gold on the 4-hour chart has formed a bottoming and rebound pattern. After falling from the previous high to a stage low of 4282.53, the price stabilized and rebounded. It is currently quoted at 4428.61, overall remaining in a consolidation and recovery phase following oversold conditions.
Going forward, focus on statements from Federal Reserve officials and developments in geopolitical tensions. Hawkish signals will pressure gold prices, while rising safe-haven sentiment could support the bottom. News will have a clear impact on short-term price mo
post-image
ETH+1.36%
BTC+0.68%
How to identify hundredfold- and thousandfold-return assets in a bull market
1. Choose the right track, with a high enough ceiling, great potential, and ample room for growth;
2. This year’s hot spots are the BTC ecosystem, ETH ecosystem, and SOL ecosystem;
3. Hundredfold-, thousandfold-, and ten-thousandfold-return assets have emerged in the BTC ecosystem, with clear profit-making opportunities;
4. The ETH and BSC ecosystems have performed fairly average, with no dark horses emerging for now and no clear profit-making opportunities so far;
5. Many coins in the SOL ecosystem have surged this y
post-image
BTC+0.68%
ETH+1.36%
SOL+3.20%
CORE+0.70%
Thank you for your help; my growth is entirely thanks to your support and encouragement.
post-image
9.7 Gold Morning Strategy
On the hourly chart, gold prices surged and then pulled back under pressure. After a rapid retracement, the decline slowed, and prices found support above the lower Bollinger Band. The lower Bollinger Band is gradually flattening. After the sharp short-term drop, a technical rebound is likely, while the pace of the decline has eased. Do not blindly chase short positions in the morning; focus on opportunities to stabilize after a pullback.
Key Levels
Resistance: 4450, 4470
Support: 4410, 4395
Strategy:
Go long after prices stabilize in the 4400–4415 range following a p
post-image
XAUT-0.19%
Everyone’s watching $SOXL /USDT at 123.67—but the 4h chart just whispered something nobody wants to hear.

$SOXL /USDT - SHORT

Trade Plan:
Entry: 123.45 – 123.89
SL: 125.78
TP1: 122.09
TP2: 121.03
TP3: 119.45

Why this setup?
Why now?
- 1D is stuck in a *range*, not a breakout—so longs above 125.78 are playing roulette.
- RSI (15m) at 48.66 = zero momentum, just dead air before the drop.
- ATR (1h) at 0.88 → tight coil, but our SHORT path to TP1 (122.09) is only 1.3% away—quickest win on the board.
- The alt setup (long) needs 127.89, but with confidence at 55%, that’s hope, not ed
SOXL+4.63%
Everyone’s staring at TRUMP’s 2.322—but the 4h chart is quietly building a trapdoor.

$TRUMP /USDT - SHORT

Trade Plan:
Entry: 2.315 – 2.329
SL: 2.388
TP1: 2.272
TP2: 2.239
TP3: 2.190

Why this setup?
Why now?
- 1D range + 4h SHORT bias = mean reversion, not breakout.
- RSI 15m at 50.82 = no momentum fuel; price is stalling mid-range.
- ATR 1h (0.0275) shows thin volatility—easy to slap down to TP1 (2.272) before news hits.
- Entry 2.322 with SL 2.388 gives you a 2.8:1 reward-to-risk if TP2 (2.239) prints.
- Confidence 55% isn’t screaming, but the range’s lower half is the path of
TRUMP-1.89%
September 7 Strategy Plan
Priority ranking, for regular followers only
Operation priority ranking
Priority 1: Go long on a pullback to 2498-2502
The win rate/risk-reward ratio is relatively balanced, making this the ideal long entry zone today.
Priority 2: Go long on a shallow pullback to 2510-2513
Suitable for a strong market, but since the current price is relatively high, keep the position light.
Priority 3: Chase long after a pullback following a firm hold above 2523
Only trade after a confirmed breakout; do not blindly chase near 2520.
Priority 4: Short under pressure at 2531-2535
A quick
post-image
ETH+1.38%
I was just about to go to the forum and rant, but then I saw my balance and thought, forget it—the market is always right. 😂
A few days ago, it was still barely holding on before bed. Every rebound seemed to lack that final push, while volume quietly shrank. At a level like this, not opening a short position would have been hard to justify. Entry reference: 0.17647. When I opened the chart this morning, the price had plunged straight to 0.04593, and the short position was already showing +1457.07% unrealized profit. This profit feels great. 🔥
Take profits steadily; don't get greedy for the l
post-image
SOL+3.18%
LAB-3.27%
TrendForce: Easing Notebook CPU Supply in 2H26 to Narrow the Full-Year Decline in Global Notebook Shipments
post-image
This was purely the market being in a good mood and casually tossing out some gold coins—one just happened to hit me on the head🍀. When I checked the market after lunch, the $TAO order book was already looking unusual, with funds quietly entering.
The price returned to around 225.0 and repeatedly held firm on declining volume. No one was willing to sell on the pullbacks, so I said just one thing: this level is worth trying to follow. Stronger buying pressure is the most honest signal—no need for too many tricks.
I just refreshed the price, and 262.3 has already been reached. +801.07% is more
post-image
TAO+11.79%
SNDK+0.77%
ETH+1.38%
Load More

Join 40 M users in our growing community

⚡️ Join 40 M users in the crypto craze discussion

💬 Engage with your favorite top creators

👍 See what interests you

View More