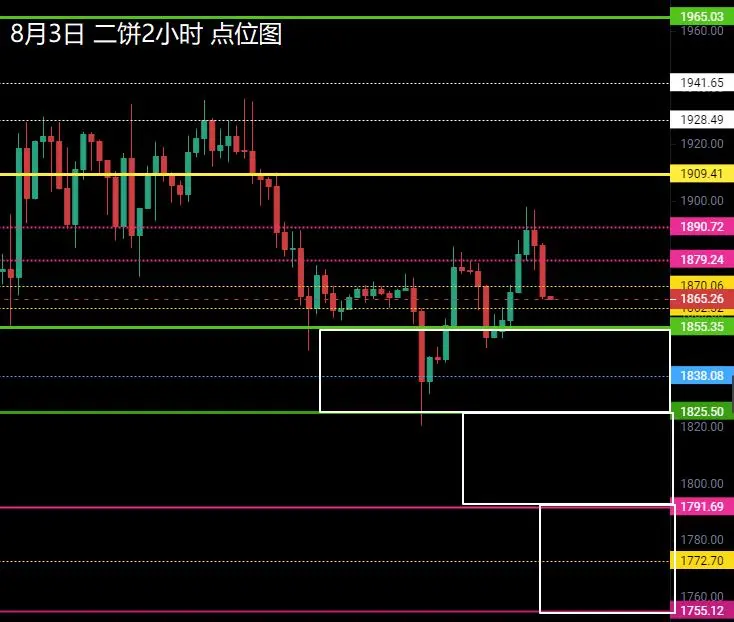
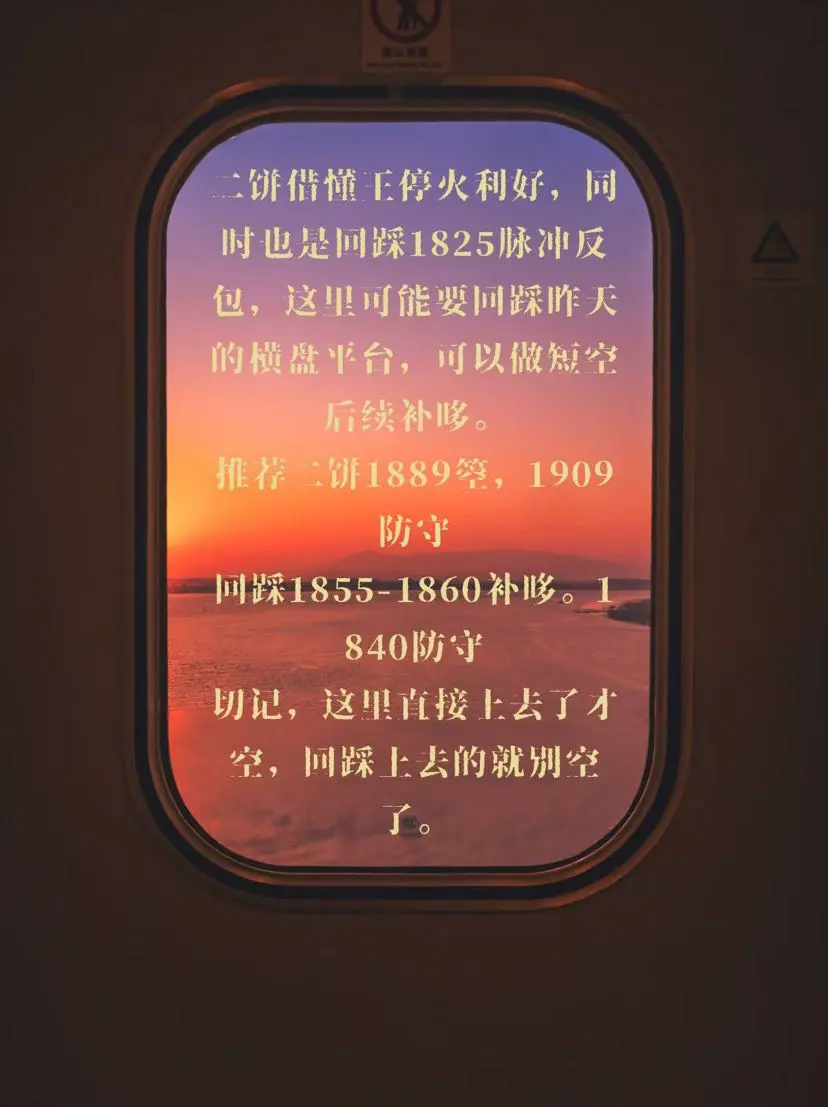
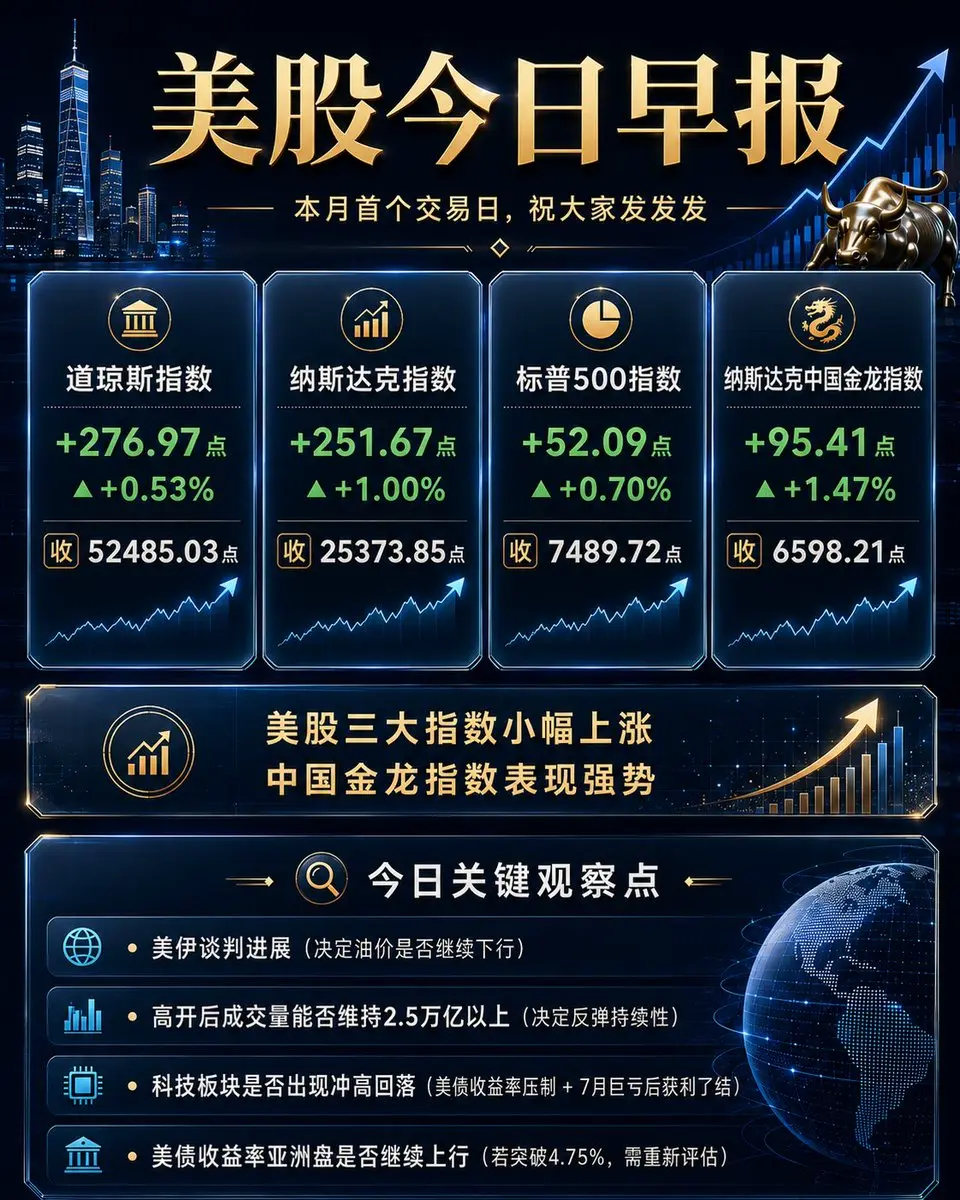
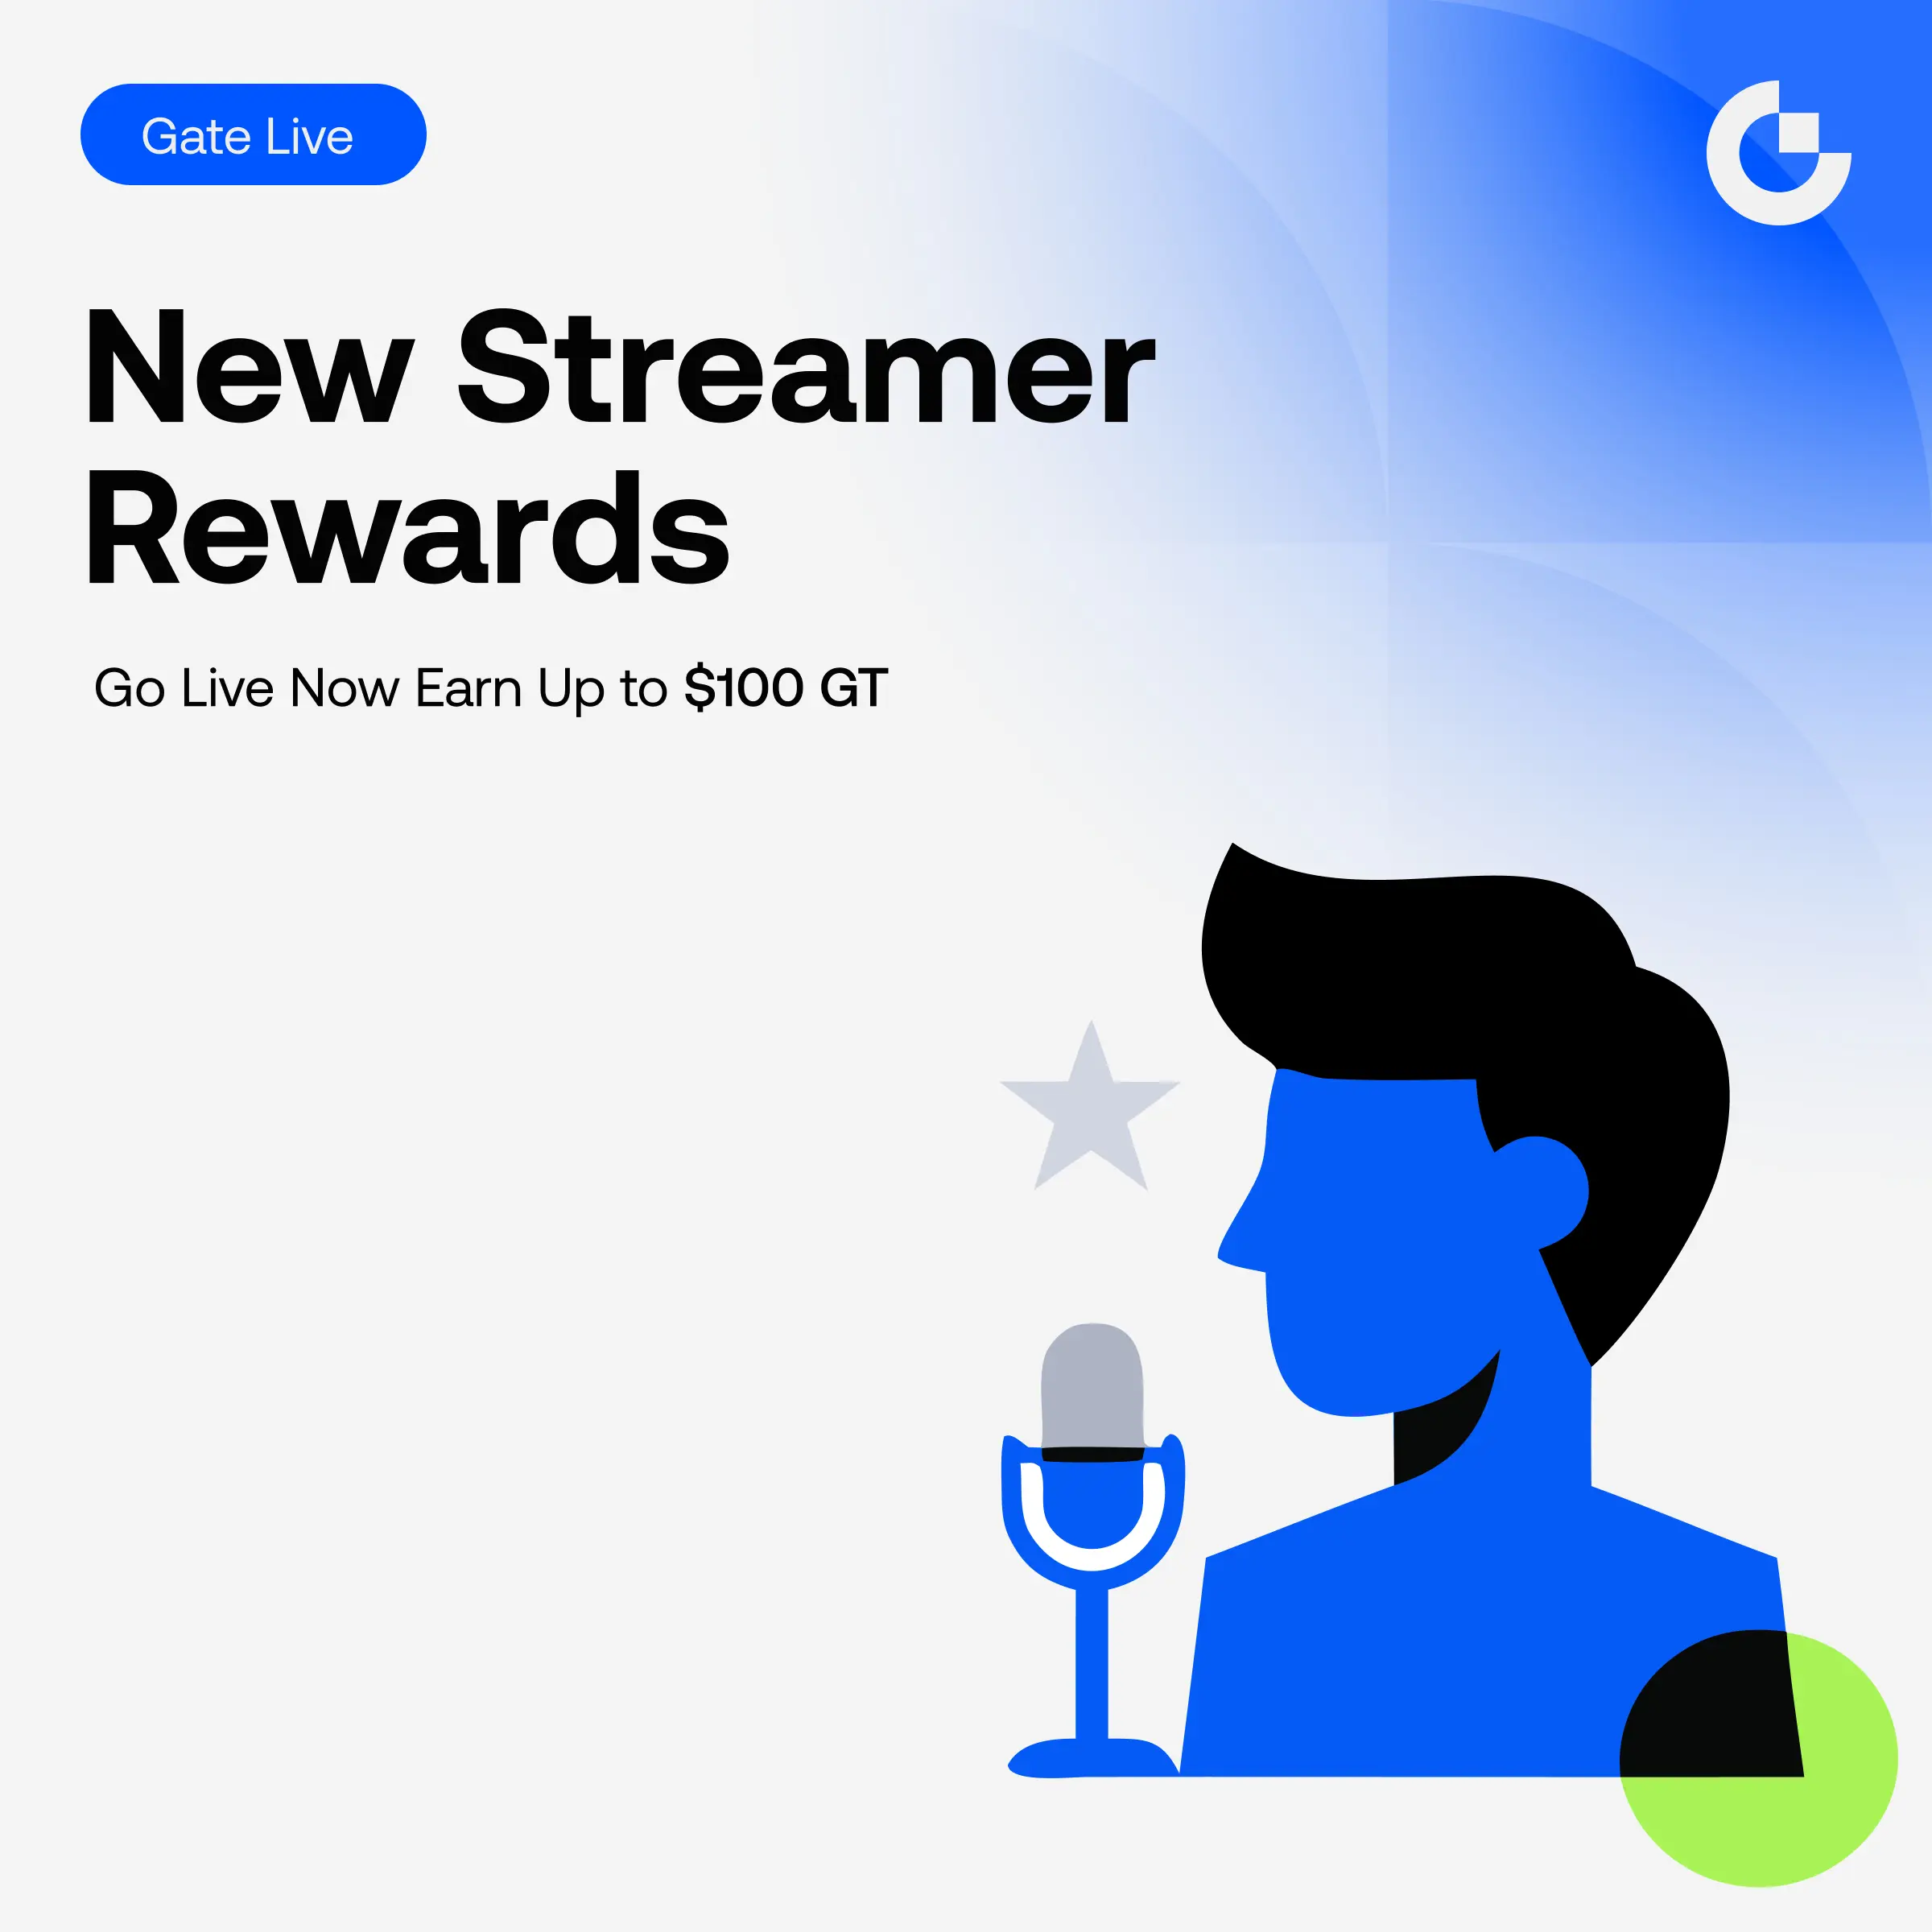
Share crypto content and earn up to 60% commissions through content mining.
placeholder
gatefun
A few days ago it was acting like it was dead, and today it directly delivers the result! 😎 The grinding bottom during the session really tested patience, but once this kind of consolidation breaks out, the satisfaction is real.
The night before last, I was closely watching the low-level support of $XAG . XAG was hovering around 57.47, and every time it dropped, it never broke through, meaning there were buyers underneath and selling pressure wasn't increasing. 📌
At that time, I signaled to go long—not because I saw a green candle and got excited, but because several factors lined up: a
XAG3.31%
BTC2.43%
ETH5.44%
View Original
post-image
  • Reward
  • Comment
  • Repost
  • Share
I must say, this plunge is truly satisfying! 🔥📉 During the grinding upward in the session, $ETH it looked like it wanted to push higher, but the more I looked, the more fake it seemed. The resistance above has been there all along, volume hasn't followed, and several pullbacks failed to hold. This kind of rebound is the easiest to mislead impatient people. When the market hadn't fully launched yet, I could see that ETH's support was clearly weak 👀 When the price was around 2312.49, I indicated to open a short, don't chase those upward moves without volume, wait for it to reveal itself. Now
ETH5.44%
BTC2.43%
SOL4.27%
View Original
post-image
  • Reward
  • Comment
  • Repost
  • Share
Honestly, this market is really messing with people. 🚨📉 A few days ago in the afternoon, $ATOM was still swinging high, and many people wanted to chase it since it wasn't dropping. I was more cautious instead—each rebound was weaker than the last, with clear resistance above.
While everyone was still waiting, I saw that ATOM's upward move lacked sustained buying volume and momentum wasn't there 👀 This wasn't strength; it was forced support. So I suggested treating it as a bearish scenario and opened a short position around 2.094.
Then when I checked the market this morning, the price had a
ATOM1.24%
BTC2.43%
ETH5.44%
View Original
post-image
  • Reward
  • Comment
  • Repost
  • Share
#BEAT $BEAT Another surge in 15m, current price $3.214, 24h +9.58%.
Don't rush to chase this stock. The short-term push is very aggressive, with funds flowing in along the trend.
Risk-wise, currently 31% are shorting and 69% are going long. For a pullback, we need to see whether the downside can hold.
Both charts are below: the first shows the analysis levels, the second shows the web K-line.
$3.1336 must not be broken, or risk will spread; $3.3104 is the first level of recovery.
BEAT10.97%
View Original
post-image
  • Reward
  • Comment
  • Repost
  • Share
Boom, this smash really woke up the market!📉🔥 A few days ago, before bed $GMT was still stubbornly holding high, many were eyeing that little bounce trying to rush in. It didn't sit right with me: volume wasn't following, support felt weak, and any upward push would crumble.
Before the market had fully taken off, I saw GMT failing multiple attempts to break through, and judged this wasn't a strong continuation—more like a high-level trap. So per plan, I opened a short 👀 around 0.01044.
Now the price is at 0.00765, with PnL showing +1286.97%. This profit feels really satisfying ✅💰 The grin
GMT2.82%
BTC2.43%
ETH5.44%
View Original
post-image
  • Reward
  • Comment
  • Repost
  • Share
Don't say, this wave is really strong! 🔥 A few days ago before sleep, it was still grinding back and forth in a small range. Many people were about to give up watching it. Then the market started, $BLEND directly revealed the long position rhythm🚀
Before the market fully launched, I was watching the support of BLEND. It repeatedly retested around 0.05612 without breaking, there were buyers underneath, and selling pressure became lighter. I suggested going long at that time, not out of excitement, but because the structure wasn’t broken yet👀📌
Now the price has come to 0.06457, the gain is
BLEND-4.20%
BTC2.43%
ETH5.44%
View Original
post-image
  • Reward
  • Comment
  • Repost
  • Share
$US Signal】Funds provide bottom support, 1H pullback confirmation
$US Near 0.0172, orders are thick, buy-side continues to accumulate, 1H quickly bounced after pulling back to EMA20. Market depth imbalance is 7.27%, Bid/Ask 1.16 shows buyers actively taking orders. 4H MACD bullish momentum is shrinking but price hasn't broken the middle band, 1H death cross hasn't triggered selling pressure, short position funding rate of 0.026% continues to rise, short-term trading room still exists. Stop loss is set tight near key support, risk-reward ratio is moderate, worth taking a shot.
🎯Direction: Lon
US36.19%
BTC2.38%
ETH5.33%
SOL3.94%
View Original
  • Reward
  • Comment
  • Repost
  • Share
Not gonna lie, this wave really showed up! 🔥 When I opened the screen this morning, $JTO the long position instantly wiped out the drowsiness. A few days ago in the afternoon it was still grinding the bottom, and today it delivered the answer 🚀
At that time, JTO was repeatedly testing around 0.6237. My focus was not on whether it would rise immediately, but whether the key level was broken and whether buying pressure had strengthened. When the chart hadn't fully launched yet, the pullback held steadily, and selling pressure didn't continue to increase, so I signaled to go long 📌
Some money
JTO-3.66%
BTC2.43%
ETH5.44%
View Original
post-image
  • Reward
  • Comment
  • Repost
  • Share
The last look before bed, and I wake up to the answer! 🚀 This kind of market grind tests everyone's patience, but a few days ago before bed, when I was watching $ZBT , my focus was on whether the low-level structure was broken 👀
The price was oscillating around 0.11351, with retracements holding, buying gradually becoming active, and selling pressure starting to ease. I judged this wasn't a casual watch-and-see market 📌 So I signaled to go long and let it reveal its own direction.
Good positions are waited for, not chased.
Now from 0.11351 to 0.14394, return +1291.96%. The grind was real, b
ZBT-7.58%
BTC2.43%
ETH5.44%
View Original
post-image
  • Reward
  • Comment
  • Repost
  • Share
$BTC Signal】Long | 4H Bullish + 1H Pullback to Long
$BTC Depth imbalance ratio 1.63, buy orders stacked heavily at 61300. 1H MACD histogram continuously contracting, selling pressure weakening after high-volume contraction. 4H Bollinger Bands upper 62300, middle 59900, price running near the middle band, clear capital support characteristic. Current risk-reward ratio 1.5, risk is manageable.
🎯Direction: Long
⚡Entry/Limit Order: 61340.43 - 61525.00
🛑Stop Loss: 60909.75
🚀Target 1: 62447.88
🚀Target 2: 62909.31
🛡️Trade Management:
- Execution Strategy: After reaching Target 1, reduce 50% pos
BTC2.43%
View Original
post-image
  • Reward
  • Comment
  • Repost
  • Share
BTC Market Structure and Ethereum Price Overview
gate liveLIVE
768
live-coin
  • Reward
  • Comment
  • Repost
  • Share
This one came out, the chart just stopped pretending! 🚀 Opening the chart this morning, it really felt like staying up late was worth it. A few days ago, the afternoon was still grinding in a narrow range, and many people were tempted to give up, but I was watching whether the bottom would break and whether the pullback could hold 👀
Before the chart fully launched, $ONDO was testing around 0.3109 repeatedly, the support under ONDO was always there, and selling pressure didn't continue to increase. I signaled to go long at that time, looking at the upside space after the low didn't break 📌
ONDO1.14%
BTC2.43%
ETH5.44%
View Original
post-image
  • Reward
  • Comment
  • Repost
  • Share
Honestly, this market really knows how to mess with people. 🚨📉 A few days ago in the afternoon, $ZEC was still grinding back and forth; when many people saw it not dropping, they wanted to chase, but I felt something was off—there was no volume on the push up, the rebound lacked strength, and as soon as it met the resistance area, it turned weak.
While everyone was still watching, I focused on ZEC’s ability to take over; the result was very clear: when it pulled back, no one picked it up, and the buy-side demand wasn’t hard enough, so I executed a short near 569.28 👀📌
Now it has moved fro
ZEC4.45%
BTC2.43%
ETH5.44%
View Original
post-image
  • Reward
  • Comment
  • Repost
  • Share
Honestly, this chart is really messing with people. 🚨📉 A few days ago in the afternoon $DOT was still fluctuating back and forth, looking like a breakout on the surface, but what I actually saw was a volume-less pump with insufficient bids—the price softened as soon as it hit resistance above.
While everyone was still waiting, I was watching DOT's rebound strength, noticing that every dip never continued—buying pressure refused to step in, and as soon as sell pressure appeared, it shrank downwards 👀 At that time, I advised not to chase longs, and wait until it couldn't push higher before
DOT1.81%
BTC2.43%
ETH5.44%
View Original
post-image
  • Reward
  • Comment
  • Repost
  • Share
Honestly, this market really knows how to mess with people. 🚨📉
A few days ago in the afternoon, $KGEN was still slowly creeping at highs. Many people thought it would keep pumping, but I saw only two words: weak.
While everyone was still watching, I saw that KGEN's upward move lacked sustained buying, volume couldn't keep up, and the bounce turned soft as soon as it hit resistance 👀 This isn't strength, it's insufficient support. My advice at the time was simple: don't chase longs, wait until it can't pump anymore, then shorting offers better value.
Entry around 0.20275, now at 0.177
KGEN1.90%
BTC2.43%
ETH5.44%
View Original
post-image
  • Reward
  • Comment
  • Repost
  • Share
Seriously though, this chart really knows how to mess with people. 🚨📉 A few days ago in the afternoon, $SIREN was still wavering up there, looking like it would continue to push up, but every time it went up it fell short, getting weaker the more it rubbed.
Before the chart had fully started, I saw that SIREN's volume wasn't following, the upper resistance never let up, and the rebound didn't have sustained buying 👀 So the thinking at the time was very clear: don't chase false strength, wait for a short position, then execute a short.
Now it's gone from 1.20261 to 0.03416, +2382.52% alread
SIREN-0.96%
BTC2.43%
ETH5.44%
View Original
post-image
  • Reward
  • Comment
  • Repost
  • Share
GM ,Market update
gate liveLIVE
974
live-coin
  • Reward
  • Comment
  • Repost
  • Share
Woke up and immediately got my attention! 📉😎🔥 A few days ago in the afternoon $SAHARA was still pretending to be stable, but I saw it clearly: pressure from above, no support below, the price would turn back as soon as it hit a critical level, the whole rhythm was obviously weak.
While the market was grinding a bottom, I kept my eyes on SAHARA, seeing that the rebound had no follow-through, buying pressure wasn't strong, and every upward move fell just short 👀 At times like this, I don't chase longs; instead, I prefer to follow the short-side rhythm, so I opened a short position near 0.03
SAHARA3.47%
BTC2.43%
ETH5.44%
View Original
post-image
  • Reward
  • Comment
  • Repost
  • Share
#BASED $BASED 15m This drop is a bit aggressive, current price $0.1015, 24h -20.41%.
This level is quite critical, the short-term drop is relatively urgent, don't rush to catch it.
However, one thing: the long/short positions of large players are 56:44, clearly leaning long. The key level wasn't held, so the rhythm may oscillate.
Look at the two charts below together: first look at the key level, then look at the 15m candlestick rhythm.
If $0.09846 is not broken, the structure still has a basis for continuation; only after passing $0.10404 will the upside space open up.
BASED-21.21%
View Original
post-image
  • Reward
  • Comment
  • Repost
  • Share
Don't rush, this wave of shorts really set the rhythm! 🚨📉
A few days ago in the afternoon, everyone was watching the small rebound of $ACT , but what I saw was the other side: the rebound lacked strength, it fell back as soon as it hit the upper level, buying didn't follow through, and the chart became more and more fragile as it rose.
While everyone was still waiting and watching, when ACT was around 0.01124, I judged that no one would buy into it up there, and a hard push would easily turn into a bull trap, so at that time I was more inclined to execute a short, not chasing that fake stren
ACT-2.66%
BTC2.43%
ETH5.44%
View Original
post-image
  • Reward
  • Comment
  • Repost
  • Share
Load More

Join 40 M users in our growing community

⚡️ Join 40 M users in the crypto craze discussion
💬 Engage with your favorite top creators
👍 See what interests you
  • Pinned