








Share your thoughts
placeholder
Article
$NVDA NVIDIA's recent price action has been range-bound at high levels, with an overall strong trend and increased volatility, but on the weekly timeframe, it has not seen a truly one-way, straight-line rally or sharp decline.
Based on the latest price action, NVIDIA shares are trading around $230, close to the 52-week high of $236.54, indicating that the bullish trend remains intact, while resistance above is also clearly evident.
The market remains broadly optimistic about its 12-month price target, but short-term funds are more focused on whether the stock can hold the $228–$230 range and c
NVDA+0.87%
$NVDA $TSLA $SPCX These three stocks have the greatest potential to turn bullish towards the end of the year.
NVDA+0.87%
TSLA-5.96%
SPCX-1.19%
A few days ago, I placed a limit order for $ZEC , which filled at around 828.40. I wasn’t expecting much, but when I woke up, I found that the market had already started moving in the direction I expected. After confirming that the candlesticks and volume were moving in sync, indicating that the upward move was not weak, I held the long position and observed.
After the price surged to the key level, a rapid wick appeared, and short-term divergence began to increase, reminding me not to get greedy. Without clinging to all the unrealized profits, I took profit on 80% first and moved the protectiv
post-image
ZEC+0.82%
BNB+6.62%
SOL+1.43%
This rebound in $LIT has honestly been stronger than I expected. After the earlier wick swept out the stop-losses on several of my long positions, the price pulled back up and firmly reclaimed the key level. But compared with predictions, I care more about how to respond. With unrealized profit reaching +1175.49%, I took profit and exited 70% of the position first, and moved the protection level on the remaining 20% above the entry price. The reason is simple: the higher it goes, the more we need to watch out for false breakouts and profit-taking.

The price is now around 4.752. As for wheth
post-image
LIT-2.38%
ADA+4.03%
ZEC+0.82%
This return is making me feel anxious, afraid the market will catch on tomorrow and blacklist me. When it plunged intraday, $IN ’s rebounds grew weaker each time, with heavy resistance overhead. I opened a short position around 0.09355, set my protection, and watched the show.
Now at 0.03454, +3036.7% is sitting in my account. If you’re not confident in a token, taking a look keeps you clear-headed; buying a position makes you foolish. I took this move cleanly 🕶️.
Here’s the take-profit plan for everyone: bank 80% first, and move the stop-loss on the remaining 20% to the entry price. Let it r
post-image
IN+0.12%
ZEC+0.82%
SOL+1.43%
Everyone’s staring at the 1D range, but the 4h clock just struck midnight for $MU /USDT.

$MU /USDT - SHORT

Trade Plan:
Entry: 1015.04 – 1016.60
SL: 1025.51
TP1: 1008.56
TP2: 1003.71
TP3: 996.45

Why this setup?
- RSI on the 15m is already at 45.18—that’s not oversold, that’s a bull trap losing its breath.
- With ATR at 3.10 on the 1h, the move down from 1015.82 to TP1 (1008.56) is just 2.3x the average hourly range—easy prey.
- The “Armed” status means the trigger is live; we don’t need a trend flip, just a range rejection.
- Why now? Because the 1D is sideways, and sideways always
MU+0.55%
#Bots I'm trading MEMECOINUSDT with the Futures Grid bot on Gate. Join me!
post-image
I originally just wanted to mooch a breakfast, but the market ended up making dumplings out of me for half a year. I opened the charts this morning, and before my eyes were even fully open, I saw the price bubbling up on its own. A few days ago, while watching the market in the early hours, $TAC had been moving sideways at the bottom. Everyone was waiting and watching. I stared at the order book for a while and saw funds entering slowly but steadily, with small orders constantly providing support at the bottom. In situations like this, I don't hesitate—I reached in and bought some around 0.002
post-image
TAC-4.39%
ZEC+0.82%
LAB+1.71%
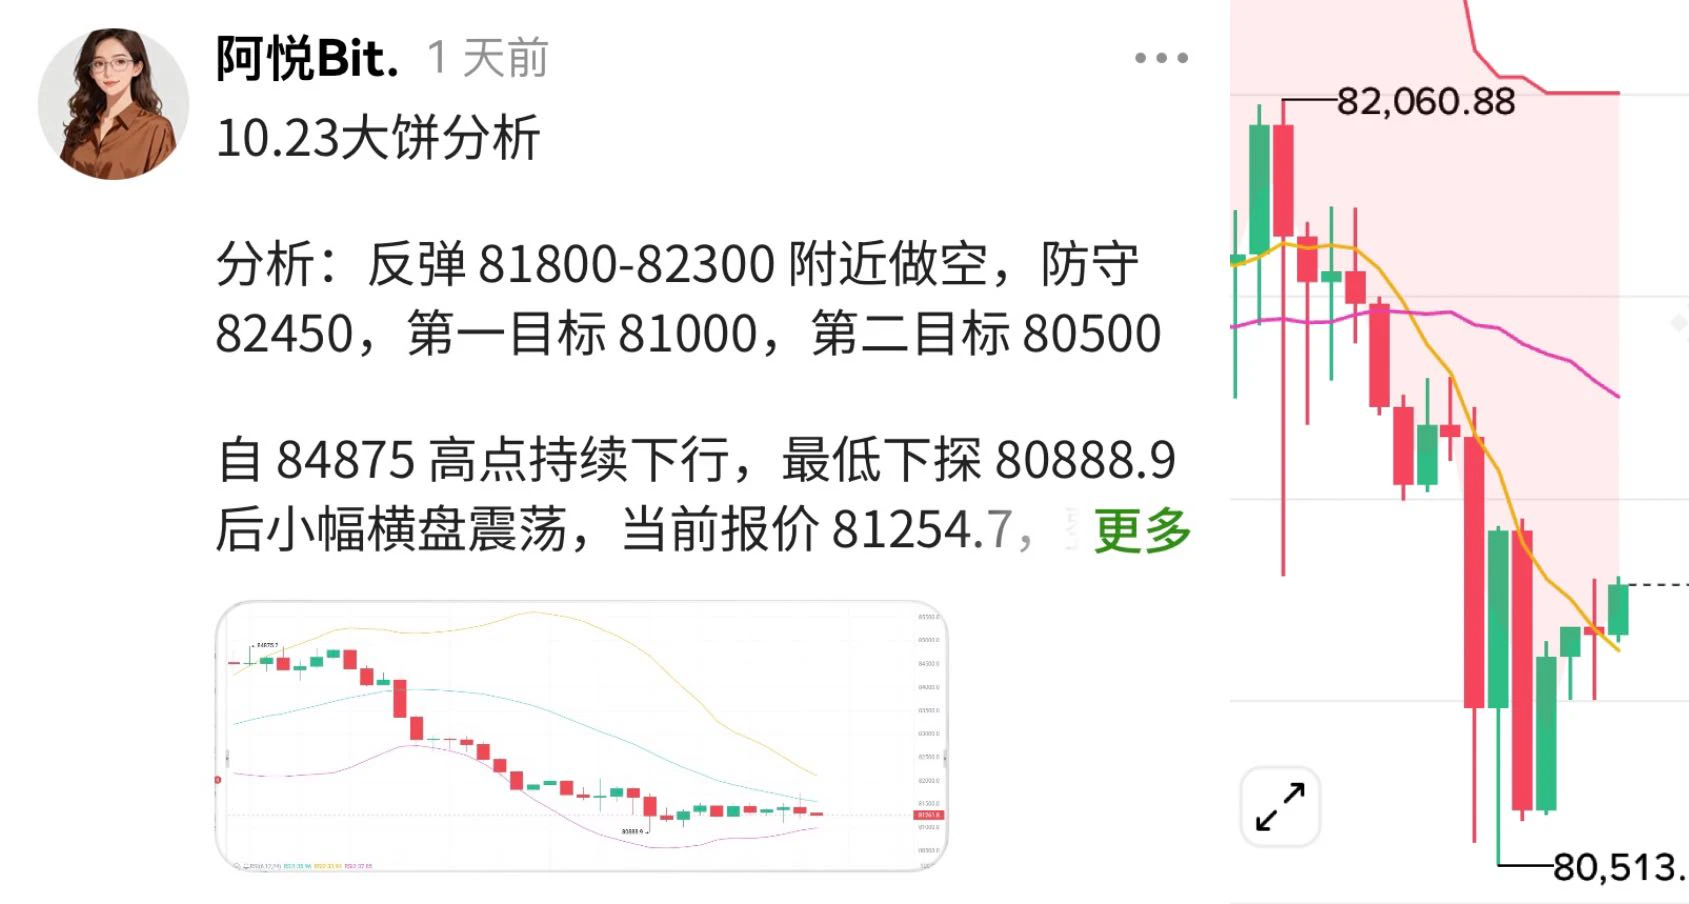
K-line pattern: The recent price rebounded sharply from the low of 62,508.3, reaching a high of 82,279.9, and currently stands at 79,874.2, consolidating at elevated levels. The latest candlestick has a relatively small body, with its upper shadow near the previous high, indicating selling pressure overhead.
· Technical indicators
· MACD: DIF (3,246.0) is below DEA (3,423.8), with a negative histogram value (-355.6). A death cross has formed, indicating weakening upward momentum and pullback pressure.
· KDJ: The K value is 87.3 and the D value is 86.9, both in the overbought zone (>80), in
AI
Which company has the best Code Arena WebDev AI model end of September?
OpenAI
82%1.21x
Anthropic
24%4.17x
$14.89K 24H+14 more
BTC+0.34%
ETH+1.40%
Everyone’s staring at HYPE’s 4h breakout, but the 15m RSI whispered something they missed.

$HYPE /USDT - LONG

Trade Plan:
Entry: 85.065 – 85.369
SL: 83.755
TP1: 86.314
TP2: 87.045
TP3: 88.142

Why this setup?
Why now? The 1D trend is bullish, yet the 15m RSI (43.91) shows a coiled spring—not exhaustion. With ATR at 0.609 on 1h, volatility is priming for a squeeze. Entry zone 85.065–85.369 is the last cheap ticket before TP1 at 86.314. Confidence at 95 means the market is begging for a long, but only if you respect the 83.755 invalidation.

Debate:
Is this dip to 85.2 the gift, or are we
HYPE+1.07%
Everyone’s watching $MU /USDT at 1017—but the 4h chart just flipped a silent sell signal.

$MU /USDT - SHORT

Trade Plan:
Entry: 1016.31 – 1017.79
SL: 1026.32
TP1: 1010.10
TP2: 1005.47
TP3: 998.52

Why this setup?
Why now?
- 1D trend is *range*, not breakout—so longs above 1017 are chasing air.
- RSI (15m) at 51.46 shows zero momentum; the bounce is already stalling.
- ATR (1h) = 2.97 means volatility is compressed—perfect setup for a snap to TP1 at 1010.10.
- Confidence 77.4% with entry zone 1016.31–1017.79—we’re inside the kill box right now.

Debate:
If price taps 1017.79 and re
MU+0.55%
$ESPORTS , hurry up and go to zero—delist it.
post-image
ESPORTS-2.71%
$FHE Signal】long: 1H volume-backed dip and support + 4H high-level consolidation
$FHE Current price 0.1172. After rising to 0.1408 on the 4H chart, the price pulled back, interrupting the bulls’ proactive advance. The 1H MACD bearish histogram is expanding, indicating short-term selling pressure is being released. Buy orders are densely stacked around 0.1160, while the 1H Bollinger lower band is at 0.0990. The latest candle closed with a lower wick, with clear wick-buying action appearing around 0.1155.
🎯Direction: long
⚡Entry/limit order: 0.116848 - 0.117200
🛑Stop-loss: 0.116028
🚀Target
FHE+11.55%
BTC+0.31%
ETH+1.41%
SOL+1.39%
Everyone’s watching Bitcoin—but the quiet killer on 4h just flashed a 77% short signal.

LTC/USDT - SHORT

Trade Plan:
Entry: 54.32 – 54.62
SL: 56.31
TP1: 53.09
TP2: 52.17
TP3: 50.78

Why this setup?
- LTC/USDT is stalling at 54.47 with a daily range—no momentum to break higher.
- ATR (0.59) is tight, but RSI 15m at 50.91 shows zero buying pressure—just dead air before the drop.
- Why now? The 1D trend is range-bound, and price is rejecting the upper band. TP1 at 53.09 is a 2.5% scalp; TP3 at 50.78 is the real prize if 51.35 support cracks.
- The clock is ticking: this setup waits for
BTC+0.31%
LTC+6.42%
$1000 to $100,000 Crypto Trade Challenge Today
live-cover
LIVE1,407
$SKYAI /USDT is setting up for a move that could invalidate 95% of traders' hopes.

$SKYAI /USDT - SHORT

Trade Plan:
Entry: 0.06031 – 0.06093
SL: 0.06363
TP1: 0.05836
TP2: 0.05686
TP3: 0.05460

Why this setup?
Why now? The 4h bias is SHORT at 95% confidence, and the daily trend is bearish—this isn’t a guess. Price refs at 0.06062, with immediate downside targets staring at TP1 (0.05836) and TP2 (0.05686). The 15m RSI (54.35) shows only a weak bounce, not a reversal. ATR (0.001254) is tight, meaning the breakout is coiling—not stalling. If we lose 0.06031, the path to invalidation (0.05821)
SKYAI+6.53%
Stop scrolling if you think ZEC is dead—this 95% confidence signal says otherwise.

$ZEC /USDT - LONG

Trade Plan:
Entry: 1027.77 – 1035.19
SL: 995.83
TP1: 1058.22
TP2: 1076.04
TP3: 1102.78

Why this setup?
- 4h timeframe is **Armed LONG** with 95% confidence—that’s rare.
- 1D trend is bullish, and 1h RSI (66.37) shows momentum building, not overheated.
- Entry zone: 1031.48 (low 1027.77–high 1035.19). TP1 1058, TP2 1076, TP3 1102.
- Why now? Price is squeezing above recent ATR (14.85) volatility—breakout fuel is loaded.

Debate:
Is ZEC front-running a privacy narrative revival, or w
ZEC+0.82%
Nobody’s watching ADA while it quietly sets up a trap at 0.2191—are you the exit liquidity?

ADA/USDT - SHORT

Trade Plan:
Entry: 0.2185 – 0.2197
SL: 0.2245
TP1: 0.2150
TP2: 0.2123
TP3: 0.2083

Why this setup?
Why now?
- 4h bias is SHORT with 55% conviction, but the 1D trend is *range*, meaning this isn’t a breakout—it’s a rejection play.
- RSI 15m at 49.56 = zero momentum, so price is drifting into the kill zone (0.2185–0.2197) without buyers.
- ATR 1h (0.0023) is thin—low volatility means stop hunts are cheap. Target TP1 at 0.2150 before the real move.
- Invalid only if we lose 0.
ADA+3.92%
Load More

Join 40 M users in our growing community

⚡️ Join 40 M users in the crypto craze discussion

💬 Engage with your favorite top creators

👍 See what interests you

View More