
Share your thoughts
placeholder
Article
Short at the upper band on the 5-minute chart and repeatedly trade down to the lower band—let’s go!
Everyone, open a trade and profit immediately—if you don’t believe it, come see!
post-image
Smart money is quietly stacking $HOME /USDT while the daily trend screams bearish

$HOME /USDT - LONG

Trade Plan:
Entry: 0.0053 – 0.0053
SL: 0.0051
TP1: 0.0055
TP2: 0.0056
TP3: 0.0057

Why this setup?
Why now? The 1h ATR at 0.000066 shows volatility is compressed enough for a sharp move, and the 15m RSI at 24.1 signals extreme oversold exhaustion. The daily trend remains bearish, which means this long is a contrarian pick against the higher-timeframe bias. The entry is locked at 0.0053, with TP1 at 0.0055 and TP2 at 0.0056 offering two clear targets. The invalidation level sits at 0.0058,
HOME-3.11%
I wasn’t even expecting to break even, but it actually took me straight into profit. This service is seriously on point. It’s not that my skills are exceptional—the market move itself handed the bears a red envelope.
When the price plunged intraday, many people were busy cutting their losses, but I felt this drop had already made the choice for the market. Because before that, I had already placed my short: the rebound was weak, the bull-trap signals were strong, and there was no volume on the chart. No matter how I looked at it, it seemed like nothing more than a fakeout.
The short opened at
post-image
SOL-1.67%
LAB+13.27%
The 10-year U.S. Treasury yield breaking above the 5% threshold is all but certain. Where is the real eye of this global bond-market storm?
Put bluntly, the bond-market bloodbath may appear to be driven by surging oil prices and an upside PPI surprise, but the more painful truth is that the Treasury is robbing Peter to pay Paul.
The Treasury’s $5.2 billion bond buyback was intended to inject liquidity into the market, but demand proved dismal: subscription orders totaled only half the offering size, directly crushing what little confidence remained in the market. With the massive deficit hole
post-image
Insiders are calling this the quietest setup before ZEC explodes past 1180.

$ZEC /USDT - LONG

Trade Plan:
Entry: 1099.42 – 1111.92
SL: 1045.65
TP1: 1150.68
TP2: 1180.69
TP3: 1225.71

Why this setup?
Why now? The daily trend is bullish and the 4h bias is LONG with 95% confidence, which means the market structure is primed for a continuation move. The 1h price sits at 1105.81, right inside the entry zone of 1105.67, giving us a precise trigger. The 15m RSI at 48.51 shows room to run before overbought, while the 1h ATR of 25.01 tells us volatility is expanding enough to reach the first targe
ZEC-10.69%
Two hours left in the CPI countdown. PPI has surged, pushing the probability of a rate hike to 76%, ETFs have seen $450 million in outflows for three consecutive days, and $568 million in contracts have been brutally liquidated—but BTC slammed on the brakes at 76,500. Is this the last escape window before a macro storm, or the classic script of market makers using the data to wash out leverage?
Have you noticed? After falling for so many days, 76,000 simply cannot be breached.
The candlesticks tell you: daily RSI is at 52-55, neutral to slightly bullish; the broader structure remains intact, w
BTC-1.25%
$BTC Signal】1H rebound touched the upper band and pulled back, with order book sell pressure at 0.32 dominating; short the rebound
$BTC At the end of the 1H rebound, the current price of 77139.1 is clinging to the Bollinger middle band at 77080, while the upper band at 77489.9 is exerting clear resistance. The 4H MACD histogram is -112.6, with bearish momentum continuing to weaken; the 1H MACD histogram has turned positive at 79.9, with short-term buying pushing upward. Depth imbalance is -51.80%, and the buy/sell ratio is 0.32, with heavy selling pressure stacked above. The 1H RSI is 45.18 a
post-image
BTC-1.20%
[$I'm Fucking Here Signal] Long + 4H mid-band pullback with declining-volume confirmation
$I'm Fucking Here 4H Bollinger mid-band at 0.0118 coincides with EMA20. The price stopped falling after pulling back to this band, with the current price at 0.012013. The order book bid/ask depth ratio is 2.65, with buy orders below clearly dominant and selling pressure quickly absorbed.
The 4H MACD histogram has turned positive and continues to expand, with bullish momentum persisting; the previous high at 0.01313 left a long upper wick, while buy orders above 0.0125 temporarily disappeared. Volume gradu
post-image
BTC-1.25%
ETH-0.25%
SOL-1.75%
Insiders are watching SYMBOL break range on the daily and the 1h setup is screaming LONG right now

$DOGE /USDT - LONG

Trade Plan:
Entry: 0.08326 – 0.08366
SL: 0.08091
TP1: 0.08537
TP2: 0.08665
TP3: 0.08856

Why this setup?
Why now? The daily trend is range, which means SYMBOL is coiling at the top of that range and the 1h ATR of 0.000817 shows compression about to explode. The 15m RSI at 39.59 signals room for a bullish push before overbought, while the entry zone between 0.08326 and 0.08366 gives a precise fill near the 1h price of 0.08345. TP1 at 0.08537 and TP2 at 0.08665 offer stacked
DOGE-1.83%
$SNDK /USDT is range-bound on the daily, but the 1h setup screams short

$SNDK /USDT - SHORT

Trade Plan:
Entry: 1697.34 – 1705.94
SL: 1742.95
TP1: 1670.66
TP2: 1650.00
TP3: 1619.01

Why this setup?
Why now? The 4h bias is SHORT with moderate confidence, and the 1h price is sitting right at the entry reference of 1701.64 inside the 1697.34 to 1705.94 zone. The 1h ATR of 17.213577 shows the average move is large enough to reach TP1 at 1670.66 and extend to TP2 at 1650.00. The 15m RSI at 56.58 is neutral, so there is no momentum resistance to a breakdown. The daily trend is range, which means
SNDK-2.31%
[CPI]🔹U.S. August CPI is about to be released, with the market expecting headline CPI to rise appr
live-cover
LIVE2,045
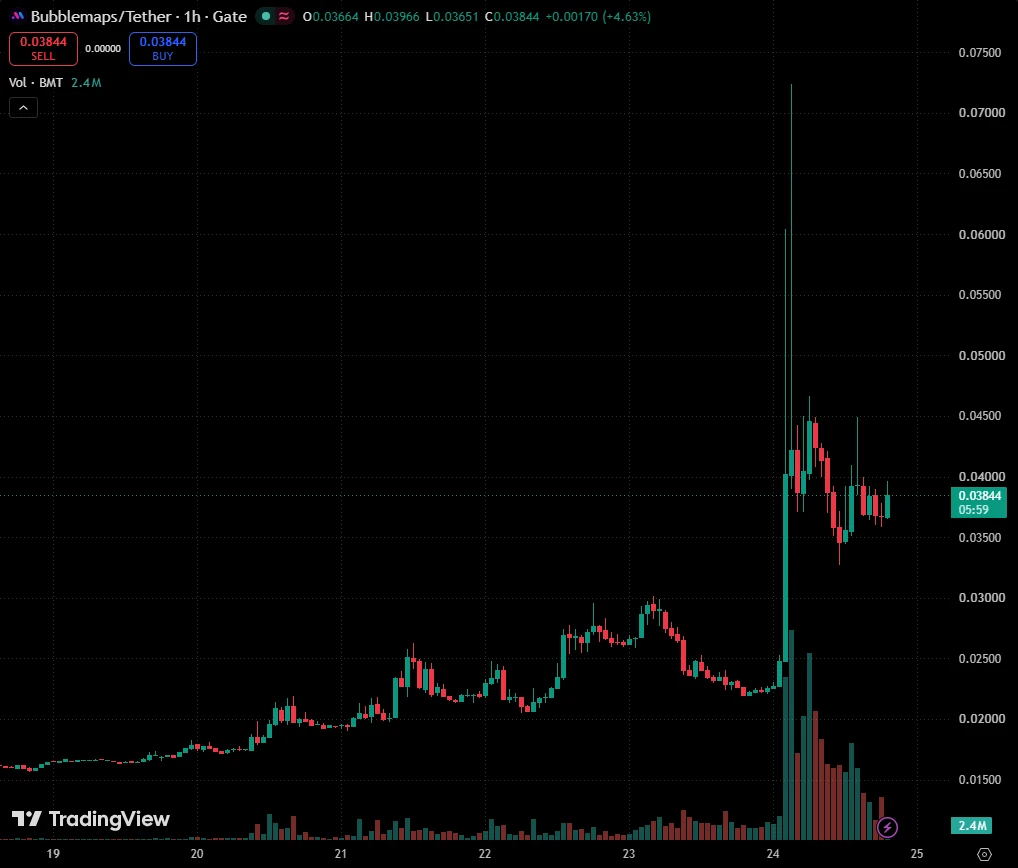
【$Hakimi Signal】Go long + 4H midline wick test, sharp drop in volume at the end
$Hakimi’s 4H Bollinger upper band at 0.0483 is overhead, while the current price is running near the midline at 0.0389, currently at 0.03982. The latest 4H volume is 23.66 million, compared with previous candles at the 200 million level, indicating a cliff-like decline in buying pressure. RSI is 36.06, depth imbalance is -12.29%, and the buy/sell ratio is 0.78, with thicker sell orders overhead.
🎯Direction: Long
⚡Entry/limit order: 0.0397005 - 0.0398200
🛑Stop-loss: 0.0394218
🚀Target 1: 0.0404173
🚀Target 2: 0.04
哈基米+21.60%
BTC-1.25%
ETH-0.25%
SOL-1.75%
Continue positioning short orders in the afternoon; volatility remains low, yet there is still room for profits of over $20!
$BTC $ETH $XAU #黄金 #Gate主流CEXTop4
BTC-1.20%
ETH-0.17%
XAU-1.06%
Been digging into $NOI and honestly, this is one of those projects that makes you stop and look twice.
NOI is building around decentralized science and the idea is simple:
A lot of scientific research, health innovation and longevity research still depends heavily on institutions deciding what gets funded, published and discovered.
NOI is trying to create an alternative.
A decentralized research ecosystem where independent researchers can publish data, explore hypotheses, maintain ownership of their work and connect with capital without relying entirely on traditional gatekeepers.
That alone i
post-image
$STONK burned 25.9k USD over the past ten minutes, 3.73m USD per day, and 100m USD per month.
STONK+41.82%
$MET violently surged 16.75% in one day, currently at 0.2460, just short of the 24h high of 0.2495—this is the most frustrating spot: afraid of becoming exit liquidity if you chase, afraid of missing the takeoff if you don’t.
Reasons to be bullish: The 33.6M trading volume shows a clear surge, not something retail traders can generate; it rallied from 0.2025 to 0.2495 without giving any chance for a pullback, indicating someone is in a hurry to accumulate; it is only 0.35% away from the previous high, and a breakout means acceleration.
Reasons to be bearish: The 16 percentage points have alre
MET+38.89%
Energy Risks Force a Tightening, ECB Restarts Rate Hikes!!!
On September 10 local time, the European Central Bank announced a 25-basis-point increase in its three key interest rates, bringing the deposit facility rate to 2.50%, effective September 16. This is the second rate hike of 2026.
ECB President Lagarde said that geopolitical conflict in the Middle East has pushed up oil prices and increased upward inflation risks. Eurozone inflation rebounded to 3.3% in August, mainly due to a rebound in energy prices. Europe is highly dependent on imported oil and gas, and imported inflationary pressu
post-image
#GateAugustTransparencyReport Gate August 2026 Transparency Report – Full Deep Dive
Gate has just released its official August 2026 Transparency Report, and the numbers show clear momentum as the platform continues shifting from a pure crypto exchange into a full multi-asset financial services platform.
Here’s a complete, detailed breakdown of everything important:
1. Overall Market Performance
24-hour spot + derivatives trading volume reached approximately $9.5 billion, placing Gate among the global Top 3.
Open Interest stood at $12.48 billion, also ranking in the global Top 3.
30-day net cap
post-image
This Ethereum high-confidence short trade was truly valuable
Profited twice in a row
Shorted from 2473 to 2430 = 40 points🥩
Shorted from 2483 to 2450 = 33 points🥩
Captured nearly 100 points🥩
#Gate8月透明度报告
ETH-0.17%
Load More

Join 40 M users in our growing community

⚡️ Join 40 M users in the crypto craze discussion

💬 Engage with your favorite top creators

👍 See what interests you

View More