Square
Following
Hot
News
Profile
Share your thoughts
placeholder
Article
Tech Giants’ Earnings Showdown: Cloud Businesses Surge, AI Investment Soars—Who Can Earn Back All That Spending?
Microsoft, Google, and Amazon are flexing their muscles one after another, while AI capital spending keeps piling up: Is this a growth windfall or an expensive arms race?
This earnings season, what’s really worth watching isn’t just revenue growth, but also cloud business growth, AI order fulfillment, and future guidance. Revenue tells you how well a company sold yesterday; guidance reveals how far management thinks it can go tomorrow.
Cloud computing is an important window to watch
TSLA-3.10%
  • 27
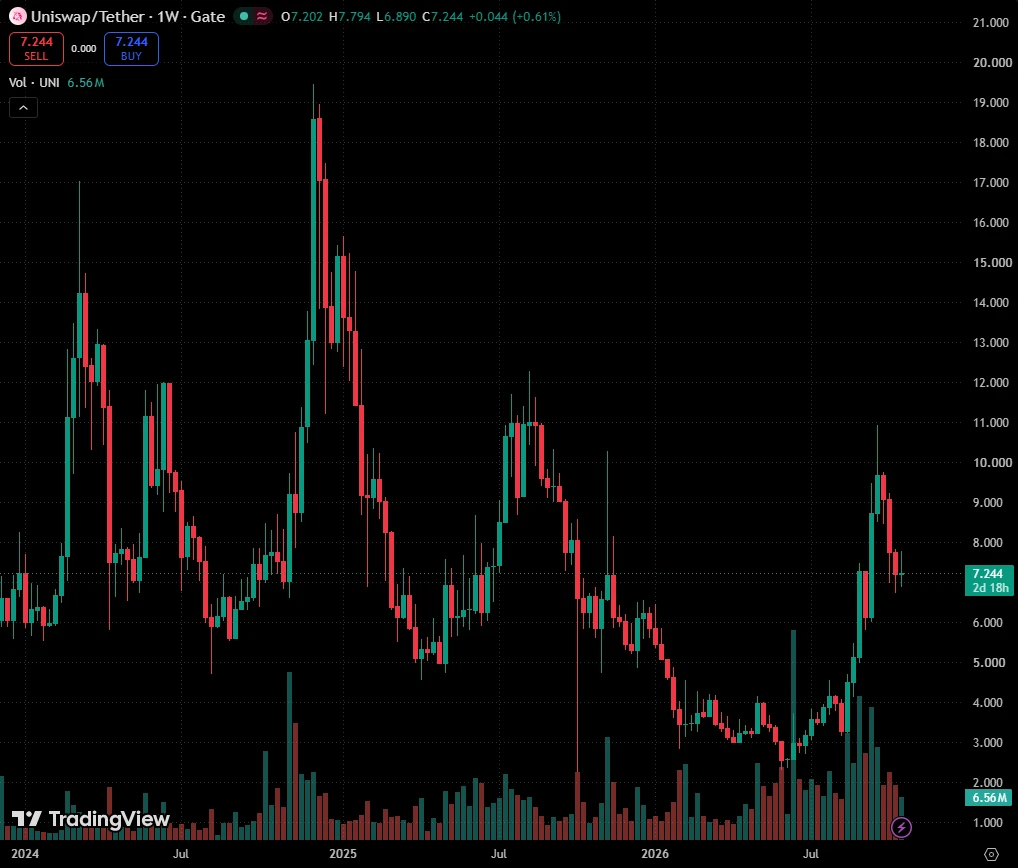
$UNI Uniswap · The bull-market continues
Uniswap did the highest price last month since August 2025. August 2025 was a long-term lower high vs the December 2024 peak pice, $19.5, which is the highest price UNI hit since the 2021 bull-market.
The huge sideways range has been going for long. It became active first in May 2022 and it is still active today.
The March and December 2024 peaks were hit after UNIUSDT traded within the "long-term support" range highlighted on the chart. Just a little action around this level, barely any but still some, was enough to produce a prolonged bullish wave.
In
post-image
UNI+2.22%
Trenches
Kimchi
K
bade
b
Kimchi
CSoc...pump
Market Cap
$.
Change
.
24h Vol
$.
Holders
.
CNPY
C
bade
b
CNPY
0xc6...ddd2
Market Cap
$.
Change
.
24h Vol
$.
Holders
.
AGT
A
bade
b
AGT
0x5d...e274
Market Cap
$.
Change
.
24h Vol
$.
Holders
.
kimchi
k
bade
b
kimchi
B1Y2...pump
Market Cap
$.
Change
.
24h Vol
$.
Holders
.
ZIG
Z
bade
b
ZIG
0x8c...1145
Market Cap
$.
Change
.
24h Vol
$.
Holders
.
CRYPTO MARKET AND SCALPING
live-cover
LIVE1,924
Those who went long chasing the rally above 990 may face a danger greater than this crash itself: making the wrong judgment afterward!
Here’s something that may surprise many people: no matter how sharply the price falls, that doesn’t mean a bottom is in; but when everyone is convinced the market has completely broken down, that’s exactly when it’s most important to reassess
the market. The 1-hour chart tells the real story: 886 has held firm, with a MACD bullish divergence and golden cross, and RSI turning upward. This is the “iron bottom”! 961 is just an appetizer; the gap is bound to be fil
post-image
SKHYNIX+4.62%
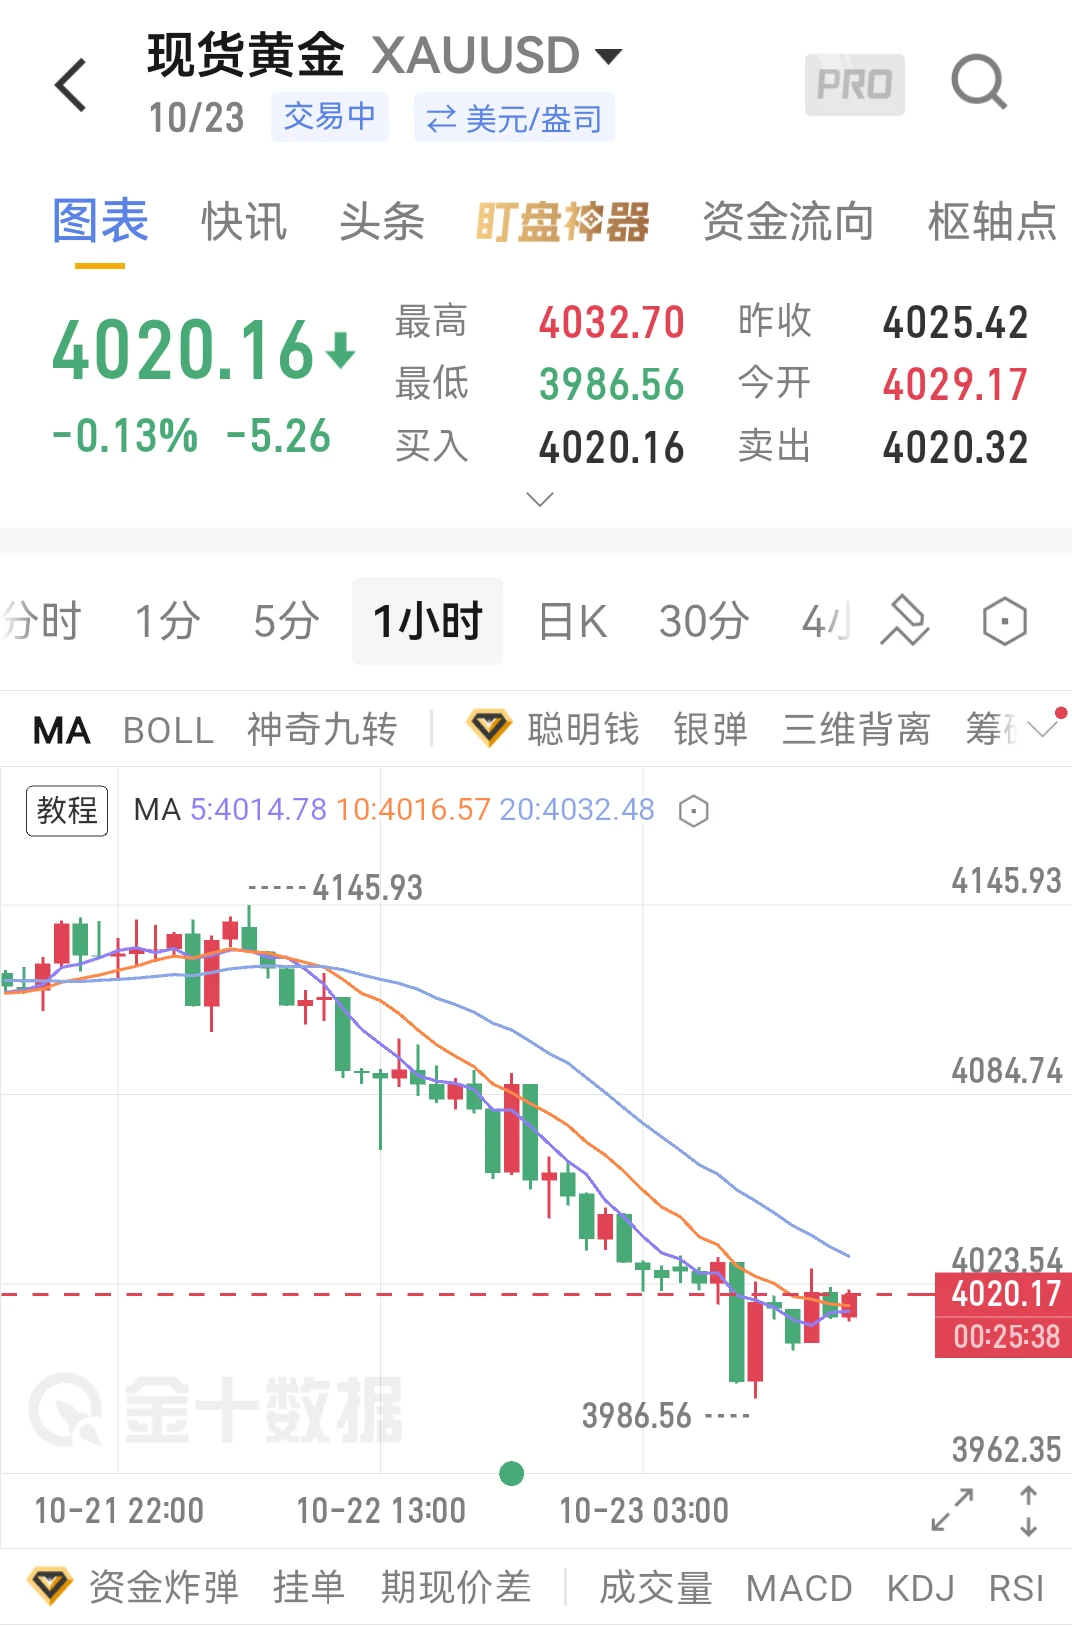
Spot Gold
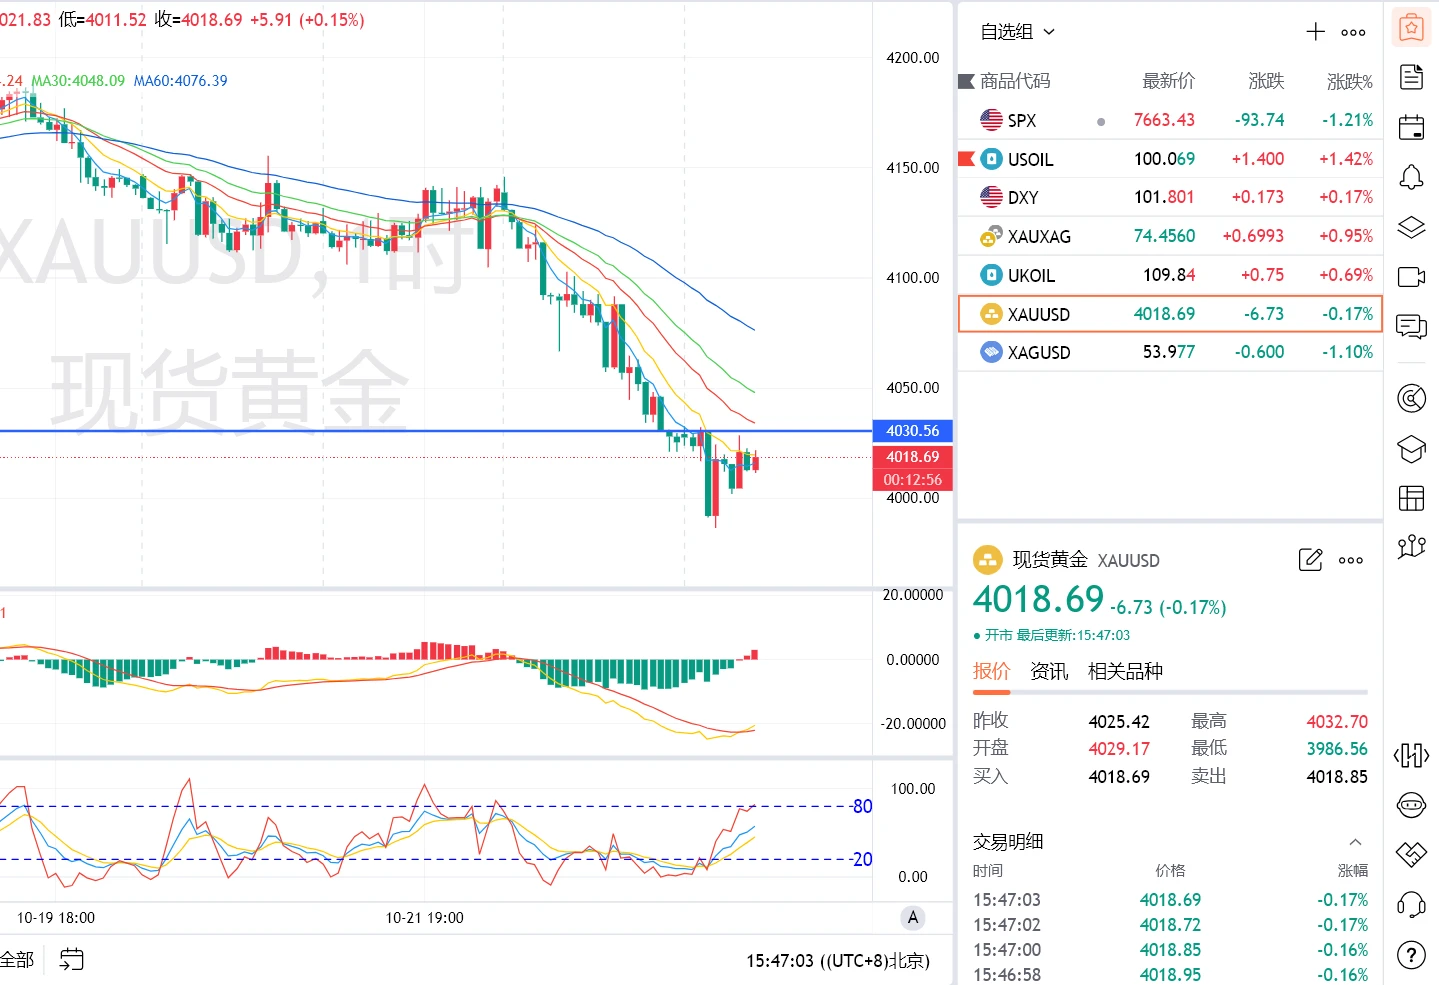
Don't rush to say gold has reversed. Gold continued to fall this morning from 4032, breaking straight below the 4000 mark. Although it quickly rebounded to near where the decline began, the four-hour and short-term hourly charts remain bearish. On the hourly chart, gold has rebounded slightly to correct the price action, with the three KDJ lines climbing rapidly and the J line touching 80, indicating overbought conditions.
In the European session this afternoon, first watch whether gold can break above 4030. If it meets resistance there, gold prices will continue to break lower today
post-image
XAUUSD-0.26%
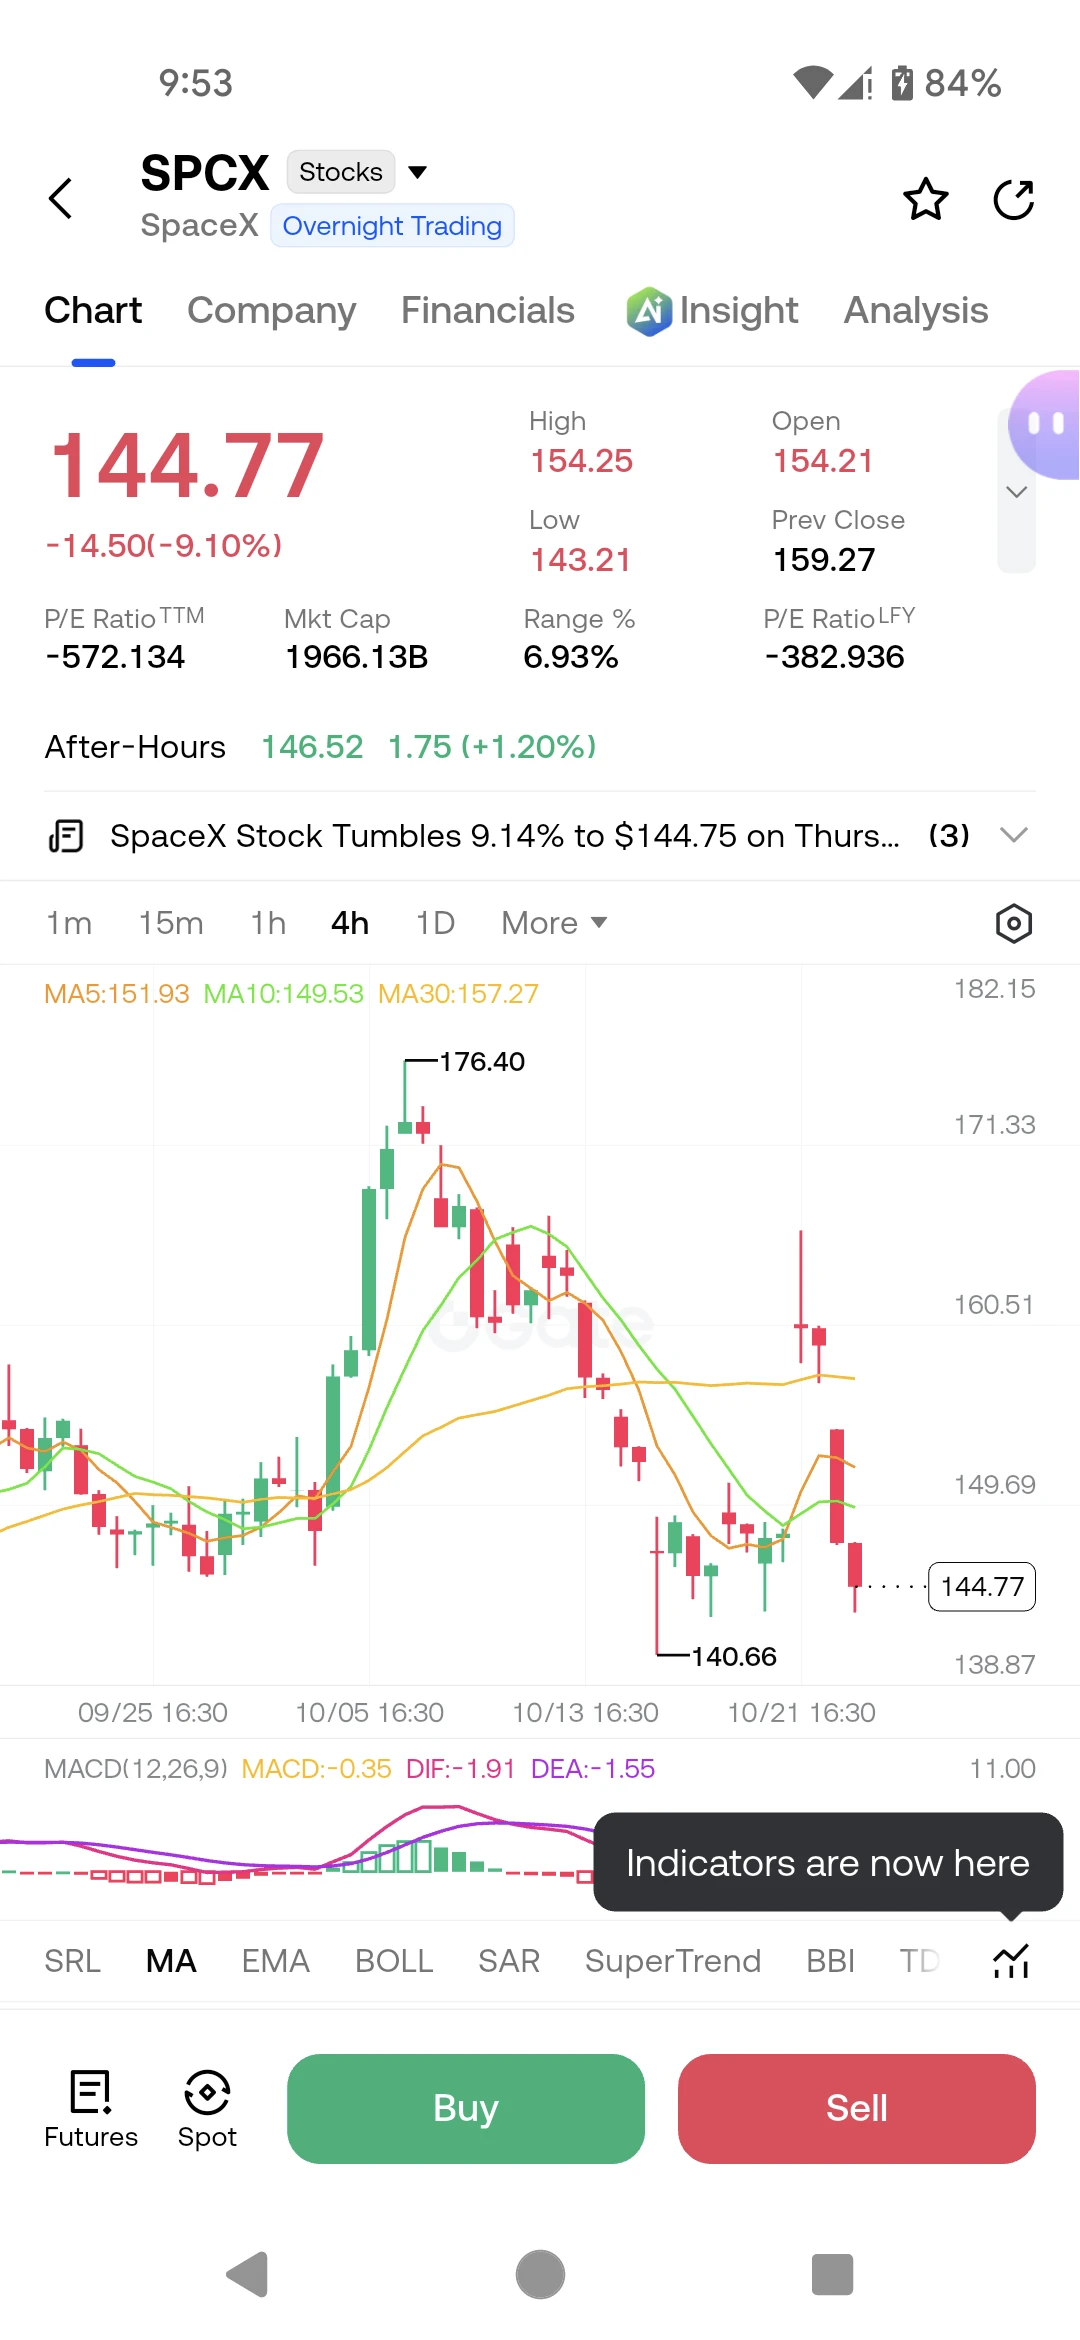
$SPCX ‌just took a brutal 9% hit, but the after-hours session is flashing green—and that's where the opportunity hides.
Trading Plan Long SPCX
Entry: 143.00 - 145.00
SL: 138.50
TP1: 149.50
TP2: 154.25
TP3: 160.00
SPCX is down 9.10% today at $144.77, crashing from the $159.27 previous close to a low of $143.21. The chart is ugly: price is trading below all three key moving averages—MA5 at $151.93, MA10 at $149.53, and MA30 at $157.27. The MACD is deeply negative with a histogram of -0.35 and DIF at -1.91 below DEA at -1.55. Every technical indicator screams bearish.
But here's what most trader
post-image
SPCX-9.10%
  • 1
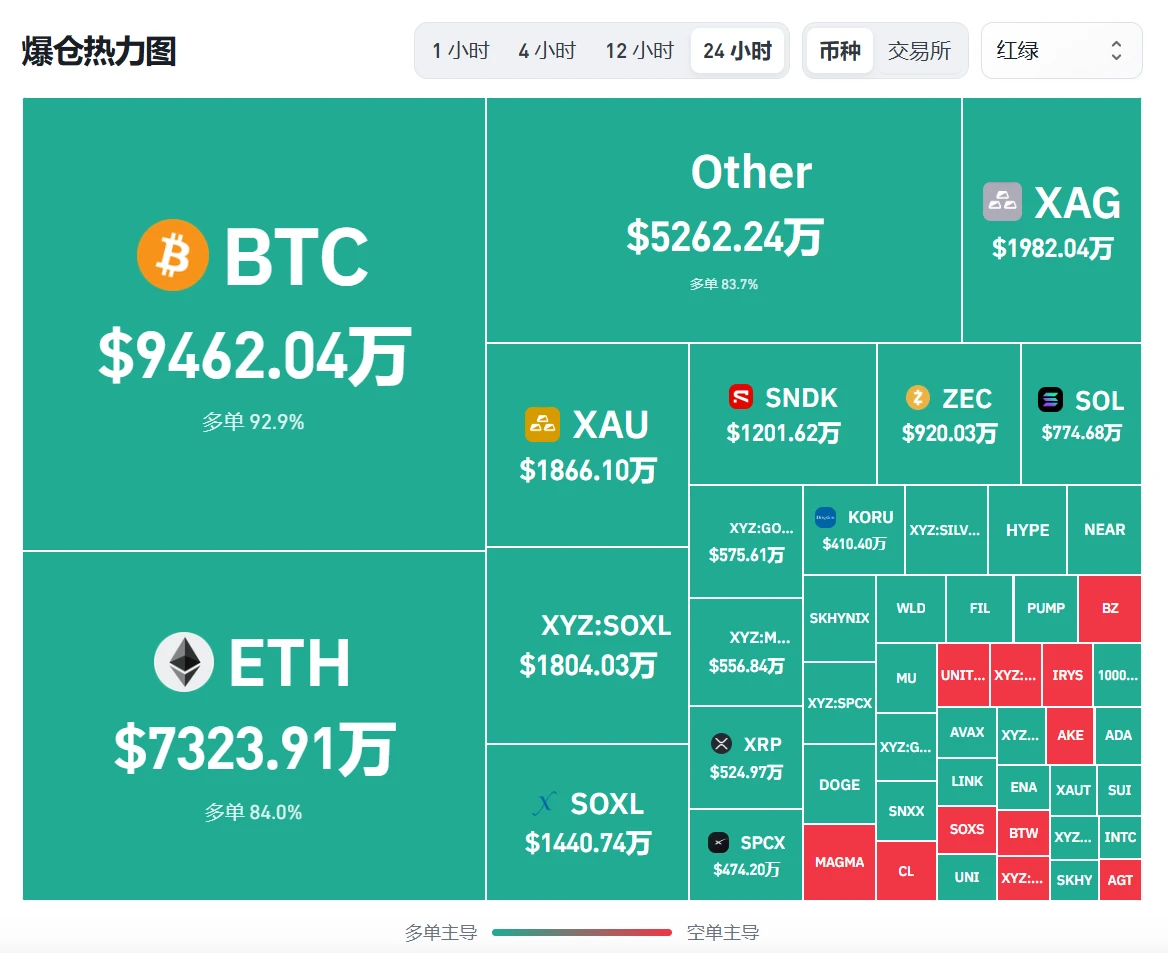
Is BTC’s 4,000-point plunge just an appetizer? Don’t buy the dip on the rebound—the bears still have a big move up their sleeve! Early long positions were brutally liquidated. After the big players “cleaned house” above 84300, long liquidations caused open interest to plunge, and the market simply lacks the momentum for a short squeeze. The current rebound is only an oversold correction and a retest of the daily gap—not a reversal! Trading plan: decisively go short near 82500! This is an excellent resistance level after the gap is filled, with targets at 80000–78000. Still stubbornly holding l
post-image
BTC-0.33%
Gold posted its biggest drop since July, falling below the $4,000 mark for the first time overnight. Many people are starting to wonder whether they should buy the dip now. I can only say: Be fearful when others are greedy, and greedy when others are fearful. Above $4,000, just get on board.
This downturn looks more like the market pricing in panic ahead of next week’s Fed rate decision and a rate hike. Based on current data, the market is betting on one more rate hike this year, but whether it comes this month or in December depends on inflation data. A rate hike in October is highly unlikely
post-image
GLDX-1.60%
PAXG-1.74%
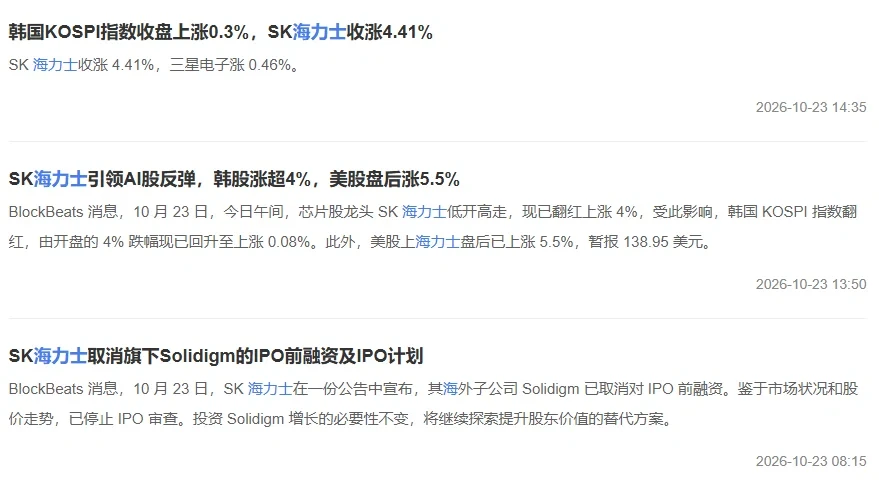
$SKHYNIX SK Hynix’s massive bull trap! A whale makes 30 million as major players prepare to sacrifice the longs?
Once all the good news is priced in, it becomes bad news. Don’t try to catch a falling knife with your bare hands!
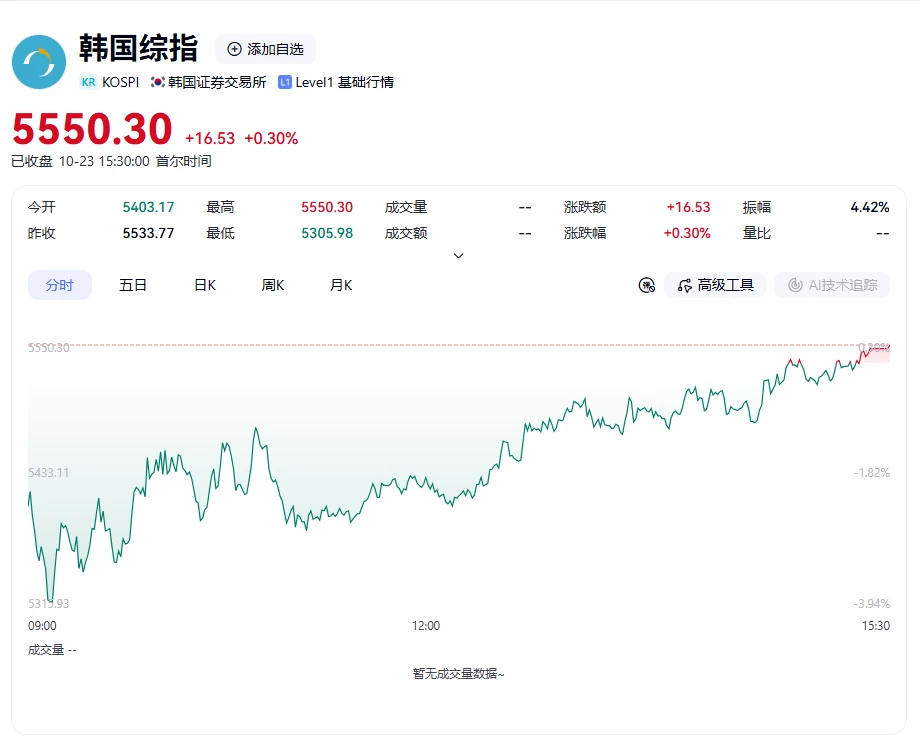
Analysis: According to the latest news, South Korea’s KOSPI closed higher, and SK Hynix rose 4.41%. Looks strong, right? But look at the data: more than 10 million flowed out in just one hour. Whales on the short side made 33.73 million, the long-short ratio is only 23%, and longs are trapped at 983! Check the liquidation map: the 850–900 range below is packed with juic
post-image
SKHYNIX+4.62%
#每周来晒 #美股财报季
I’m most bullish on Microsoft. Among the Big Five, it has the shortest distance between AI investment and revenue: Azure’s quarterly growth is 43%, and Copilot’s shift from fixed-seat to “seat + usage” billing means AI revenue is beginning to have the structural characteristic of automatically expanding with usage frequency. By contrast, Alphabet’s cloud business is growing quickly, but its capital expenditure for a single quarter ($44.9 billion) has already exceeded operating cash flow, sending free cash flow negative for the first time; Amazon’s capital expenditure is set to su
post-image
MSFT-2.10%
AMZN-4.49%
NVDA-4.31%
AAPL+1.22%
  • 1
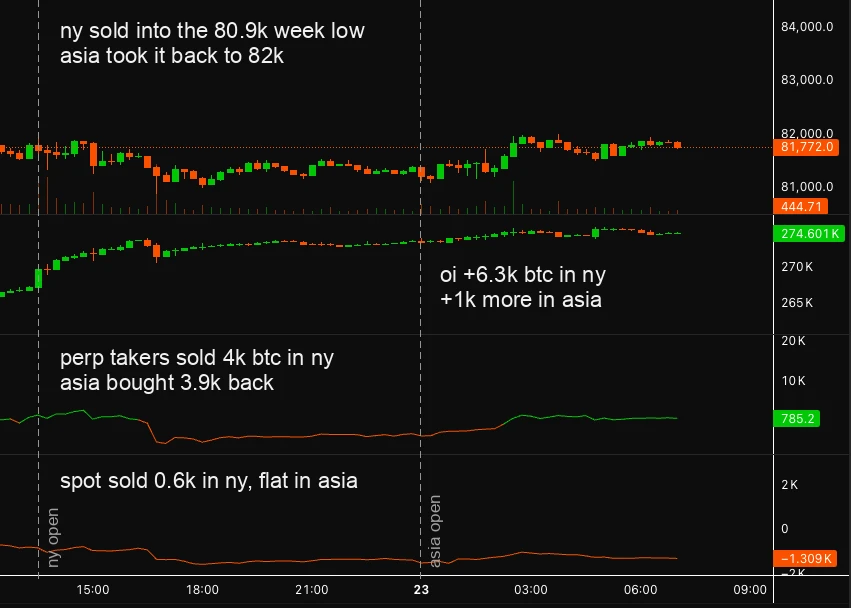
what asia did to ny: perps dumped 4k btc into the week low, asia bought 3.9k of it back. spot didnt show up for either $BTC
post-image
BTC-0.33%
MARKET UPDATE
live-cover
LIVE1,941
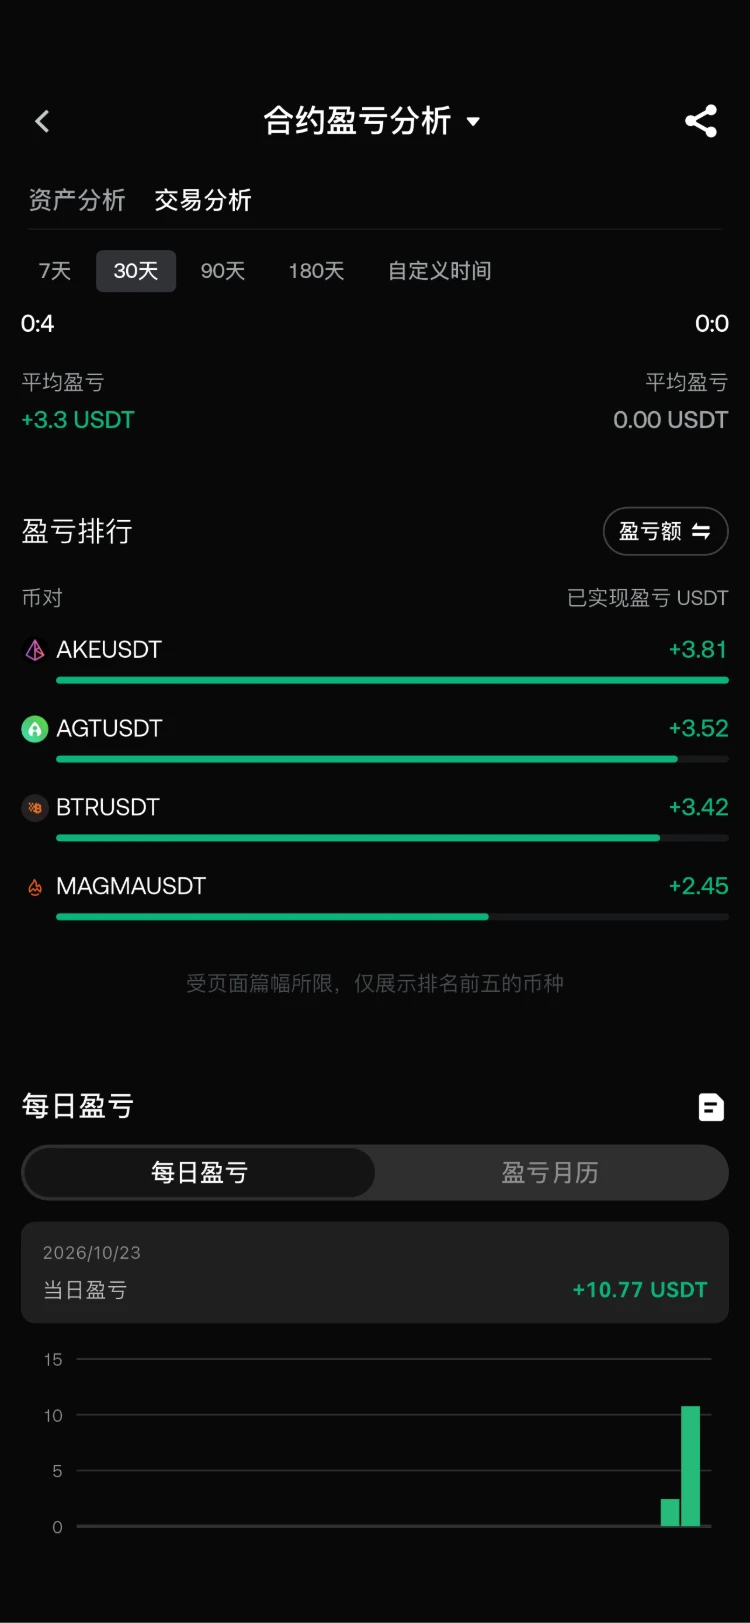
Starting with $100, here's today's result
post-image
Capital fleeced ordinary people through housing, and now there’s no one left to fleece? Are they starting to fleece farmers?#a股
post-image
  • 1
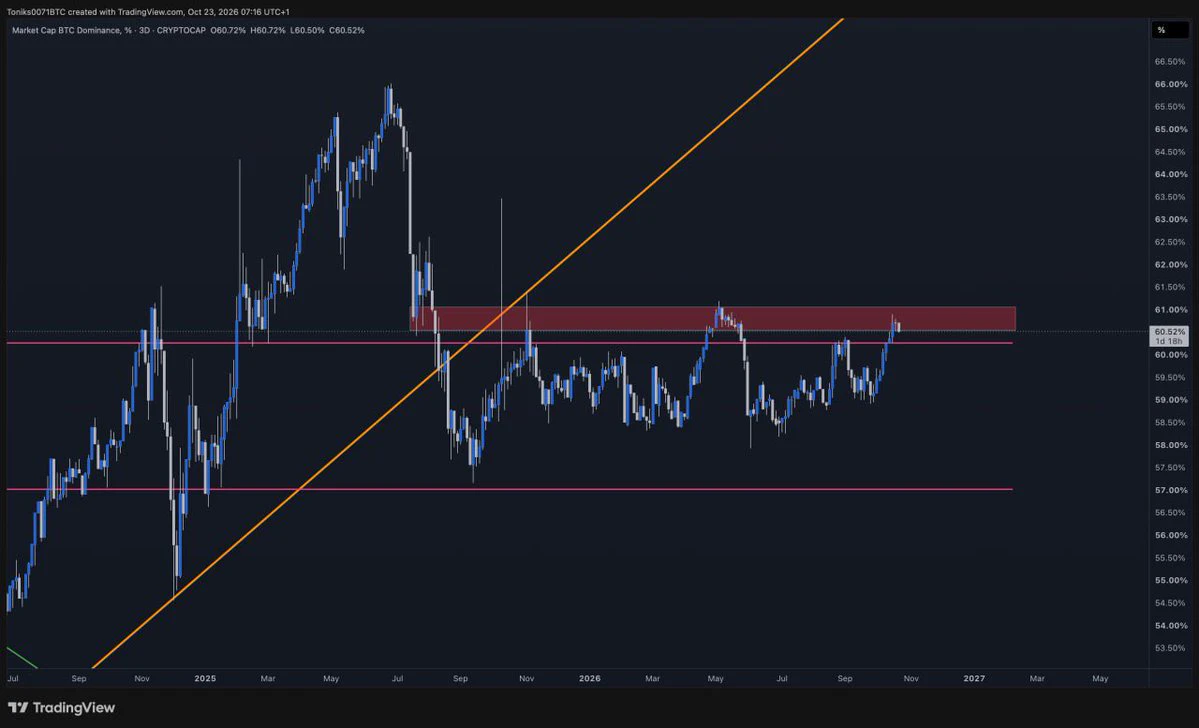
$BTC . D 📉
Seems like we rejected again from the red zone. 🚫
Going back below 60% will unlock more downside and more power for altcoins 🚀
#Bitcoin #crypto
post-image
BTC-0.33%
BTC Falls Below $81,000: What Signals Are RSI and MACD Sending? Don’t Just Guess at a Rebound
Practical Indicator Breakdown, Trading Ideas, and Risk Management
After BTC fell below $81,000, the biggest danger isn’t the market dropping—it’s jumping to conclusions based on a single indicator. RSI says oversold, so you buy the dip; MACD forms a death cross, so you cut your losses. In the end, your trading account is more thrilling than the market.
First, RSI. If the daily RSI stays below 50, it usually indicates weak short-term momentum; if it moves closer to 30, selling pressure may already be h
NVDA-4.31%
  • 30
#数据中心或在2028年面临过剩 The second half of AI infrastructure: what exactly is the market watching?

It’s not just chips or power—it’s about where the bottleneck shifts next. The focus will move from power back to chips, but the key metric that will really determine what goes up or down will be “utilization.”

The past two years: everyone was scrambling for chips. Back then, GPUs were impossible to get, CoWoS packaging was booked out a year in advance, and HBM prices were soaring. The whole story was simply “a chip shortage.”

Now, in 2027: the bottleneck is power, not chips. Here’s the interesting
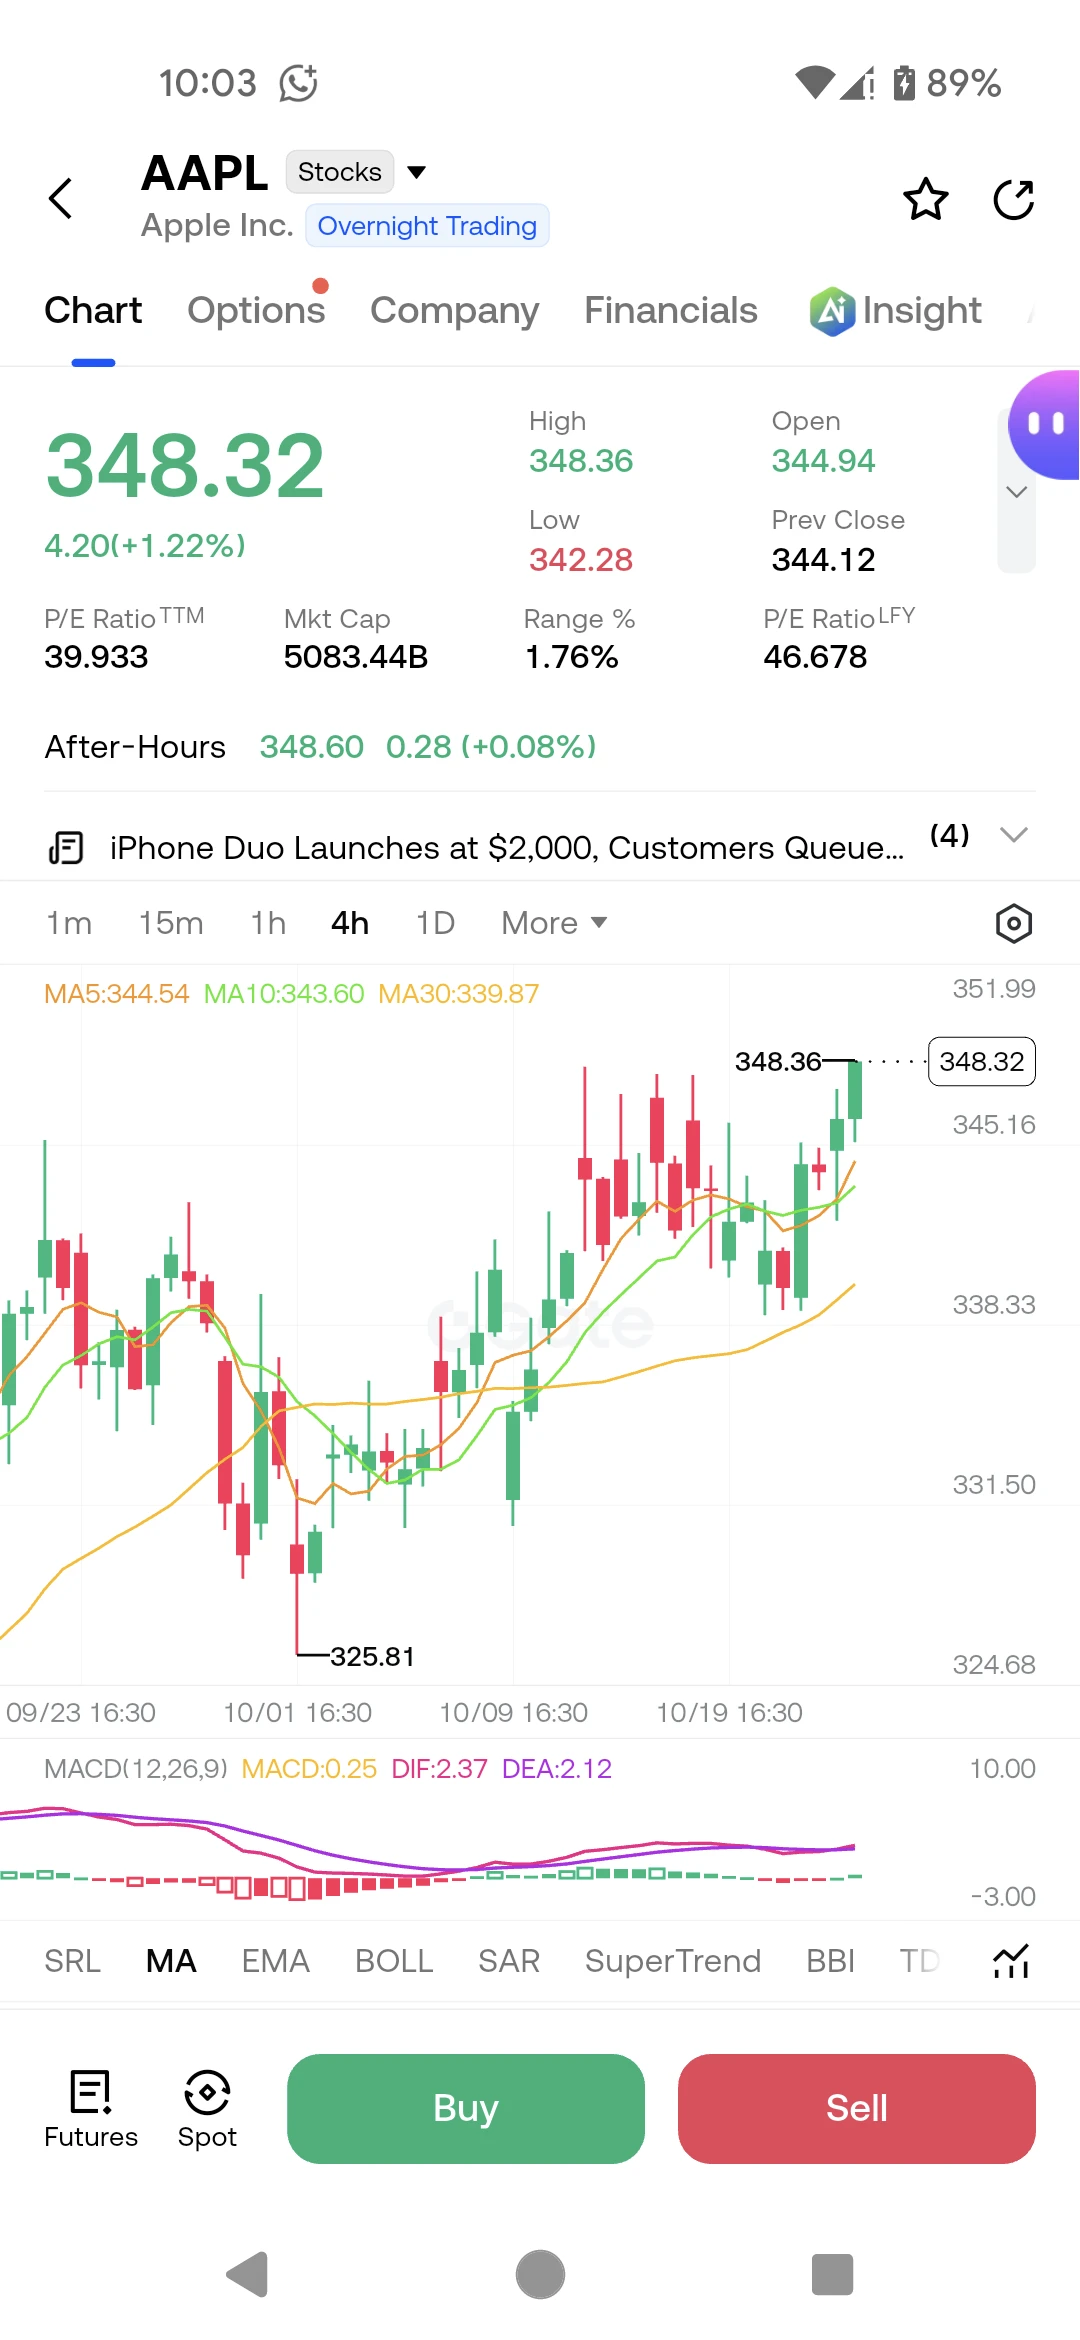
$AAPL ‌ bucking the tech sell-off, hitting fresh highs on the back of a massive new product launch.
Trading Plan Long AAPL
Entry: 345.00 - 348.00
SL: 332.00
TP1: 352.00
TP2: 360.00
TP3: 370.00
AAPL is up 1.22% today at $348.32, completely ignoring the broader Nasdaq weakness. The 4-hour chart is a pure bullish stack: price is trading above MA5 at $344.54, MA10 at $343.60, and MA30 at $339.87. The MACD is positive with a histogram of 0.25, and DIF at 2.37 is holding above DEA at 2.12. This is a steady, controlled uptrend.
The catalyst is obvious. The news headline screams "iPhone Duo Launches
post-image
AAPL+1.22%
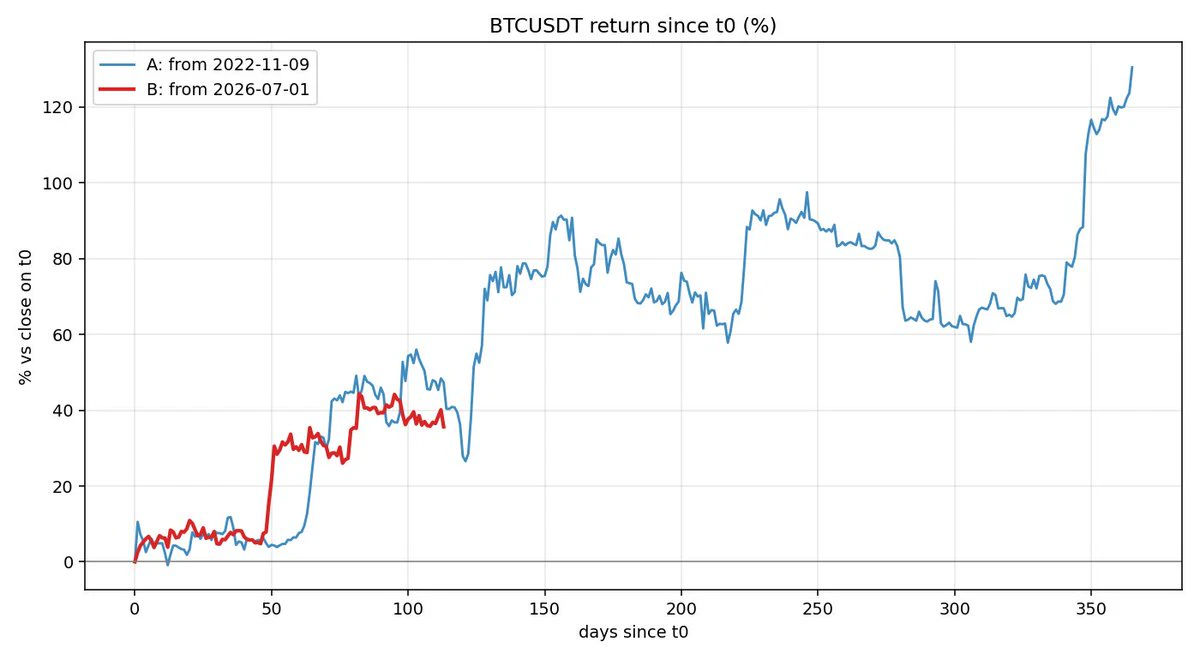
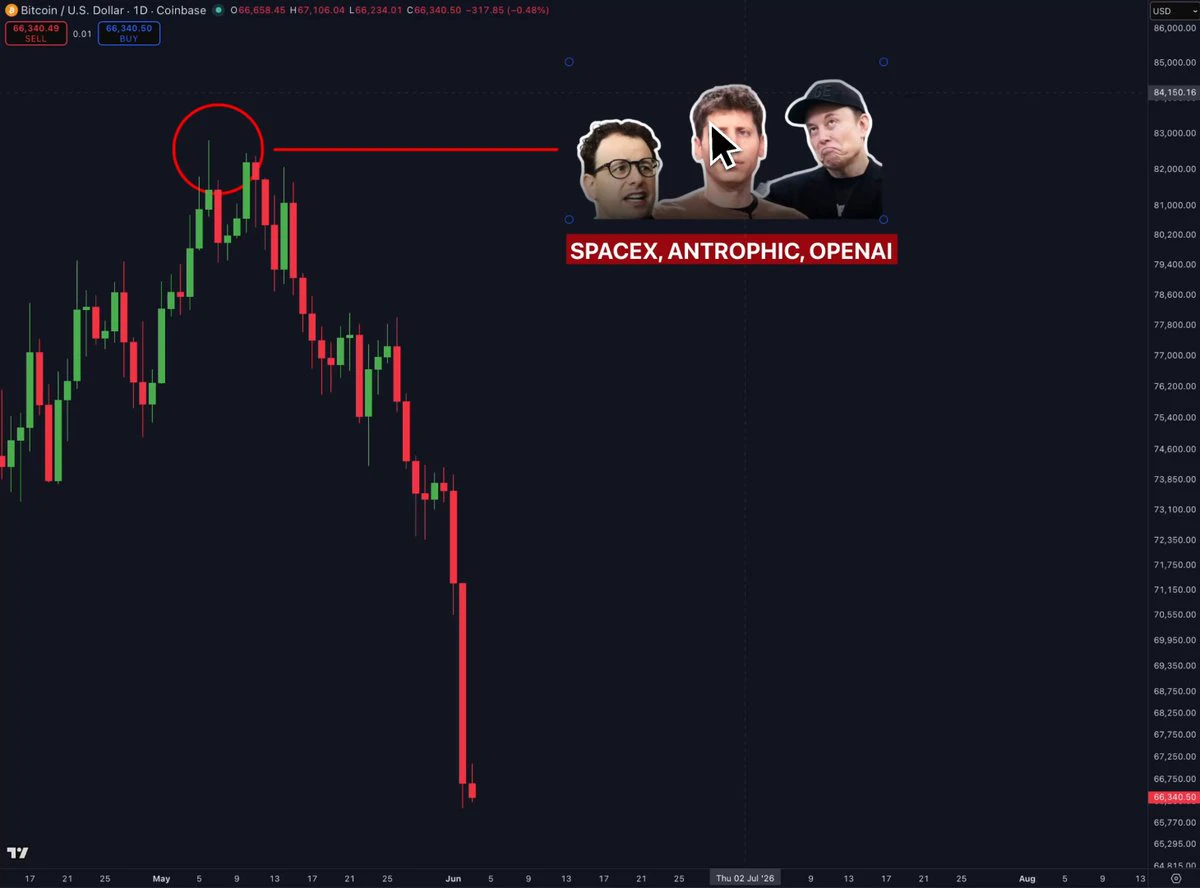
To my surprise, it doesn't look as bad, but I still expect an underwhelming bull market, and a new BTC ATH is far from guaranteed. This cycle started with an already overheated AI bull market, making it hard to see crypto sustaining a 2–3 year run
post-image
BTC-0.33%
Immigration policy gets argued from both sides, but the economic numbers don’t lie: if the government doesn’t get its spending under control, the country won’t be able to keep going forever. Once it tightens the purse strings, cuts will inevitably lead to deportations; everything else is just a narrative setting the stage for that. The hardest part of trading isn’t calling the direction—it’s waiting for a signal you understand. If you see it differently, explain why.
post-image
Load More

Join 40 M users in our growing community

⚡️ Join 40 M users in the crypto craze discussion

💬 Engage with your favorite top creators

👍 See what interests you

Trending Topics

USEarningsSeason

4.51k Views2.73k Discussing

The U.S. Q3 earnings season is in full swing, with major tech companies including Tesla and Meta reporting results. Market focus is shifting beyond revenue and profit toward AI spending, capital expenditure, margins and forward guidance. Which company’s earnings are you watching most closely?

GateWCTCS9GlobalTradingCompetition

404.74k Views7.58k Discussing

BTCDropsBelow81000

46.25k Views37.97k Discussing

View More