


#BTC战略储备市场影响 BTC strategic reserves or and gold become dual insurance
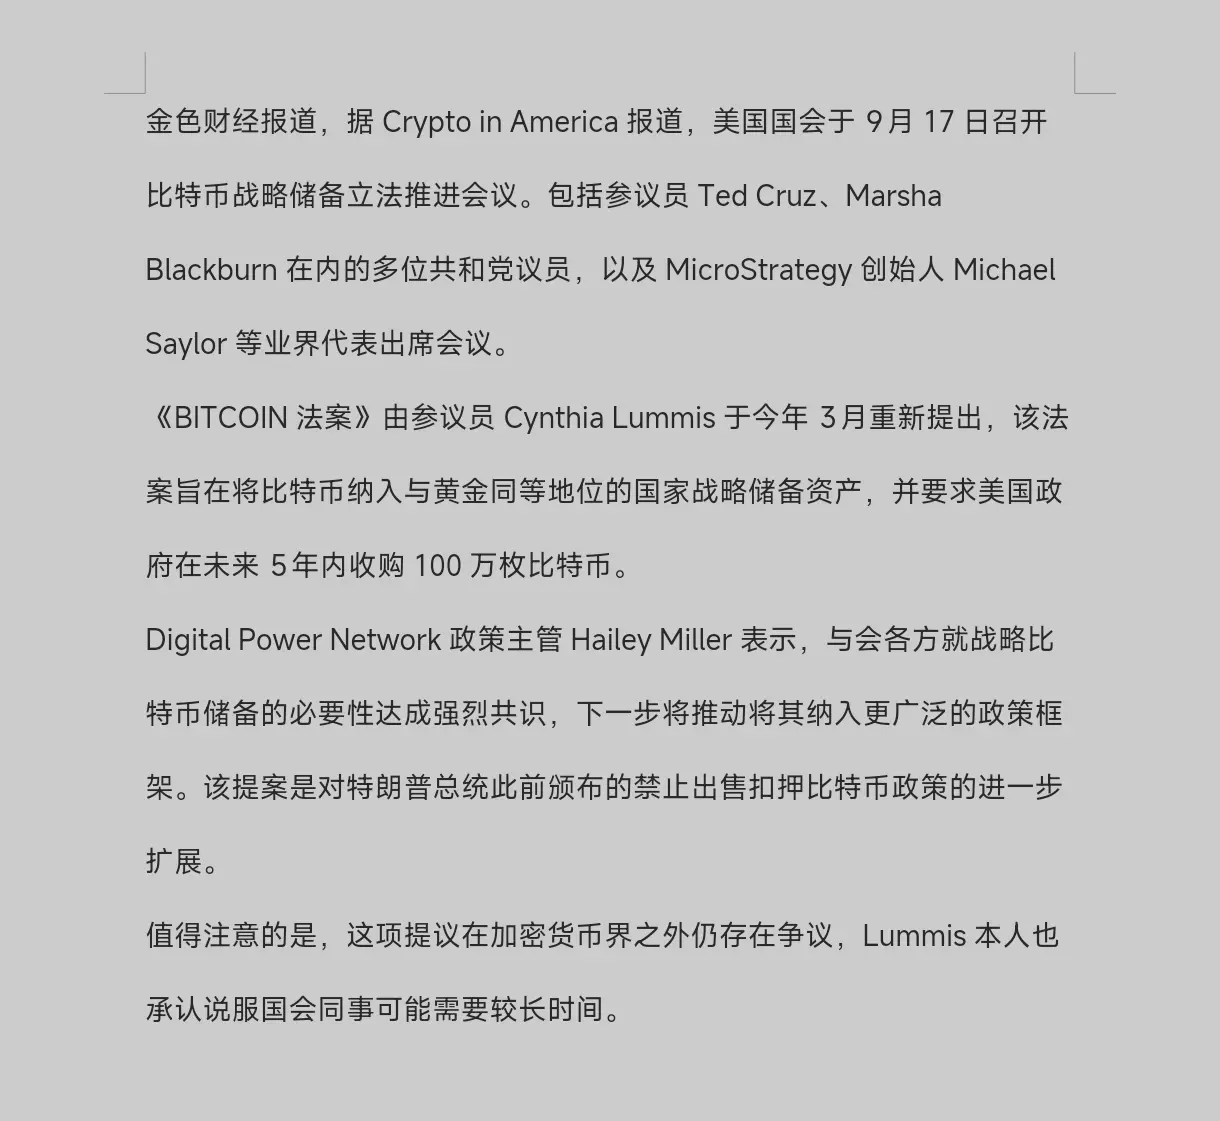
On September 17th, the US Congress advanced the #BTC Strategic Act! Plans to purchase 1 million BTC within 5 years!
In fact, since March of this year, or rather the market situation before and after Trump's election victory—major enterprises and companies have been gradually purchasing BTC as a hedge asset, which has been a hint from the very beginning. After all, it was said at that time that BTC would be a strategic reserve, and this has continued until now. This includes Trump's retirement funds being able to invest in cryptocurrencies and a series of strategic measures from around July or August. Until now, news has emerged again, and it’s still a bombshell—strategic reserves, just like gold! Moreover, it can be publicly supported.
Well, how should I put it? In the past, it was more like a verbal check; I said I would do it, but the timing was tentative (the time was undecided). Now, the check is in hand, and it just needs my signature to execute this measure. (Although the timing is also undecided, it's like the metaphor suggests, the check is in hand, and it just needs a signature). This news coincides perfectly with the recent breakthrough of gold hitting new highs. It's important to note that gold, as one of the safe-haven assets, represents the occurrence and development of events or market trends every time it breaks new highs. Therefore, regardless of the circumstances, various countries will reserve gold as a safe-haven asset. Not to mention the general public. And now, with BTC officially stepping onto the international stage and breaking historic highs, major companies, institutions, and countries are successively choosing to reserve it as a safe-haven asset.
BTC still has decades of excess return potential. I wonder how many people remember this statement by Dan Morehead, the founder and CEO of Pantera Capital, at the Consensus 2025 conference held in Toronto in May. At that time, he also emphasized that Pantera continues to have confidence in this asset class. Morehead advised investors to "invest in a wide range of tokens and venture equity" to seize the rapidly evolving market opportunities.
The extensive investment in other tokens and risky equity is reflected in the value of blockchain and profit in recent tokens such as GT, BTR, MYX, AVNT, RWA, OPEN, and so on. GT has risen from 0.2 in 2020 to now 16, with subsequent initiatives (public chain underway, burning, innovation in functions and performance, etc.) and the development of the times showing a trend of breaking new highs. MYX speaks for itself. The upcoming artificial intelligence tokens and the RWA token tracks, etc., all reflect diversity and the resonance of blockchain with the world. It can manifest the inherent value in various industries, creating a financial system that is different from stocks. Hong Kong's Guotai Junan International, along with recent investments by China Merchants International in SOL, Tencent, and others, all confirm that one of the future development trends is blockchain.
Therefore, if BTC is indeed designated as an official strategic reserve by the United States, it will undoubtedly become one of the super catalysts for the next bull market. After the U.S. reserves it, more and more institutional enterprises, private entities, and nations will choose it as one of their safe-haven asset reserves. It will hold a status similar to that of gold. It exists now, but it will be more significant in the future. Over time, 200,000? 300? It's hard to imagine. Perhaps we will witness history.
The United States has proposed to strategically reserve BTC. The timing could be in October or November. With the New Year approaching, along with Christmas and so on, perhaps the crypto world also needs a beautiful conclusion this year - that is, the proposal's approval.
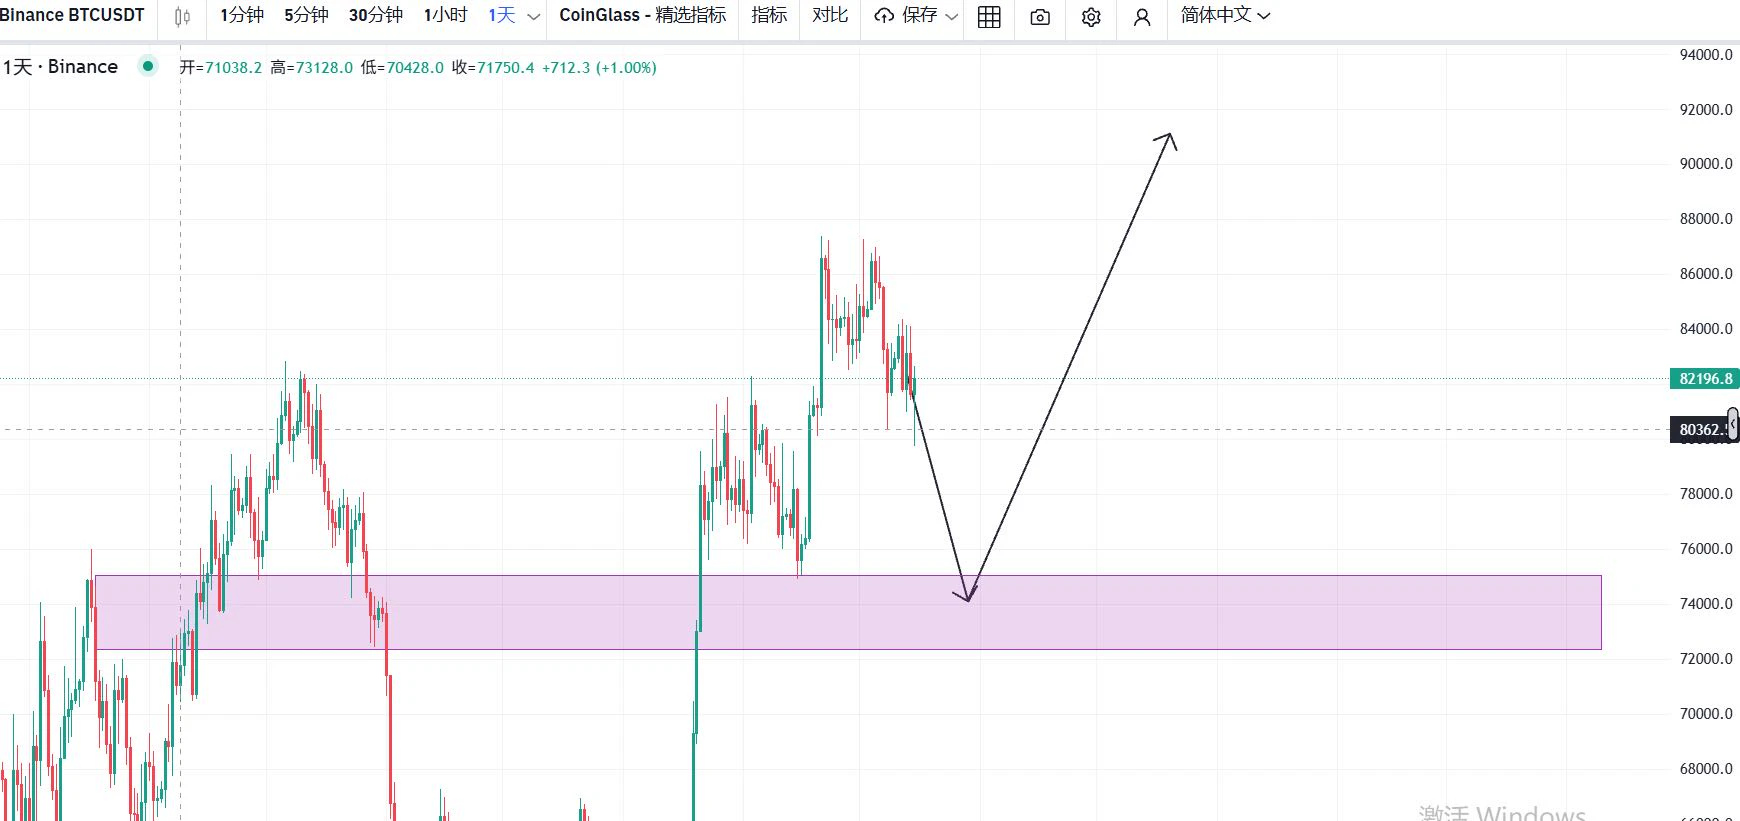
It is not recommended to buy the dip in the short term + we need to wait for a pullback, because when good news is fully priced in, it becomes bad news. Enter on a pullback, to be safe, do not blindly chase highs, not losing is making a profit! #Gate广场创作点亮中秋
On September 17th, the US Congress advanced the #BTC Strategic Act! Plans to purchase 1 million BTC within 5 years!
In fact, since March of this year, or rather the market situation before and after Trump's election victory—major enterprises and companies have been gradually purchasing BTC as a hedge asset, which has been a hint from the very beginning. After all, it was said at that time that BTC would be a strategic reserve, and this has continued until now. This includes Trump's retirement funds being able to invest in cryptocurrencies and a series of strategic measures from around July or August. Until now, news has emerged again, and it’s still a bombshell—strategic reserves, just like gold! Moreover, it can be publicly supported.
Well, how should I put it? In the past, it was more like a verbal check; I said I would do it, but the timing was tentative (the time was undecided). Now, the check is in hand, and it just needs my signature to execute this measure. (Although the timing is also undecided, it's like the metaphor suggests, the check is in hand, and it just needs a signature). This news coincides perfectly with the recent breakthrough of gold hitting new highs. It's important to note that gold, as one of the safe-haven assets, represents the occurrence and development of events or market trends every time it breaks new highs. Therefore, regardless of the circumstances, various countries will reserve gold as a safe-haven asset. Not to mention the general public. And now, with BTC officially stepping onto the international stage and breaking historic highs, major companies, institutions, and countries are successively choosing to reserve it as a safe-haven asset.
BTC still has decades of excess return potential. I wonder how many people remember this statement by Dan Morehead, the founder and CEO of Pantera Capital, at the Consensus 2025 conference held in Toronto in May. At that time, he also emphasized that Pantera continues to have confidence in this asset class. Morehead advised investors to "invest in a wide range of tokens and venture equity" to seize the rapidly evolving market opportunities.
The extensive investment in other tokens and risky equity is reflected in the value of blockchain and profit in recent tokens such as GT, BTR, MYX, AVNT, RWA, OPEN, and so on. GT has risen from 0.2 in 2020 to now 16, with subsequent initiatives (public chain underway, burning, innovation in functions and performance, etc.) and the development of the times showing a trend of breaking new highs. MYX speaks for itself. The upcoming artificial intelligence tokens and the RWA token tracks, etc., all reflect diversity and the resonance of blockchain with the world. It can manifest the inherent value in various industries, creating a financial system that is different from stocks. Hong Kong's Guotai Junan International, along with recent investments by China Merchants International in SOL, Tencent, and others, all confirm that one of the future development trends is blockchain.
Therefore, if BTC is indeed designated as an official strategic reserve by the United States, it will undoubtedly become one of the super catalysts for the next bull market. After the U.S. reserves it, more and more institutional enterprises, private entities, and nations will choose it as one of their safe-haven asset reserves. It will hold a status similar to that of gold. It exists now, but it will be more significant in the future. Over time, 200,000? 300? It's hard to imagine. Perhaps we will witness history.
The United States has proposed to strategically reserve BTC. The timing could be in October or November. With the New Year approaching, along with Christmas and so on, perhaps the crypto world also needs a beautiful conclusion this year - that is, the proposal's approval.
It is not recommended to buy the dip in the short term + we need to wait for a pullback, because when good news is fully priced in, it becomes bad news. Enter on a pullback, to be safe, do not blindly chase highs, not losing is making a profit! #Gate广场创作点亮中秋