


Share your thoughts
placeholder
Article
Just know that when you rug me this is who you’re rugging
post-image
$DASH Signal】1H bullish volume-backed strong attack, MACD expanding, short-term snipe
$DASH RSI 84.73, the 4H Bollinger upper band at 61.06 has been broken through by the candle body, and the current price of 64.26 is running along the outer edge of the band. The 1H MACD histogram at 0.9161 continues to expand, with a buy-side depth imbalance of 26.76%; buy orders in the order book are 1.73 times sell orders. The 1H close has posted three consecutive bullish candles, rising from 55.13 to 64.16, with volume increasing step by step. The final 1H volume was 472,000 lots, and funds are still pu
post-image
DASH+38.47%
ETH is currently entering a high-level pullback phase, with signals across multiple timeframes gradually coming under pressure. Rebounds on smaller timeframes are mostly corrective moves during the decline, rather than a trend reversal. On the 4-hour timeframe, this adjustment cycle has only reached its midpoint, leaving room for a bottom-reversal signal to emerge. The price is fluctuating near the 4-hour short-term support at 2444, which is currently the key lifeline for the medium-term trend. No strong buying support is visible at present; once this support fails, the pullback could expand f
post-image
ETH-2.05%
Nobody sees the 95% conviction short on $HOME /USDT — but the 4h chart is already screaming.

$HOME /USDT - SHORT

Trade Plan:
Entry: 0.00600 – 0.00602
SL: 0.00615
TP1: 0.00590
TP2: 0.00583
TP3: 0.00573

Why this setup?
Why now? The daily trend is bearish, and price is stalling at 0.00601 with a tight 1h ATR of 0.000059 — that’s compression before a drop. RSI on 15m sits at 49.47, neutral, giving room to fall, not bounce. Targets are stacked: TP1 at 0.00590, TP2 at 0.00583, TP3 at 0.00573. Invalidation is clear at 0.00617 — if we lose that, the short thesis dies. But with 95% confidence and
HOME0.00%
#AugustNFPBeatsExpectations
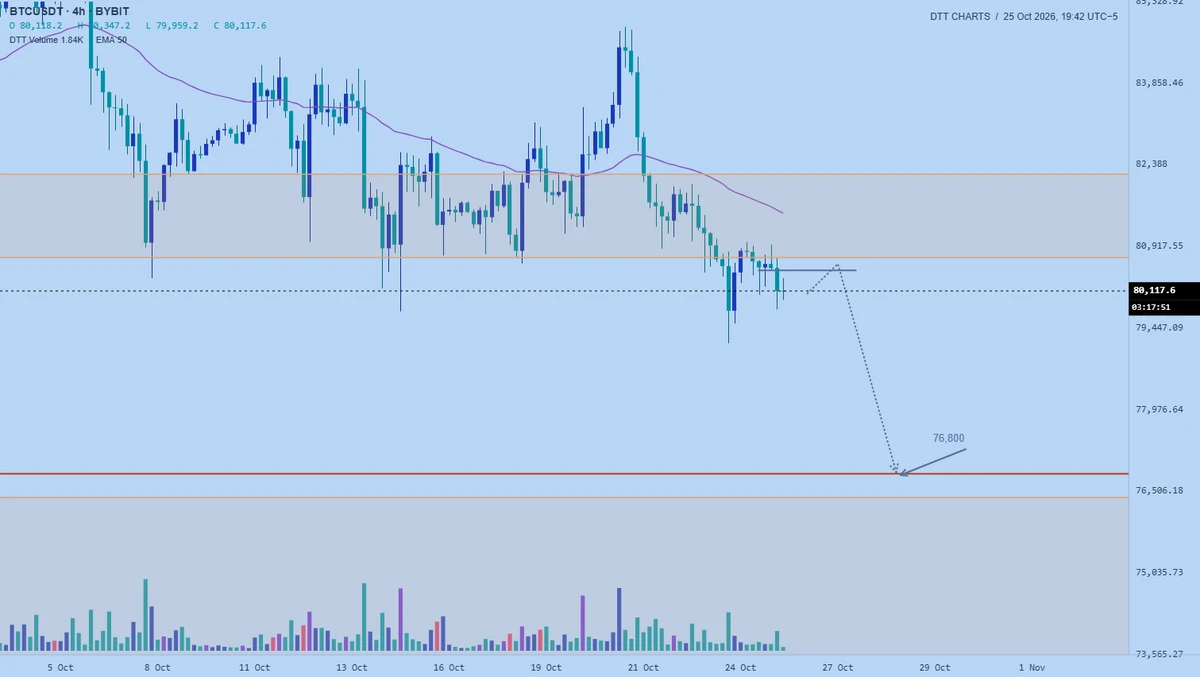
#BTC — The Jobs Report Changed the Short-Term Setup
The U.S. August jobs report delivered a much stronger number than the market was prepared for.
Nonfarm payrolls increased by 162K, far above the roughly 56K consensus, while unemployment stayed at 4.1%. More importantly, previous months were revised higher by a combined 55K, removing some of the weakness investors had been expecting from the labor market.
The market reaction was immediate.
Bitcoin dropped from around $81K and traded below $80K after the release, while Treasury yields moved sharply higher. The 10-y
post-image
BTC-1.40%
I was just about to go to the forum and rant, but then I saw my balance and decided against it—the market is always right. During the repeated intraday swings, I watched $WLFI jump up and down, but the volume was completely off. Trading volume was low, and with no one buying into the rise, isn’t this just setting up for a drop?
Shorted at 0.05841. Just checked: at 0.05652, the +229.59% profit is already locked in. This is what it feels like to have it under control—really satisfying.
Closed 70% first, and moved the stop-loss on the remaining 30% up to the entry price, letting the profits run.
post-image
WLFI-1.94%
BNB-0.41%
ADA-6.32%
I’m dying, I just came across a meme:
The three U.S. immortals each have their own trading targets.
Trump trades Brent crude between $70 and $90: when it hits $70, he takes a shot at Iran; when it reaches $90, he tacos.
Bessent watches Treasury yields: when the 30-year Treasury yield hits 5.2%, he unleashes a verbal barrage.
Warsh watches the probability of a September rate hike: when the probability drops to 30%, he takes a hard line; when it rises to 70%, he goes “blah blah.”
The three immortals each do their own thing, independent of one another yet interfering with one another😂
post-image
#特斯拉##TSLA# Figure 2 shares the overall wave chart. Tesla is believed to be undergoing a correction in wave 3-2; once the correction is complete, it will rise in wave 3-3. $TSLA
TSLA-4.05%
$PI 🇺🇸 Breaking news: The House has canceled two weeks of sessions in September, meaning the crypto industry’s most important legislative priority—the Clarity Act—could be delayed until after the general election.
post-image
PI-1.41%
valuescan is really useful for trading altcoins. It’s been so hard to trade these past few days; with the market crashing, the ones selected by valuescan have been relatively stable.
#Lobster 22%
#zec 28.23%
#uai 14.52%
#useless 150.39%
#marscoin 9.29%
Today’s results: currently using #valuescan for free
Come to me if you want to use it hehe.
龙虾+9.12%
ZEC+9.67%
UAI+29.10%
USELESS+16.72%
MARSCOIN+39.87%
👀 I’m keeping $TRUMP /USDT on my radar here.
The chart looks like it’s trying to build momentum again after that sharp flush. Price has climbed back above the short-term moving averages, but I’m not chasing the move I want to see buyers prove they can hold the breakout area.
📍 Entry Zone: $2.30 – $2.34
🎯 TP1: $2.42
🎯 TP2: $2.50
🎯 TP3: $2.58
🛑 Stop Loss: $2.24
If $2.34 holds as support, the next push toward the previous resistance zone could get interesting. ⚡
My approach: patience on the entry, partial profits on the way up, and strict risk control if the setup breaks down.
⚠️ Disclaime
post-image
TRUMP-2.00%
$1000 to $100,000 Crypto Trade Challenge Today
live-cover
LIVE556
【$Q Signal】Buy the pullback, risk-reward ratio 1:1.5
$Q Current price 0.026513, order book depth imbalance -43.79%, with sell-side pressure. The 4H MACD histogram is contracting, while the price remains above EMA20. The 1H MACD bearish momentum is expanding, but the price has not broken the previous low, and pullback momentum is weakening.
🎯Direction: Long
⚡Entry/limit order: 0.02643346 - 0.02651300
🛑Stop-loss: 0.02624787
🚀Target 1: 0.02691069
🚀Target 2: 0.02710954
🛡️Trade management: After reaching Target 1, reduce the position by 50% and move the stop-loss up to breakeven. If the price
post-image
BTC-1.40%
ETH-2.05%
SOL-1.66%
$BICO /USDT
Lying above strong S/R level. RSI is showing a bullish divergence. EMA'S are acting as solid support. Stochastic is giving a buying signal. Expecting a big upward move from here.
Targets: $0.02690 - 0.03580 - 0.05645 - 0.12045
Stop if 1D closes below $0.01755
post-image
BICO+8.01%
$NVDA — I’m Watching This Breakout 👀🔥
NVIDIA is holding up well after the recent move, but there’s one level I really want to see buyers take back:
$230.
That’s the door.
If NVDA breaks above $230 with good volume and holds the breakout, I’d be looking for:
🎯 TP1: $236
🎯 TP2: $242
🎯 TP3: $250
My trade plan:
🟢 Entry: $221 – $225
🛑 SL: $214.50
I don’t want to chase a huge green candle. Give me either a clean entry around the current zone or a confirmed $230 breakout.
The level I don’t want to see lost is $215. If that breaks decisively, I’m out — no arguing with the chart.
For me, it’s s
post-image
NVDA-0.22%
  • 2
  • 2
$FHE Signal】1H pullback support + short squeeze initiation
$FHE A reversal structure emerged after a slow 1H decline on shrinking volume, with buyers actively accumulating around 0.050 and selling pressure exhausted. The 4H Bollinger upper band continues to open upward, while the funding rate is -0.0348% and leveraged shorts have not exited.
🎯Direction: Long
⚡Entry/Limit order: 0.0501591 - 0.0503100
🛑Stop-loss: 0.0498069
🚀Target 1: 0.0510647
🚀Target 2: 0.0514420
🛡️Trade management:
- Execution strategy: Reduce the position by 50% after reaching Target 1 and move the stop-loss up to the b
post-image
FHE+0.13%
BTC-1.40%
ETH-2.05%
SOL-1.66%
How to Find 100x and 1,000x Assets in a Bull Market
1. Choose the right sector, with a high enough ceiling, strong potential, and ample room for growth;
2. This year's hot sectors are the BTC ecosystem, ETH ecosystem, and SOL ecosystem;
3. The BTC ecosystem has produced 100x, 1,000x, and 10,000x assets, with a clear wealth-creation effect;
4. The ETH and BSC ecosystems have performed moderately, with no dark horses emerging for now and no wealth-creation effect currently visible;
5. Many coins in the SOL ecosystem have surged this year, creating wealth-making opportunities, with foreigners mak
post-image
BTC-1.40%
ETH-2.05%
SOL-1.66%
CORE-0.64%
  • 1
$NVDA Nvidia May Reclaim the “Iron Throne”
Share prices of U.S. tech giants are once again nearing record highs—and this time, Nvidia is clearly the player leading the bull-market charge.
After falling behind other surging semiconductor stocks earlier in 2026, Nvidia has recently been reestablishing its position as the “king of the AI trade.”
On Thursday, the first and largest U.S. ETF tracking the “Magnificent Seven”—the Roundhill Magnificent Seven ETF—surged nearly 2.5% to close at $70.43, just below its record closing high of $70.94 set in May this year. The ETF holds equal positions in the
post-image
ThisIsTranslateContent:
$NVDA Nvidia May Reclaim the “Throne”
US tech giants’ stock prices are once again approaching record highs—and this time, Nvidia is clearly the player leading the bull market charge.
After falling conspicuously behind other surging semiconductor stocks earlier in 2026, Nvidia has recently begun reasserting its position as the “king of the AI trade.”
On Thursday, the first and largest US-listed ETF tracking the “Magnificent Seven”—the Roundhill Magnificent Seven ETF—surged nearly 2.5% to close at $70.43, approaching its record closing high of $70.94 set in May this year. The ETF holds equal-weight positions in the seven tech giants—Microsoft, Apple, Nvidia, Alphabet, Amazon, Meta, and Tesla—and rebalances quarterly.
In recent months, the “Magnificent Seven” stocks have shown clear divergence. Of the seven constituents, Nvidia and Apple are closest to their record highs, with both less than 3% below their all-time highs. Meanwhile, Alphabet, Meta, and Tesla have fallen by double digits from their record highs.
Nvidia’s stock has recently gained strong momentum, boosted by its robust earnings report last week. In its latest earnings report, the company said it expected revenue for the fiscal year ending January 2028 to grow by more than 70%.
Joe Tigay, portfolio manager at Equity Armor Investments, wrote in a report last week that the earnings results showed “the buildout of AI infrastructure remains endless.”
Overnight, Nvidia received its latest piece of good news with the announcement that it would acquire Hugging Face, a popular open-source AI developer platform. In a report on Thursday, Forrester Vice President and Principal Analyst Jeff Pollard said the deal would help the chip giant gain greater control and visibility over the open-source software layer, thereby deepening Nvidia’s AI ecosystem.
Nvidia returns to the spotlight Nvidia’s market leadership once again marks a reversal in the industry landscape from earlier this year. At that time, as semiconductor stocks such as Micron Technology and Advanced Micro Devices (AMD) drove the iShares Semiconductor ETF to a record high, Nvidia was left far behind. Some analysts speculated that Nvidia had become too large, and investors were seeking differentiated semiconductor plays.
Data shows that although the iShares PHLX Semiconductor ETF (SOXX) has risen 67% year to date, the semiconductor sector as a whole has recently significantly underperformed Nvidia as investors recalibrated their expectations for some fast-growing chip stocks. Over the past three months, Nvidia’s stock has risen 7%, while SOXX has fallen 18%.
Despite shifts in market sentiment and competition from rivals, Nvidia has once again demonstrated its irreplaceability in the AI wave through strong earnings expectations and strategic reinforcement of the open-source ecosystem. As hardware infrastructure buildout continues and the software ecosystem matures, whether Nvidia can lead the “Magnificent Seven” to new highs will become a key indicator of the direction of US tech stocks. $NVDA
repost-content-media
NVDA+0.87%
MSFT-2.03%
AAPL-2.51%
AMZN-0.15%
META+0.99%
  • 1
260905 Bitcoin is at weekly level 2, with bearish risk on the 6/8-hour timeframes; ETH has a No. 2 divergence point on the 12-hour timeframe. For short-term longs, use a cost-based stop-loss and control liquidation risk. No short-term trades without a stop-loss! BTC resistance levels: 81094/82528/83643 BTC support levels: 78226/76792/75677 ETH resistance levels: 2499/2543/2578 ETH support levels: 2411/2367/2332 Place the stop-loss slightly beyond the third price level. Intraday trades should not exceed 5% of the position. Livestream times: 2:30 PM on Monday, Wednesday, and Friday, and 9:30 PM
post-image
BTC-1.45%
Load More

Join 40 M users in our growing community

⚡️ Join 40 M users in the crypto craze discussion

💬 Engage with your favorite top creators

👍 See what interests you

View More