Share your thoughts
placeholder
Article
After pumping $MINA 17 points, the time window left for you is less than 4 hours.
Current price: 0.1061. In 24 hours, it surged from 0.0877 to 0.1099, with a trading volume of 24.1M—the volume is not particularly large, but the gain is fierce enough. The on-chain light-client narrative is still intact, and the technical chart has just broken above the previous high and 0.105 resistance level, with short-term bulls in control.
Two possible scenarios: If it holds above 0.105 within 4 hours, the next target is 0.118-0.122. You can cautiously go long with a small position, setting a stop-loss at 0
MINA+15.17%
#LAPTOPDown99%tFromPeak
LAPTOP Down 99% From Peak — What Really Happened?
LAPTOP has experienced one of the most extreme launch-to-crash moves in recent memecoin markets.
From the highest Gate print of $344.77 to around $0.853, LAPTOP has lost approximately 99.75% of its peak value. Other market trackers show different highs — around $316.75 on DexScreener and $199.51 on CoinGecko — but the bigger conclusion remains the same: almost the entire launch premium has disappeared.
The interesting part is not simply how far the price fell.
It is how the market reached $344.77 in the first place.
Fro
By the time I got back from a bathroom break, the candlestick chart had already wiped out my losses for me. $DOGE This move wore everyone down beforehand, but once it started ripping, it was fast and fierce. The position entered at 0.07003 was pushed to 0.08532, delivering +2031.02%—feels great.

During the intraday plunge, I watched the minute chart: the key level held, the bottom moved sideways, and buying pressure kept strengthening. I had only one thought then: at this level, I wasn't afraid to take another entry. And it delivered the answer.

A quick note on position management: take 8
post-image
DOGE+1.51%
ZEC+2.04%
ETH+4.21%
I didn’t do anything—just went to the restroom, and when I came back, the candlestick chart had already done the work for me.

When the sell-off started in the morning, $SOL ’s rebound looked weak no matter how I viewed it. Every step down from the highs came with volume, while each rebound was weaker than the last. Trapped positions overhead were clearly weighing on the price, and the funds only wanted to use the rebound to exit—no one was genuinely willing to buy. I followed the short direction at 103.42, with protection set above the rebound platform. At the time, I only reminded everyone
post-image
SOL+2.07%
XRP+0.73%
ZEC+2.04%
#晒出带单成就 #速来!跟我赚钱##稳健带单长线收益#The first copy-trading customer grew their funds from 100u to 101.47u in one day.
#eth Tonight’s liquidity sweep was quite something—the market maker really knows how to play. Stop-losses aren’t scary; emotions are. After getting stopped out, we’ll get back in and fish for another opportunity. The market is waiting for its chance! The short around 2635 mentioned in the livestream was also taken perfectly. Those who followed the rhythm made money—lost over thirty points and gained over eighty. Tonight was pretty good!! Rest on Saturday and Sunday; see you in the livestream around 9:15 p.m. next Monday!
ETH+4.21%
  • 1
Nobody is talking about the quiet setup forming in $DOGE /USDT right now.

$DOGE /USDT - SHORT

Trade Plan:
Entry: 0.08467 – 0.08527
SL: 0.08785
TP1: 0.08281
TP2: 0.08137
TP3: 0.07921

Why this setup?
Why now? The 1h price is pinned at 0.08496 inside a tight 1h ATR of 0.001199, so the next move will be explosive. The 15m RSI at 51.25 shows neutral exhaustion, not strength, which favors the SHORT bias. The daily trend being a range means this entry at 0.08497 is a mean-reversion play against the recent high. TP1 sits at 0.08281 and TP2 at 0.08137, offering a clean two-tier reward structure.
post-image
DOGE+1.51%
Trade SanDisk, SK hynix & Micron Futures, Win Up to 1,000 USDT per User https://www.gate.com/campaigns/6227?ref_type=132
post-image
SKHY+0.34%
MU+0.12%
$ETH Signal】4H bullish expansion + 1H pullback for a long entry
$ETH Pullback confirmation after the 1H breakout, with the 4H MACD bullish histogram expanding to 9.5016; the current price of 2570 is holding near the 1H Bollinger upper band at 2597.53.
The order book bid/ask ratio is 1.36, depth imbalance is +15.10%, and bids are densely placed below. The 1H RSI is 64.26, and the 4H RSI is 67.64. Hot-coin temperature remains acceptable, with the extreme overbought zone not yet reached. The 1H MACD histogram is contracting at 13.9415, indicating cooling short-term momentum. OI Stable, funding r
post-image
ETH+4.21%
Altseason Phase 2 Confirmed !
ETH broke out while BTC went sideways
ETH BTC ratio printed a bullish weekly GOD CANDLE 🚀
Not only this :
$NEAR pushed to local ATH
$VVV above its ATH
$AVAX successful retest
$LINK holding $11 region
$KAS around $1B market cap
This tells us that Phase 3 is closer as well
→ Phase overlap comes next, where large caps start absorbing flow and buy ups get visible on the chart, not just in sentiment
→ Five large caps moving together while ETH leads is the early signature of that overlap forming right now
→ Phase 3 is when large caps go fully parabolic, and the names p
post-image
ETH+4.18%
BTC+0.30%
VVV-2.93%
AVAX-0.91%
KAS-0.95%
#GateMeme
#GT
GT Market Analysis: Why I Believe GateToken Still Has More Room to Grow
GT is currently trading around $9.23, and in my view this price puts GateToken at an important stage of its market journey. The earlier recovery from the $6–$8 region has already changed the technical picture, but the next question is whether GT can turn this momentum into a sustained expansion toward $10, $12, $15 and potentially higher levels. I remain constructive on GT because three major factors are working together: Gate’s expanding ecosystem, the real utility of GT, and the substantial reduction in t
#GateMeme
🔥 Gate Meme TradingView Setup: Is the Next Meme Move Being Prepared?
Meme coins are moving fast again, but this time I am not interested in simply chasing the biggest green candle.
I am watching something more important:
Is meme liquidity preparing for another rotation, or are traders still reducing risk?
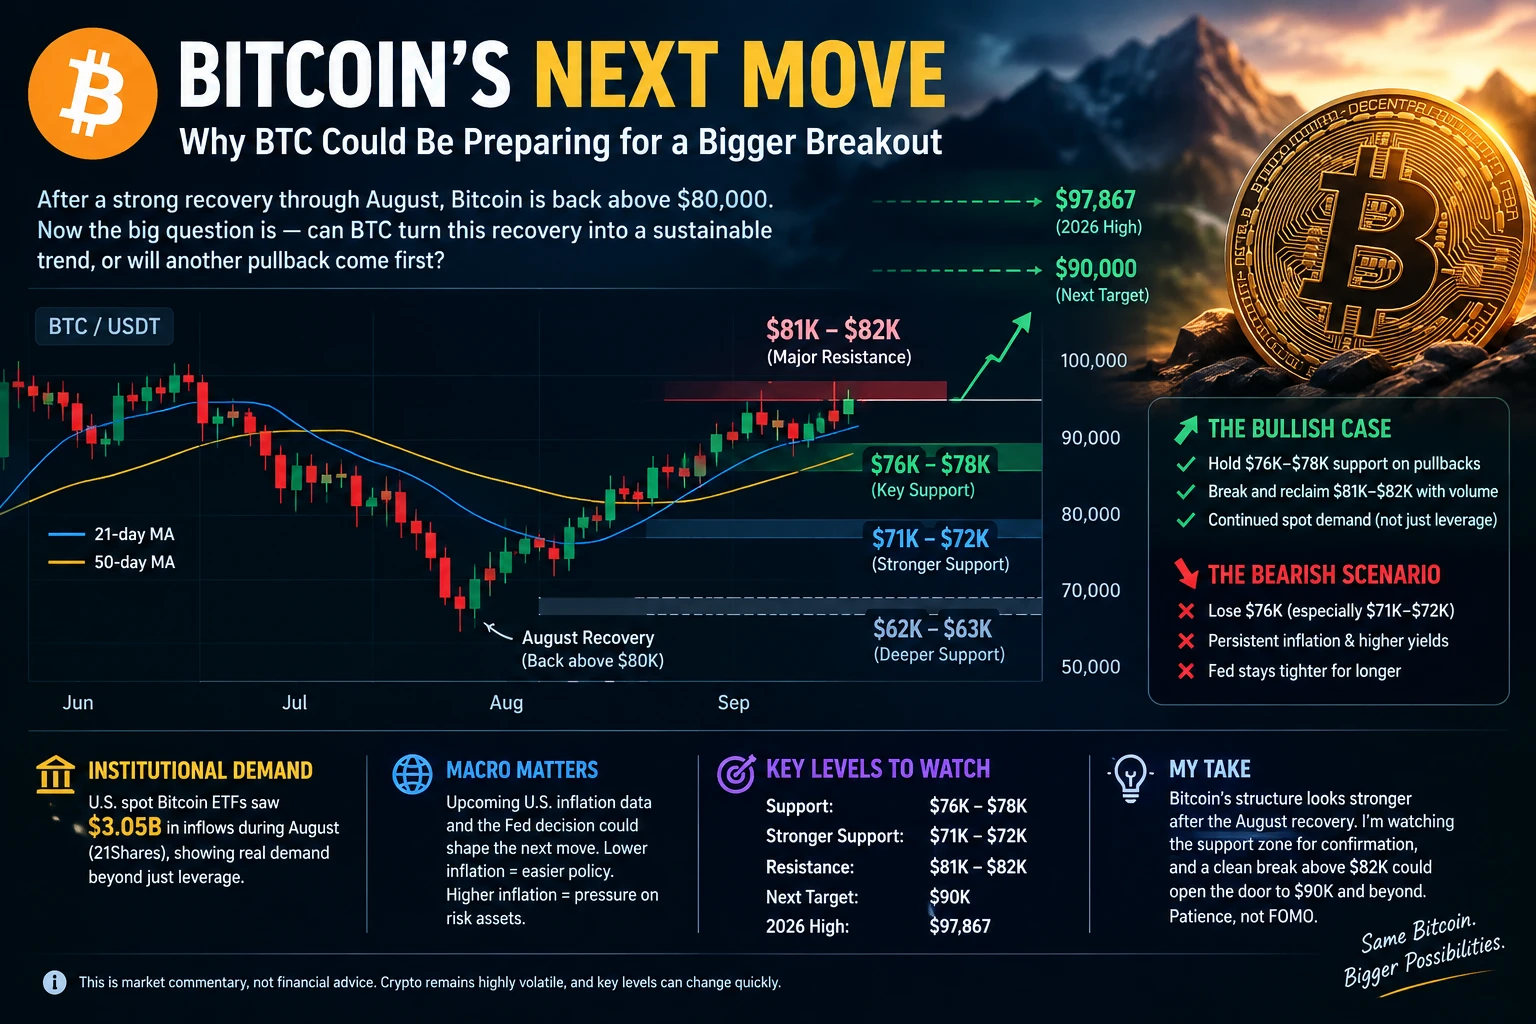
The latest market action gives us a very interesting setup. Bitcoin has pulled back toward the $78K area after recently trading above $82K, while speculative assets have suffered a much sharper correction. The CoinDesk Memecoin Index was down around 10% over 24 hours in the latest
80,000 #BTC The city gate is in sight! BTC TP2 secured, all three limit orders hit
BTC’s rally continues: entered at 76,200 after catching the wick, target 1 at 77,144 secured, target 2 at 78,444 also hit tonight, with a high of 79,855—just $145 short of the 80,000 mark.
Battle report: BTC secured both targets; ETH broke through three levels with a single 10.9% bullish candle; gold caught the wick at 4,295 and reached 4,354. Three limit orders, three assets, all hit.
Now for two legendary home-guard trades: BTC 150x, from 58,276 to 79,670, +5,464%; ETH 150x, from 1,513 to 2,648, +11,172%. Sho
post-image
NVDA+0.44%
🐋 WHALE WATCH : Sellers are rushing for the exits while buyers are ghosting the market.
Home sellers: Multi year high
Active buyers: < 1000000
When inventory surges past demand like this a price correction isnt a prediction anymore its math.
Are you sitting on cash or waiting for rates to drop ?
post-image
Nobody is talking about this hidden long setup in $ESPORTS /USDT right now.

$ESPORTS /USDT - LONG

Trade Plan:
Entry: 0.01035 – 0.01047
SL: 0.00962
TP1: 0.01100
TP2: 0.01140
TP3: 0.01199

Why this setup?


Debate:
Are we hitting TP2 at 0.01140 or is the daily bearish trend about to trap these longs?

⚠️ Personal market analysis only. NFA — manage risk and DYOR.
Educational content, not investment advice or a recommendation to buy, sell, deposit, or withdraw any asset. No paid promotion or referral/affiliate links.
ESPORTS-5.24%
SpaceX AI Team Will Livestream Building a Startup From Scratch! Musk is opening another AI front. Co
live-cover
LIVE1,423
$BTC $ETH Many people suffer losses and get trapped, not because they cannot understand the market, but because their mindset has become chaotic. During every data-driven market move and wick-driven shakeout, the biggest fear is not price gains or losses, but impulsive trading, stubbornly holding against the trend, and adding more as losses deepen.

With CPI recently released and macroeconomic bearish factors erupting all at once, the market has repeatedly wicked up and down, shaking out retail traders who are overleveraged, stubbornly holding losing positions, and blindly buying the bottom.
post-image
BTC+0.30%
ETH+4.18%
Crypto Academy: September 12 Bitcoin (BTC) Range-Bound Tug-of-War Is Not the End—What Trend Clues Are Hidden in the Consolidation? Latest Market Analysis and Trading Recommendations
Bitcoin is currently at 78,700. The back-and-forth volatility has been emotionally exhausting: every surge is followed by a plunge, and every dip is quickly bought back up, repeatedly stopping out both longs and shorts. Many traders have been chasing entries back and forth, watching their accounts shrink. That is how the market works. During high-level range-bound consolidation, the biggest taboo is chasing rallies
BTC+0.30%
I had just switched the app to the background when it suddenly plunged—was it playing hide-and-seek with me? It put me in a very passive position.
When I checked the chart after lunch, $BTR was still pretending to be strong, but trading volume was low and buying support was insufficient. One hit from the sell orders and its true colors showed. I judged at the time that this rebound wouldn't go far, so shorting was safer than chasing longs.
It later delivered the answer: from 0.17647 to 0.04967, a floating profit of +1413.56%. No operation, no analysis—just a comfortable entry point.
Close 80%
post-image
BTR+4.13%
XRP+0.73%
LAB+47.41%
How to Identify Trends in Crypto Markets
live-cover
LIVE1,293
Load More

Join 40 M users in our growing community

⚡️ Join 40 M users in the crypto craze discussion

💬 Engage with your favorite top creators

👍 See what interests you

View More