
Square
Following
Hot
News
Profile
Share your thoughts
placeholder
Article
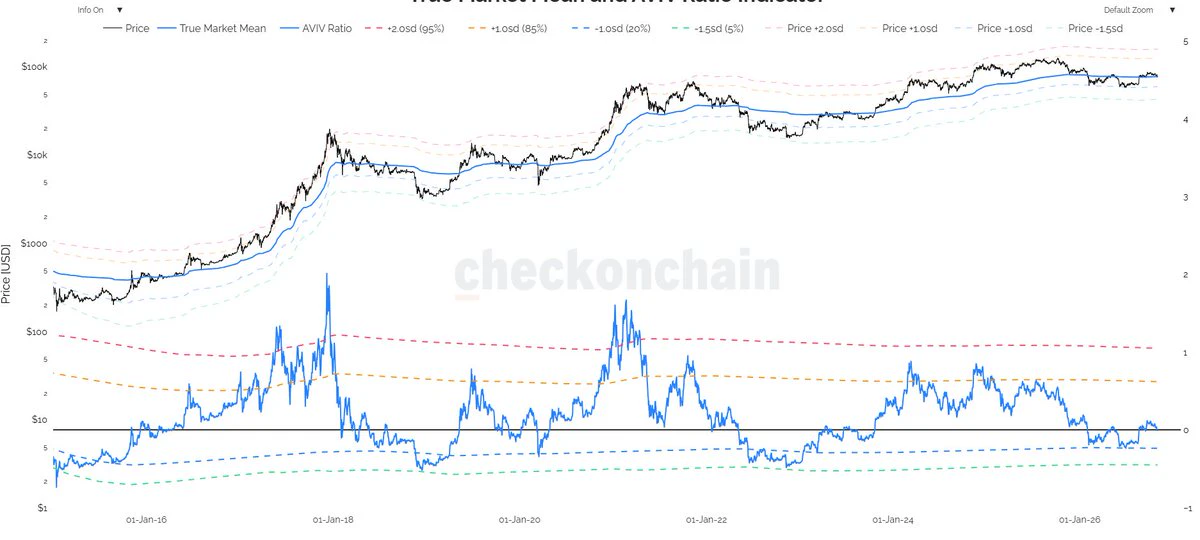
$BTC is right at the True Mean.
You know what to do 🫡
post-image
BTC-0.67%
Detected a Korean actress automatically sending a chaebol.
post-image
Trenches
ZIG
Z
bade
b
ZIG
0x8c...1145
Market Cap
$.
Change
.
24h Vol
$.
Holders
.
KIM
K
bade
b
KIM
8pjf...pump
Market Cap
$.
Change
.
24h Vol
$.
Holders
.
Anakin
A
bade
b
Anakin
Exxz...pump
Market Cap
$.
Change
.
24h Vol
$.
Holders
.
IDOL
I
bade
b
IDOL
0x3b...ab07
Market Cap
$.
Change
.
24h Vol
$.
Holders
.
BTC
B
bade
b
BTC
C5xp...pump
Market Cap
$.
Change
.
24h Vol
$.
Holders
.
Someone opened a short position worth $45,200,000 using 20x leverage$ETH . Liquidation price: $3,188
post-image
ETH-1.23%
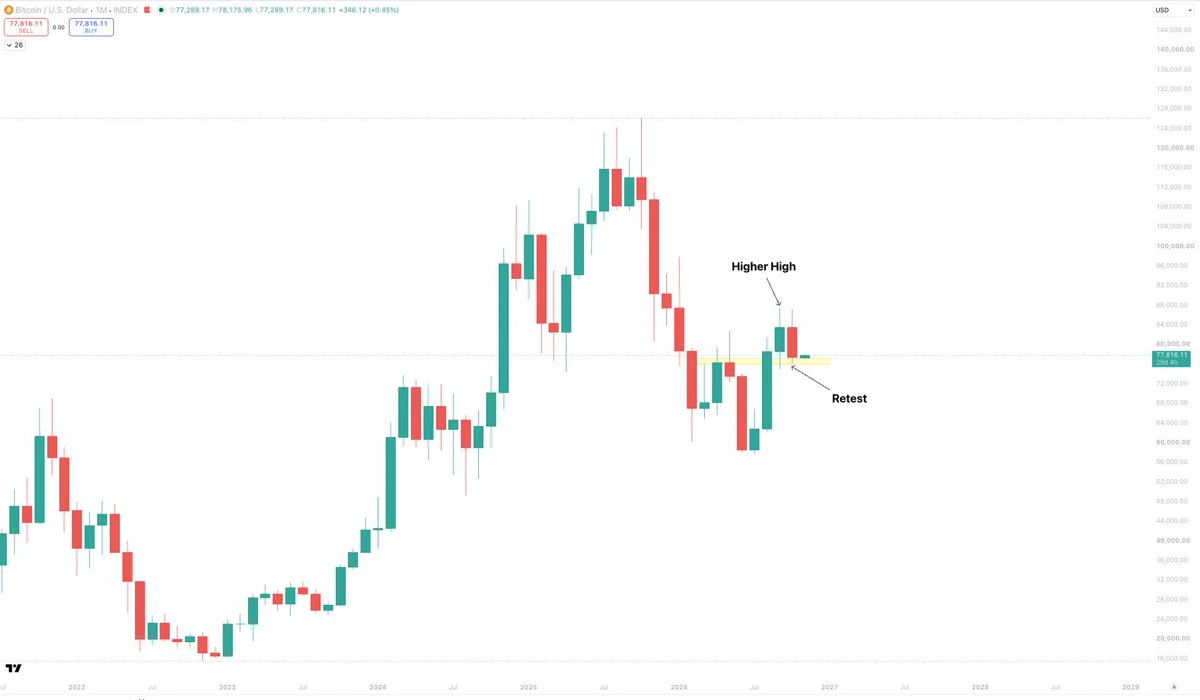
There is nothing bearish about Bitcoin here.
When in doubt, zoom out.
All of the market chaos that has just unfolded has happened within that one monthly red candle.
A candle that has simply put in a retest of the bearish break of structure, after Bitcoin put in its first monthly higher high in over one year.
If you had no idea about the news or narratives, and you simply looked at this chart, you would be bidding hard.
Bidding the retest of the breakout is your second best entry after the bottom.
The biggest players use the monthly chart and a retest of the bearish break, is something they wo
post-image
BTC-0.67%
Swoosh swoosh
🎭
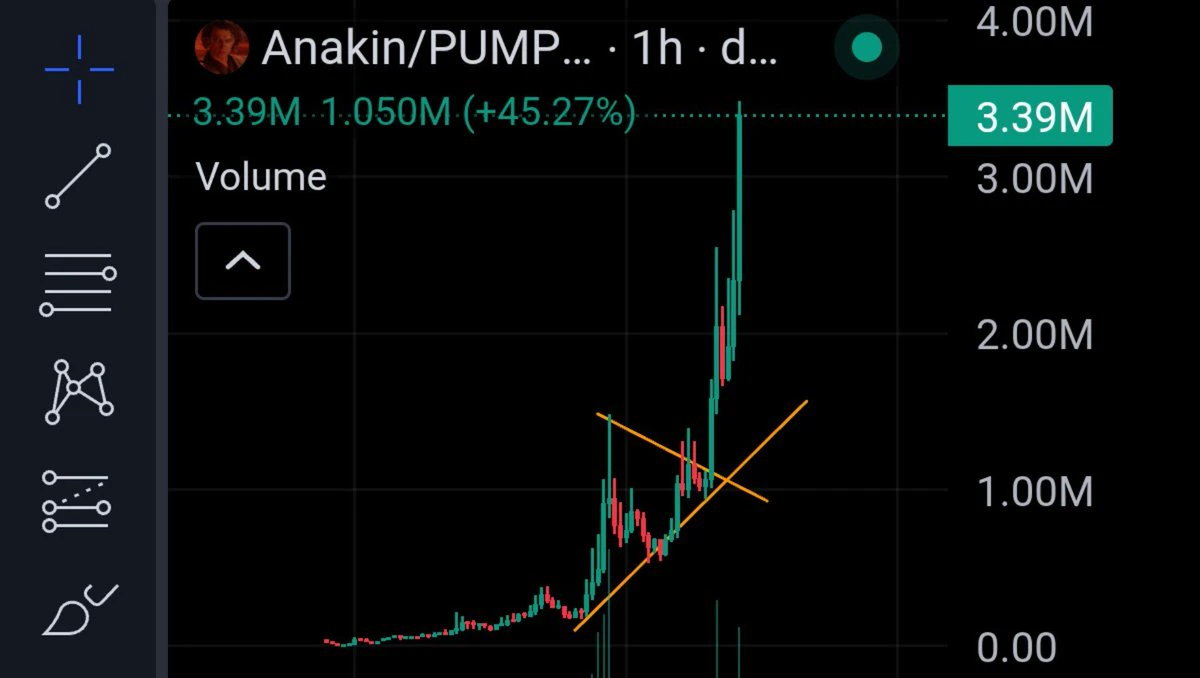
$ANAKIN BREAK OUT
post-image
Went long on altcoins ta, xpin, based, lyn, etc. Will see how they perform in a few days. Still short BTC and ETH. $TA T​A​U​S​D​T0.06 perpetual +1.96% ‌$BASED $LYN #山寨币 #比特周周 $TA $BTC $ETH
post-image
TA+10.43%
BTC-0.65%
ETH-1.23%
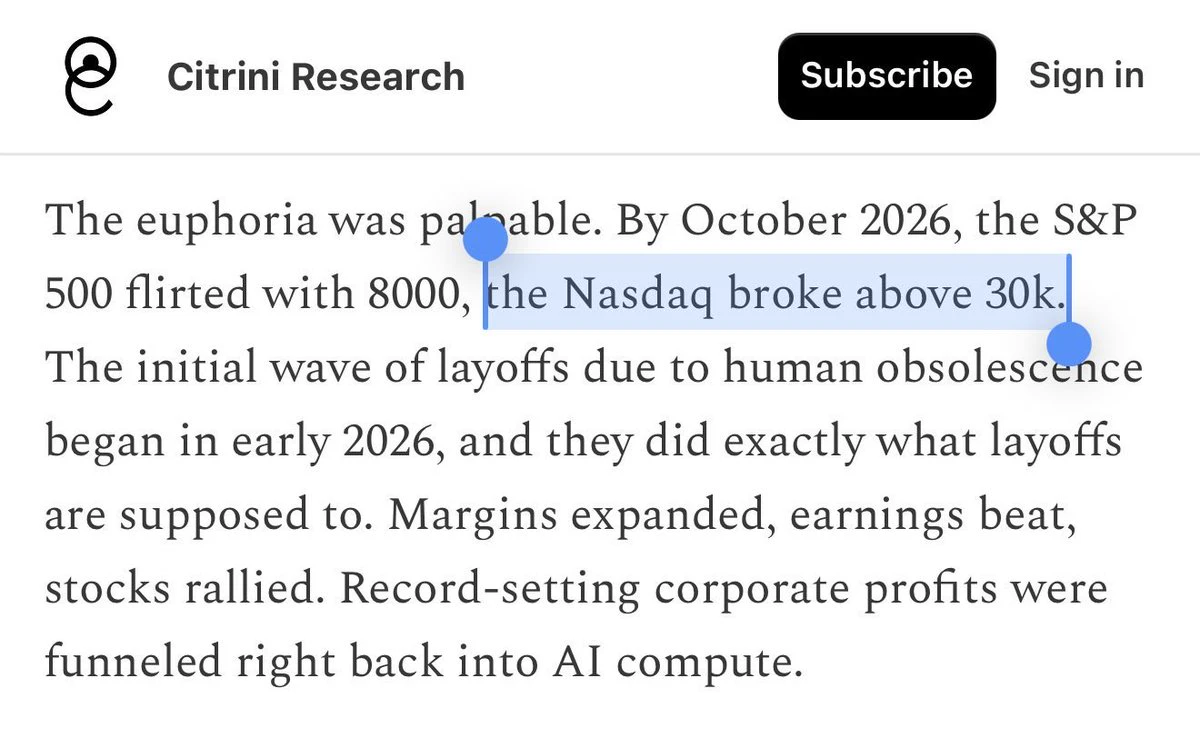
Who still remembers that Citrini Research thought Nasdaq would hit 30,000 and SPY would approach 8,000 in October 2026?
post-image
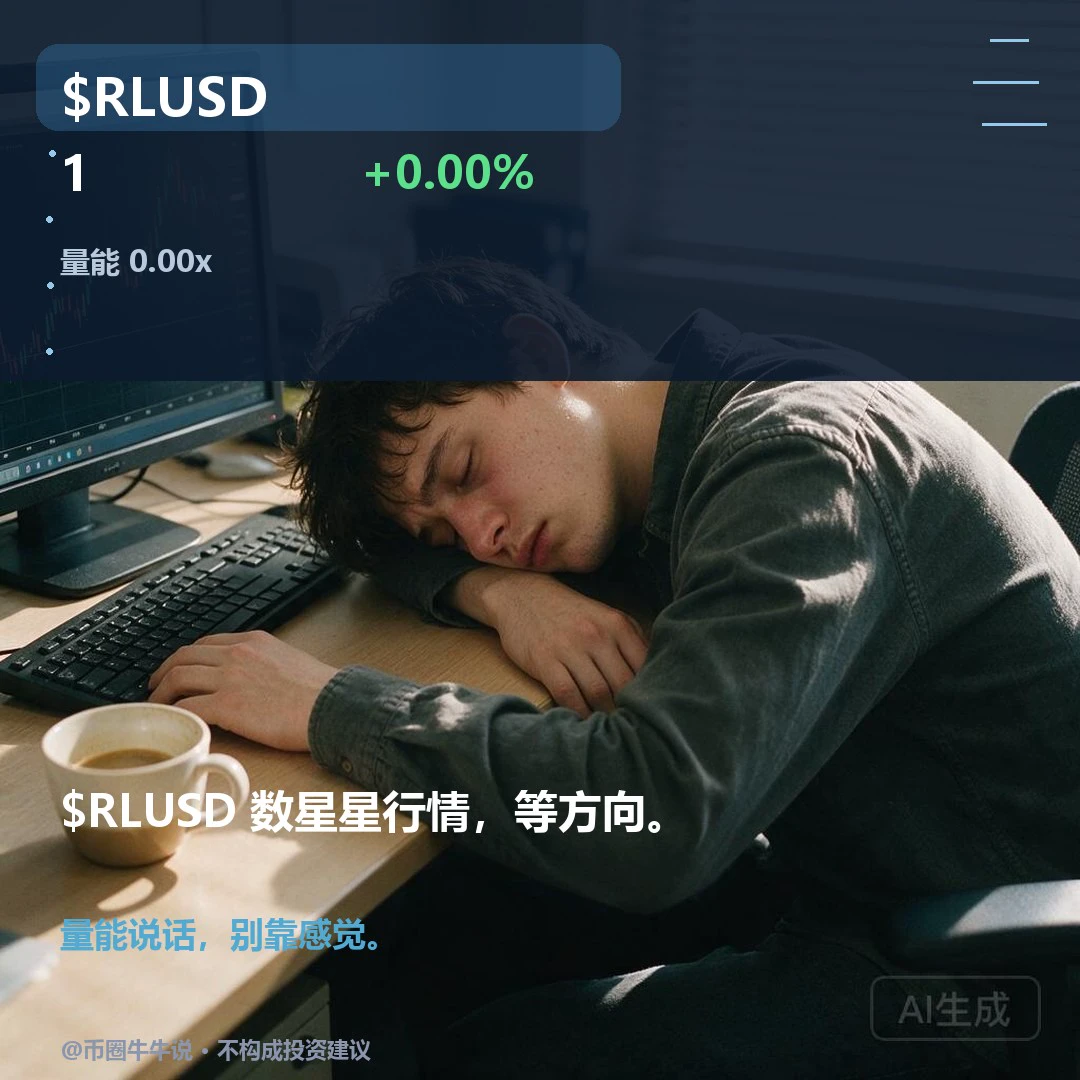
Weak, $RLUSD the current price is 1.0012. The four-hour RSI has entered the oversold zone, but both the one-hour and four-hour trends are weak. Oversold only indicates that selling pressure has occurred; it does not prove the price is cheap.
The one-hour RSI remains neutral, and the price is also tracking close to the one-hour moving average, indicating that no short-term bottoming structure has formed. The combination of an oversold four-hour RSI and a weak hourly trend looks more like a pause in a decline than a reversal. If being oversold could automatically stop a decline, why hasn’t the
post-image
RLUSD+0.00%
MARKET UPDATE
live-cover
LIVE1,523
$ARIA Longs are back... still room to rise$ARIA The 1-hour chart shows strong bullish momentum. Price has decisively broken above the previous consolidation range, signaling renewed buying pressure. Buyers are gradually taking control, and the next move could be higher. Long entry: $0.0875–$0.0885 Take profit: $0.0915 Stop loss: $0.0860 Buy and trade $ARIA
post-image
ARIA+22.03%
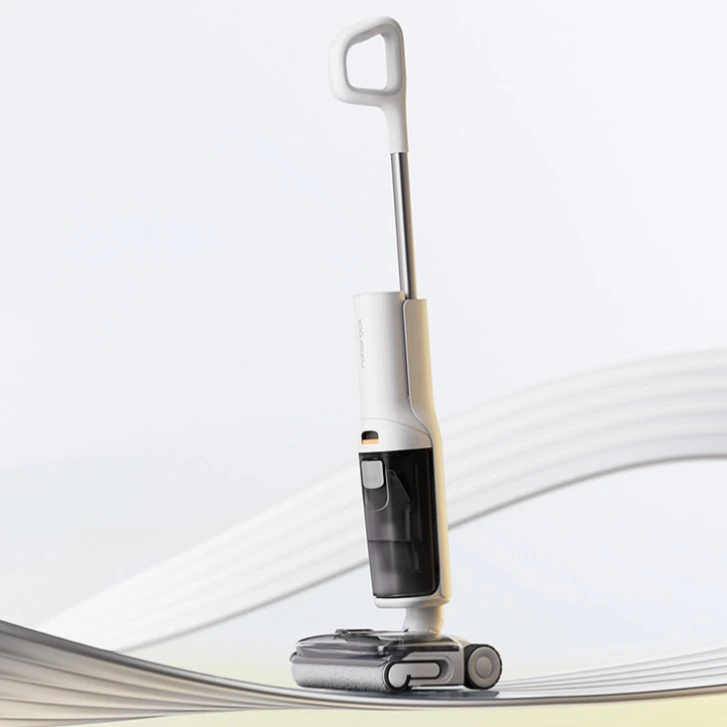
The Roborock A30 Max floor washer has an official price of 3,299 yuan, but today’s promotion lets you get it for 728 yuan if you follow the steps: claim the 88VIP 1,500-150 coupon, ask customer service to note the cashback, pay more than 1,380 yuan, then post a review to get 680 yuan back and complete the Taobao Coins steps.
Compared with flagship features, 728 yuan is indeed low, but you have to pay more than 1,380 yuan upfront and wait for the cashback. That means fronting cash in exchange for a discount, so if your budget is tight, don’t focus only on the headline price.
$BTC
#量化达人# Let’s t
post-image
BTC-0.67%
#晒出我的持仓收益 The trading volume is so low, I'm getting out of here
$AWE — LONGentry: 0.06268tp1: 0.06456tp2: 0.06644stop: 0.06017AWE has dropped considerably from its daily high. A bounce from this region could put 0.06644 back within reach.
post-image
AWE-0.67%
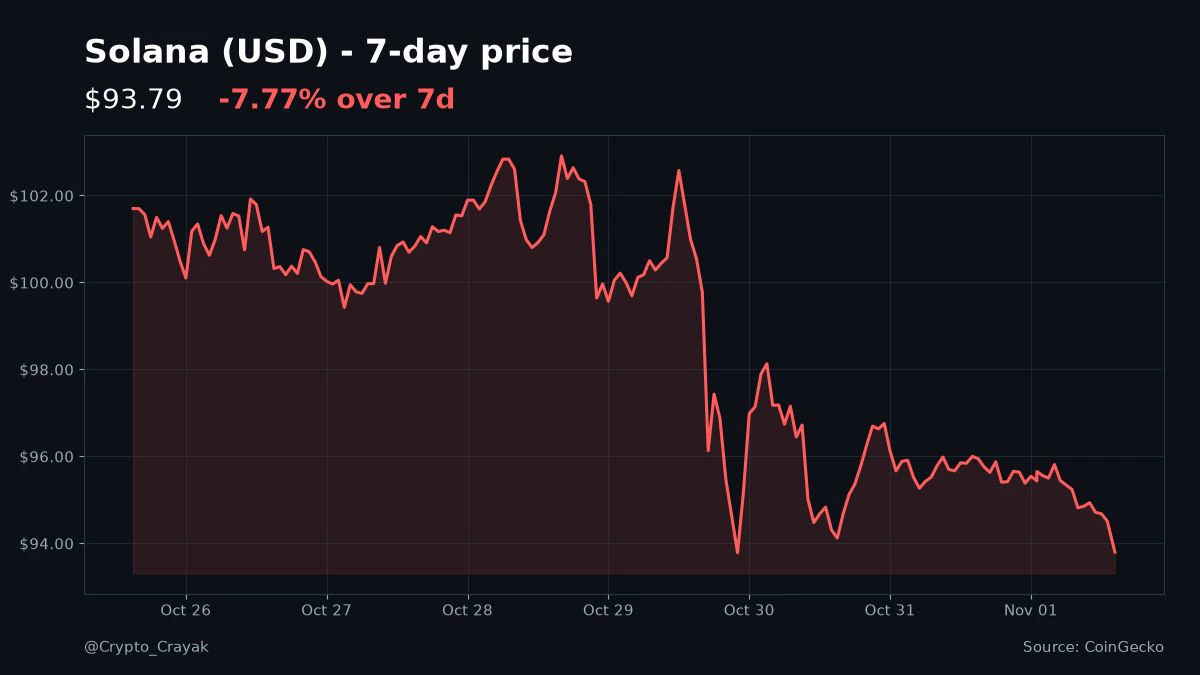
$SOL just slipped to about $93.80, basically the low of the week and down almost 8% since last Sunday.
Not a dramatic dump, more like a slow leak you only notice when you check the chart.
Where's your line in the sand for adding more? #Solana
post-image
SOL-0.77%
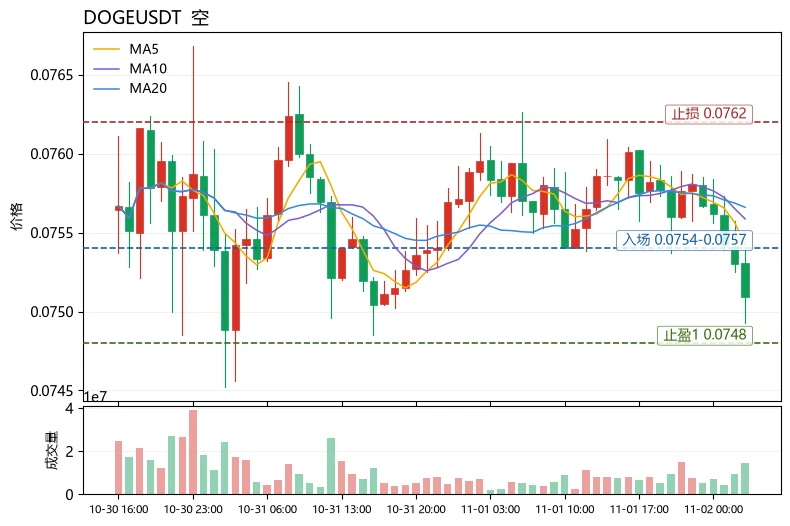
$DOGE $DOGE is currently at 0.0751. Key short-term levels are the lower Bollinger Band at 0.07523 and MA5 at 0.07542, with 0.0748 as the bulls’ last line of defense for the day. The Fear and Greed Index is at 34, in the fear zone. The broader market lacks fresh capital, and BTC’s weakness is a negative influence on the meme sector. DOGE is down 0.99% over 24h, with trading volume of only 13.4M USDT, indicating a low-volume decline rather than panic selling. Technically, MA5 is below MA20, and the MACD histogram remains bearish at -6.798e-05. RSI at 35.7 is nearing oversold territory but shows n
post-image
DOGE-0.22%
TAO+0.41%
ADA-1.48%
#Gate广场万圣节 Boom—fourth time 😎✋
$ON
Count how many times we've gone in 😁✋...$Q
‍$BTC
post-image
ON+4.77%
BTC-0.67%
market update
live-cover
LIVE3,031
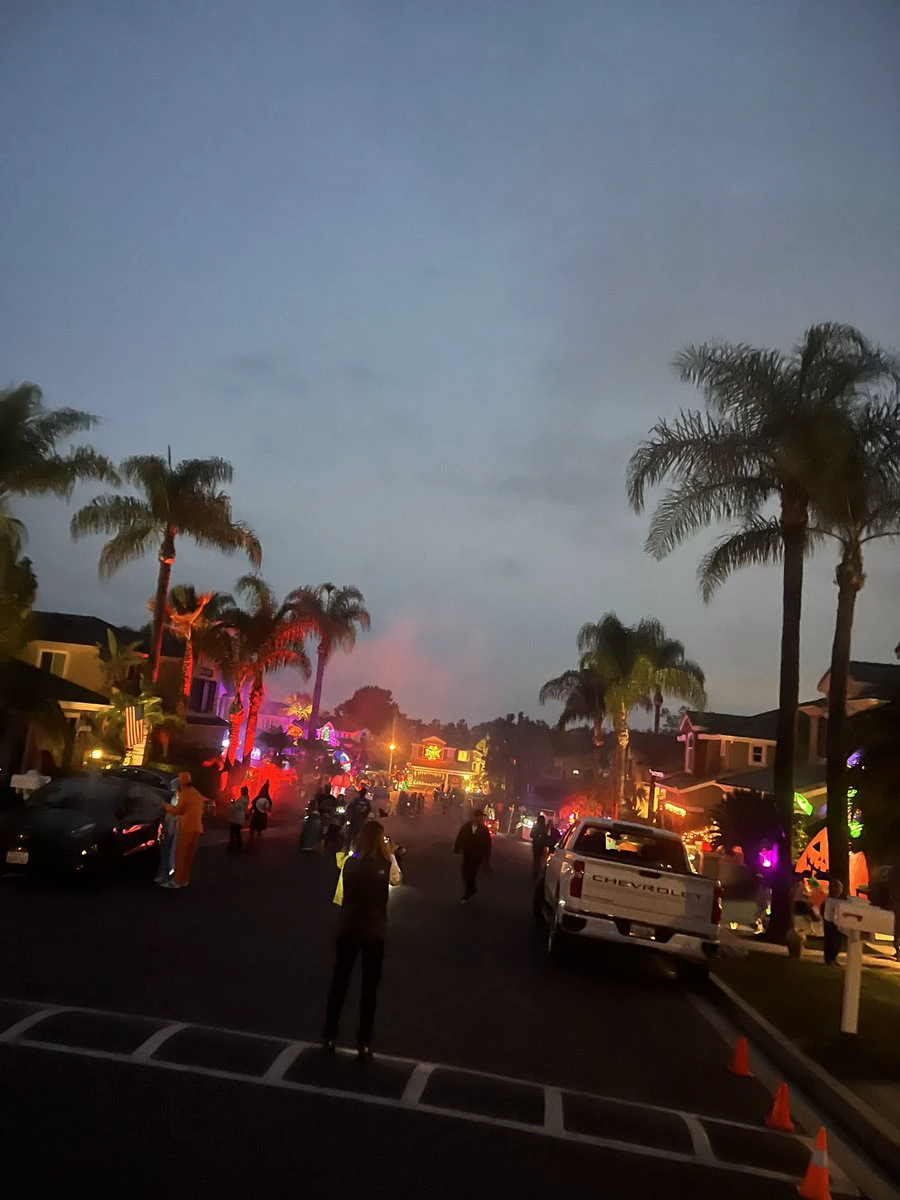
Had a great Halloween with the fam 🎃
post-image
#BTC大跌
The October monthly candle closed in the red: a drop from ~$83,556 to ~$77,424 (-7.3%). This marks the weakest October since at least 2016, setting a cautious tone for November, which is historically unpredictable (closing green 5 out of 10 years, and red the other 5).
📊 Technical Overview by Timeframe
· Monthly (1M): The price is at the lower Bollinger Band (LB ~$51,917) but remains above it. MACD is in negative territory, and the histogram is shrinking — selling pressure is weakening, but there is no reversal yet.
· Weekly (1W): The price is between the middle and lower bands (MB ~$
BTC-0.67%
  • 10
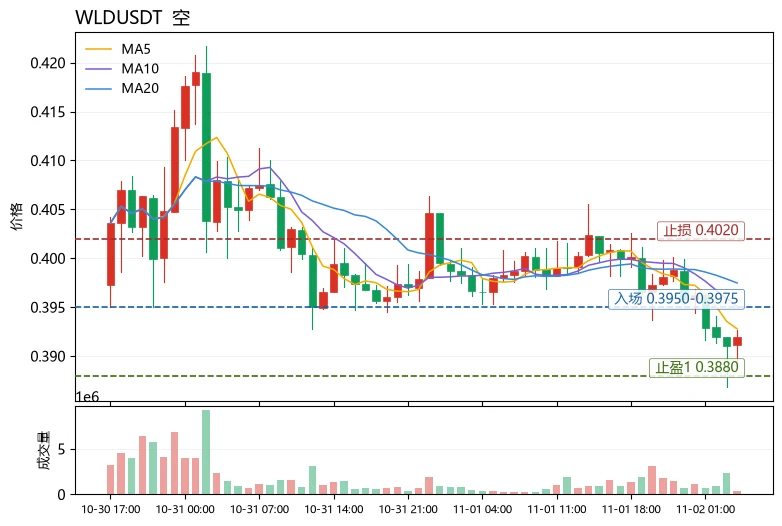
Many people use “it’s down, so it’s cheap” as a reason to buy the dip, but overlook whether the trend itself is healthy. The criteria are actually quite mechanical: moving-average alignment indicates direction, RSI and MACD indicate momentum, and Bollinger Bands indicate position. Take $WLD as an example: the current price is 0.3919, and MA5=0.39278 is already below MA20=0.39747, with the short-term moving average crossing below the medium-term one, indicating a weak trend structure; RSI=36.3 is near the weak zone but not extremely oversold; the MACD histogram at -0.0007791 indicates bearish
post-image
WLD-5.61%
MARSCOIN-4.38%
DOGE-0.22%
Load More

Join 40 M users in our growing community

⚡️ Join 40 M users in the crypto craze discussion

💬 Engage with your favorite top creators

👍 See what interests you

Trending Topics

BTC大跌

515.45k Views39.92k Discussing

$BTC briefly fell below $77,000 and remains under pressure around the $77K zone, with its 24-hour decline still above 4%. With risk appetite weakening and Fed uncertainty rising, where is the next key support after losing $80K?

IntelBeatsEarningsButStockPlunges

48.6k Views1.09k Discussing

StrategySTRCNears100ParValue

57k Views4.22k Discussing

View More