Square
Following
Hot
News
Profile
Share your thoughts
placeholder
Article
Google has truly sent AI computing power into orbit. The satellite computing node deployed on October 1, equipped with four self-developed TPUs and running the Gemma 4 model, completed humanity’s first AI conversation in space—the ground sent just one prompt, “Write a short space poem,” and the satellite performed inference in orbit before sending the poem back to Earth. Satellites are evolving from information-gathering devices into mobile data centers.
Compared with building large data centers on the ground, substations, power grids, land, cooling, and water supply are all capital-intensive
post-image
GOOGL-1.32%
SPCX-6.34%
#StrategySTRCNears100ParValue #ShareWeekly
Strategy’s STRC Preferred Stock Nears $100 Par Value: Detailed Analysis
Strategy Inc’s Variable Rate Series A Perpetual Stretch Preferred Stock (Nasdaq: STRC) has been trading close to its designated $100 stated amount (par value) in recent sessions. This post examines the situation across the eight core points with current market data, technical levels, chart observations, and trading considerations as of late October 2026
1. STRC approaching its original face value of $100
STRC is designed with a $100 stated amount per share. Recent closes have clu
  • 3
Trenches
KIM
K
bade
b
KIM
8pjf...pump
Market Cap
$.
Change
.
24h Vol
$.
Holders
.
ZIG
Z
bade
b
ZIG
0x8c...1145
Market Cap
$.
Change
.
24h Vol
$.
Holders
.
GTA6
G
bade
b
GTA6
4kjr...zDnz
Market Cap
$.
Change
.
24h Vol
$.
Holders
.
BTC
B
bade
b
BTC
C5xp...pump
Market Cap
$.
Change
.
24h Vol
$.
Holders
.
IDOL
I
bade
b
IDOL
0x3b...ab07
Market Cap
$.
Change
.
24h Vol
$.
Holders
.
MARKET UPDATE
live-cover
LIVE1,560
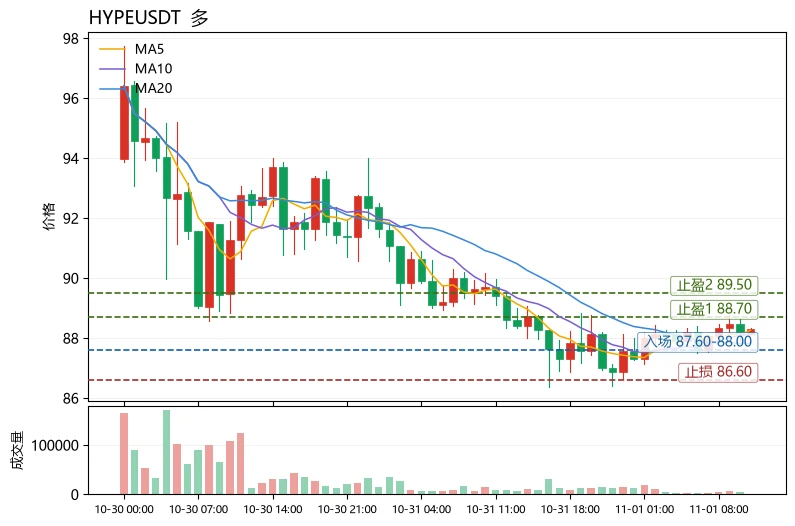
$HYPE Current price is 88.32, down just 1.78% over 24h, with a trading volume of 21.4M USDT—the only one of the three candidates with volume above 20M. MA5=88.264 remains above MA20=87.8265, the MACD histogram at +0.1574 remains bullish, RSI is neutral at 49.6, and the Bollinger Bands are contracting at 86.9513–88.7017, with an amplitude of about 4.46% over 30 candles. Comparison: $QNT is up 4.15% over 24h, but its MACD histogram at -0.2237 shows bearish divergence, and its 9.54% amplitude means excessive volatility; $CELO is up 0.13%, but MA5 is below MA20, the MACD has turned bearish, and
post-image
HYPE+0.24%
QNT+4.79%
CELO+1.37%
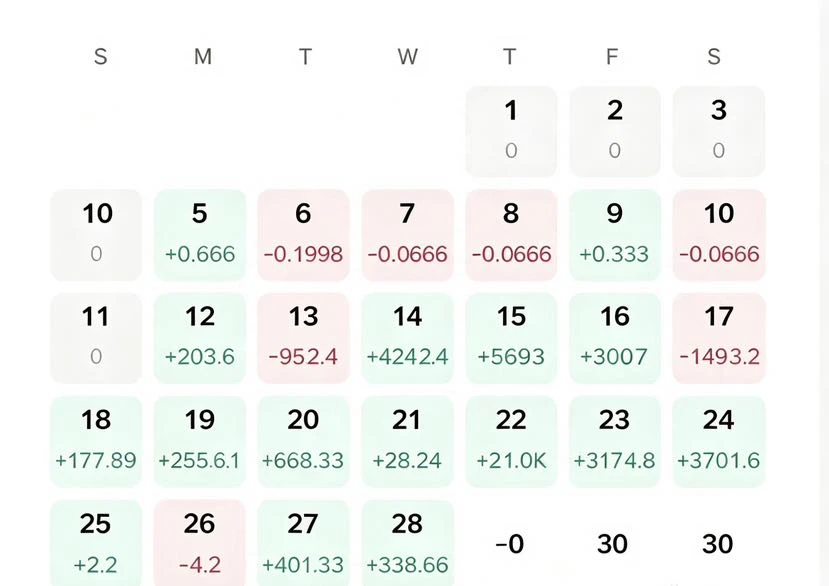
My younger sister is a total beginner and has been trading with 300 U for half a month. Could everyone take a look?
Is her performance good or bad?
post-image
Are teachers these days really this rude?
post-image
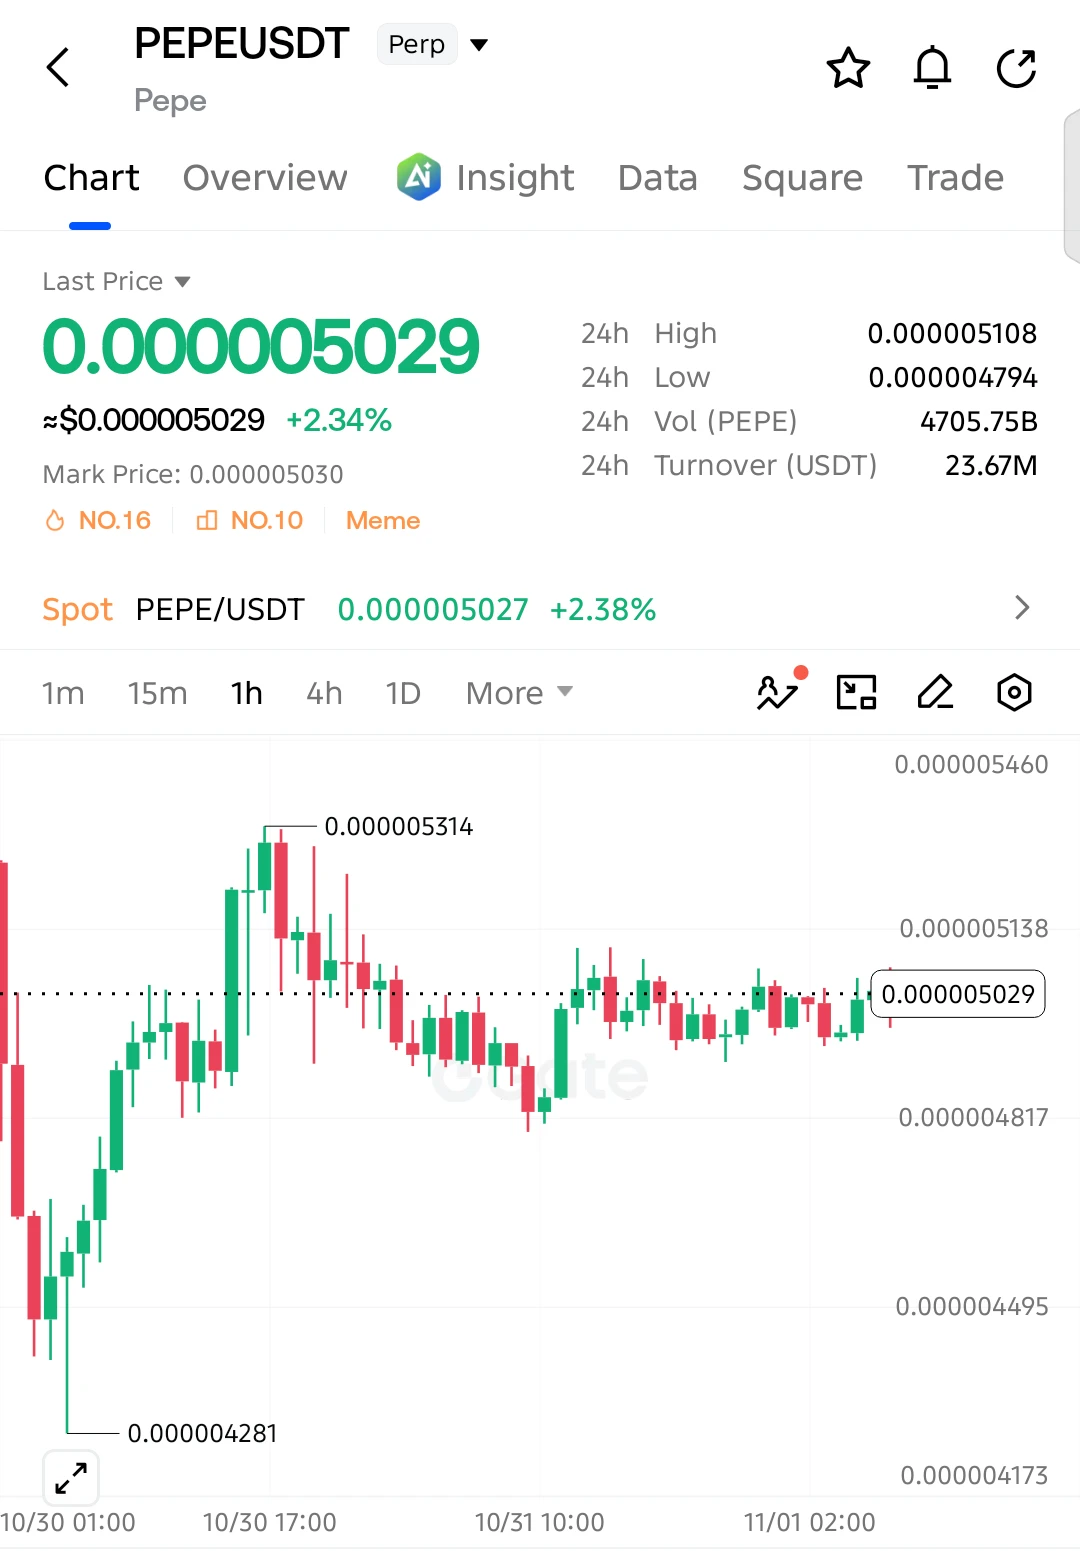
$PEPE LONG SETUP — BREAKOUT LOADING?
Entry: 0.000005029
SL: 0.000004790
TP1: 0.000005108
TP2: 0.000005200
TP3: 0.000005314
Final Target: 0.000005460
$PEPE is consolidating on the 1H chart after recovering from 0.000004281. Buyers are defending the 0.00000480–0.00000490 support zone, while price is testing resistance near 0.00000510. A confirmed breakout above this level could open the door toward 0.000005314 and beyond.
The bullish setup remains valid above 0.000004790. A breakdown below this level would invalidate the recovery scenario.
post-image
PEPE+0.97%
  • 6
  • 1
Starting next week, buy the Nasdaq index more as it falls.
Keep buying until fully invested, prioritizing spot. No problem.
You don't get an opportunity like this often. U.S. stock indexes won't leave you holding the bag. Hold on; if you can't, go grab a hoe. Starting next week, buy the Nasdaq index more as it falls.
Keep buying until fully invested, prioritizing spot. No problem.
You don't get an opportunity like this often. U.S. stock indexes won't leave you holding the bag. Hold on; if you can't, go grab a hoe. Starting next week, buy the Nasdaq index more as it falls.
Keep buying until ful
NAS100-0.07%
NDAQ+0.65%
BTC-0.67%
  • 1
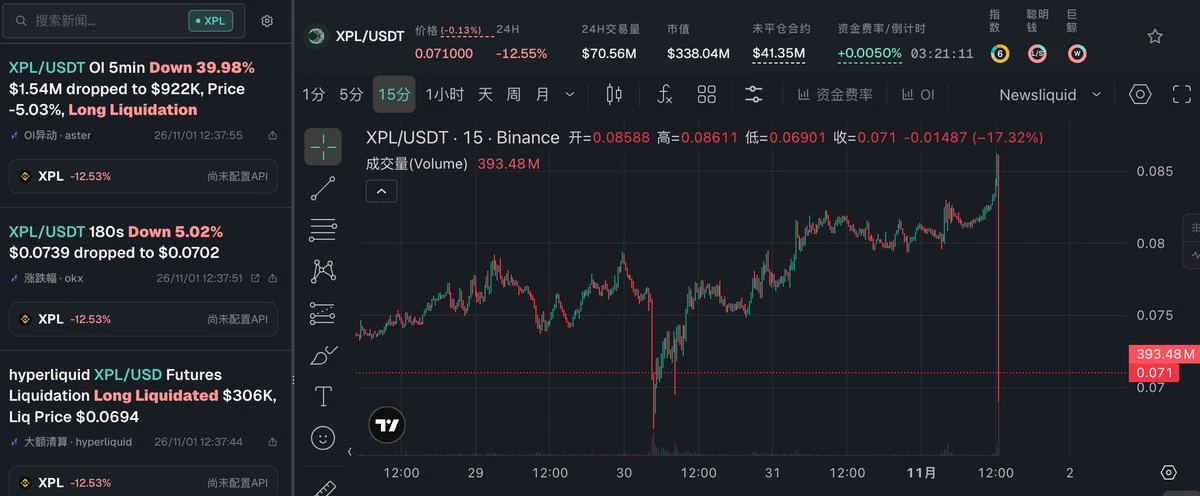
🚨⚠️About $1.7 million was liquidated in one minute, and it dropped 15%. $XPL What happened??
post-image
XPL-0.60%
  • 2
$SEI I know SEI has been down since launch, but its fundamentals remain strong.
I'm holding it for the mid to long term and keeping it in a Smart Rebalance bot while patiently waiting for the market to recover.
nb: no more than 5% of your portfolio per coin
$SEI #BTC大跌 $INTC
SEI-1.58%
INTC-28.49%
sunday updates with beatiful girl
live-cover
LIVE1,920
#Gate24HNetInflowsRankTop2

Gate Strengthens Its Market Position as 24 Hour Net Inflows Place It Among the Top Two Global Crypto Exchanges
The movement of digital assets across centralized cryptocurrency exchanges provides an important perspective on market participation, liquidity conditions, and investor confidence. Gate securing a position among the top two exchanges in the 24 hour net inflow ranking is a noteworthy development that highlights its growing presence in the global cryptocurrency market. Net inflows represent the difference between assets entering and leaving an exchange, mak
post-image
GT-2.41%
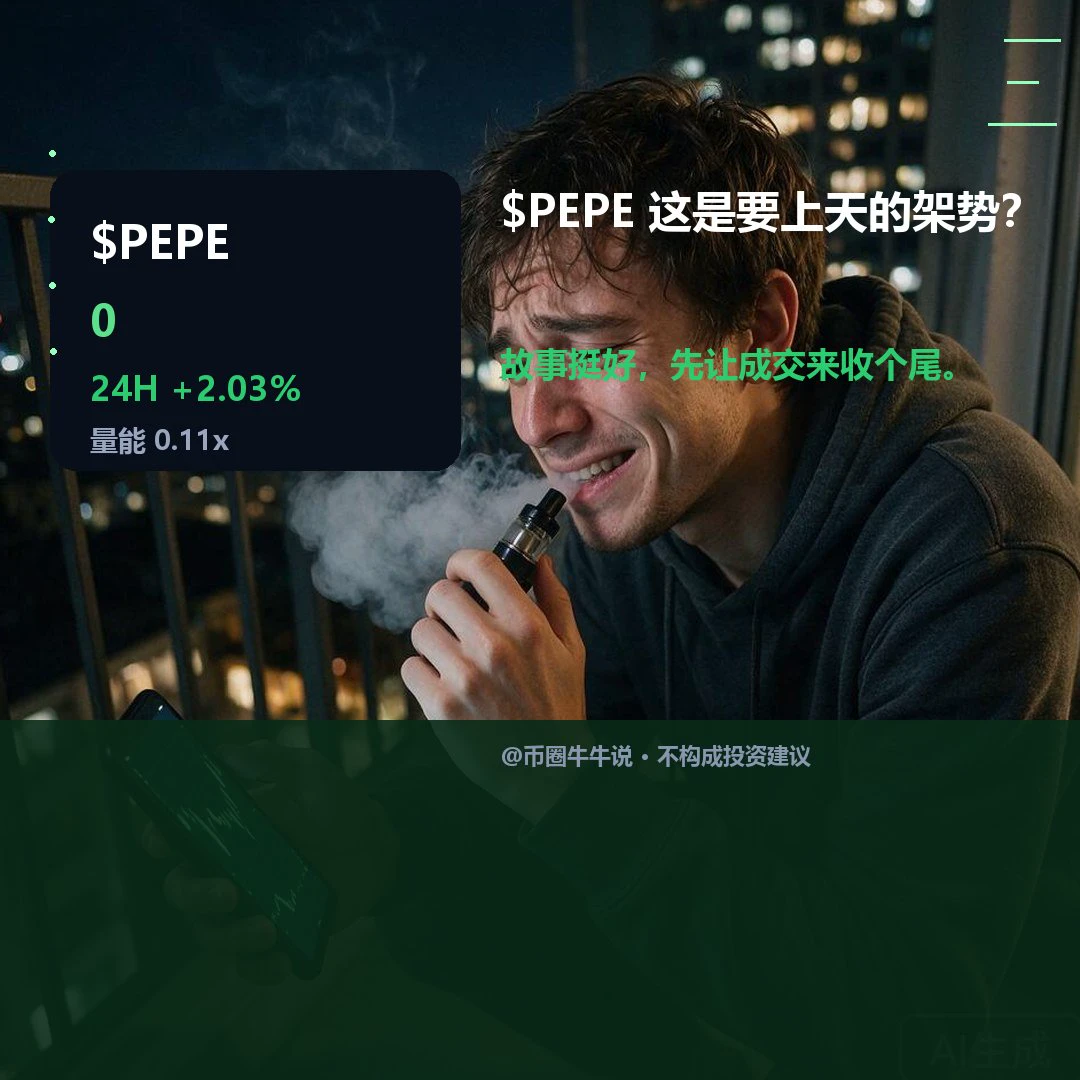
$PEPE is currently at 0.00000503, up 2.03% over 24H. The 1H trend is strong (RSI 55.32), aligning with a strong 4H trend (RSI 44.86). If it holds above the 0.00000515 resistance, watch for continuation; if it breaks below the 0.00000481 support, a pullback may follow. Going forward, focus on whether it can hold above 0.00000515 and whether it can reclaim 0.00000481 if support breaks. Trading volume is only 0.11x the average, so a single break needs participation confirmation. Markets are volatile; for observation only.
post-image
PEPE+0.97%
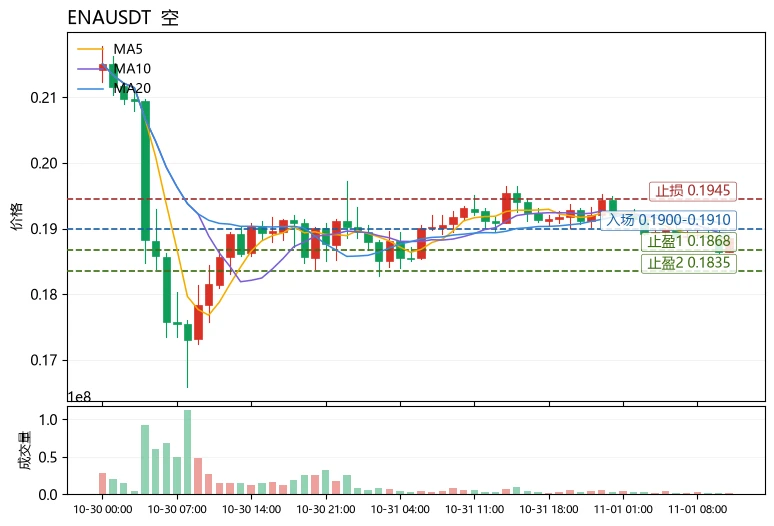
Whose ammunition costs more, longs or shorts? The answer is shorts—$ENA ’s funding rate is +0.0044%, meaning longs are continuously paying to hold their positions while the price is falling. This is a classic “crowded longs, exhausted buying” setup.
The technicals confirm this view: the current price of 0.1885 is near MA5=0.1883 but remains below MA20=0.19058, with moving average resistance still intact; RSI is only 45.0, indicating insufficient rebound momentum; the MACD histogram at -0.0004131 remains bearish; Bollinger Bands [0.186832, 0.194328] are contracting, with the price trading near
post-image
ENA+8.04%
PROM+0.45%
NEAR+1.17%
$AKE Started playing the funding rate game, collected funding once, and it still won’t drop—the damn market maker wants to have it both ways
post-image
AKE+6.07%
Let’s talk about BTC this week $BTC
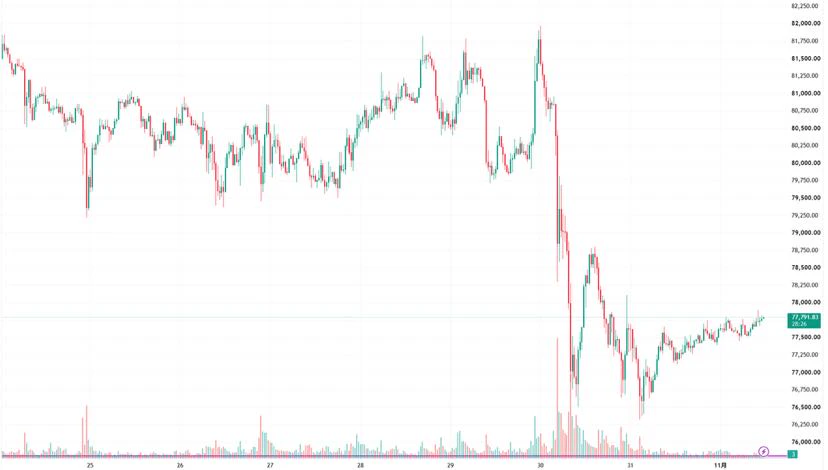
It hovered around 80k at the start of the week, briefly surged to near 82k midweek, then reversed course on Thursday and Friday, dropping as low as 76.3k. It has now recovered to around 77.7k.
It fell about 3.6% this week—a pretty ugly move 😮‍💨
The Fed held rates steady, and two officials even argued for rate hikes. Then the crypto industry was hit by a major theft, while tech stocks were also broadly pulling back.
With several things happening at once, the market went through a round of deleveraging.
I’m still leaning bearish, especially after the previo
post-image
BTC-0.65%
  • 11
  • 1
#Gate24HNetInflowsRankTop2 #ShareWeekly
Introduction
The cryptocurrency industry is constantly evolving, and competition among centralized exchanges is becoming stronger every day. In this environment, attracting capital, maintaining user confidence, and providing reliable trading services are essential for long-term growth.
Gate has attracted market attention after ranking among the top two cryptocurrency exchanges in 24-hour net inflows. This development is an interesting signal because net inflows are an important metric that market participants use to evaluate exchange activity and capita
#HYPERalliesAgainstTheMarket

Why Is HYPE Standing Out? A Beginner’s Guide to Hyperliquid’s Market Strength
Is it possible for one cryptocurrency to show strength while the wider crypto market is struggling? Yes. That is exactly why traders pay attention when a token moves differently from the rest of the market.
Hyperliquid’s native token, HYPE, has attracted attention after a strong weekly recovery. However, there is an important detail to understand: short-term price strength does not mean the token is rising every day or that it is immune to market pressure.
Here is what beginners should
post-image
AI
Kimi K3.1 Pro: Text Arena Rank Debut?
Top 20
22%4.55x
Top 10
10%10.00x
$6.97K 24H+1 more
HYPE+0.24%
$XRP (Ripple) – Active Short Position, Securing Massive Profits
I'm currently holding an active 5x Short position on XRP, entered at $1.3231**, with the current price down at **$1.2499. This trade is performing exceptionally well with a massive unrealized ROI of +27.53%.
Looking at the 15-minute chart, the momentum remains heavily in your favor. The price suffered a sharp drop from the $1.2565 high down to $1.2466. While there is a slight bounce happening right now, the price is still trading below the cluster of major moving averages (MA30 at $1.2510, EMA30 at $1.2506), which are now acting a
XRP-1.12%
🏆Nov. 1 midday market outlook.🏆
$BTC 观点:
After a decline, BTC has seen a natural rebound. This rebound made a false breakout above the 78613 resistance and reached a high in the 78613-76477 consolidation range, but failed to hold above 78613 and then pulled back. It tested the 76447 support three times, showing that 76447 is currently holding.
Now the question is whether BTC can stay above the 77586 resistance. If it can, the structure of the 77586-76447 consolidation range will have broken down, allowing it to continue upward and test the 78105-78613 resistance zone.
BTC can only
BTC-0.65%
Load More

Join 40 M users in our growing community

⚡️ Join 40 M users in the crypto craze discussion

💬 Engage with your favorite top creators

👍 See what interests you

Trending Topics

BTC大跌

399.94k Views39.74k Discussing

$BTC briefly fell below $77,000 and remains under pressure around the $77K zone, with its 24-hour decline still above 4%. With risk appetite weakening and Fed uncertainty rising, where is the next key support after losing $80K?

IntelBeatsEarningsButStockPlunges

32.28k Views969 Discussing

StrategySTRCNears100ParValue

39.31k Views4.15k Discussing

View More