Square
Following
Hot
News
Notifications
Profile
Share your thoughts
placeholder
Article
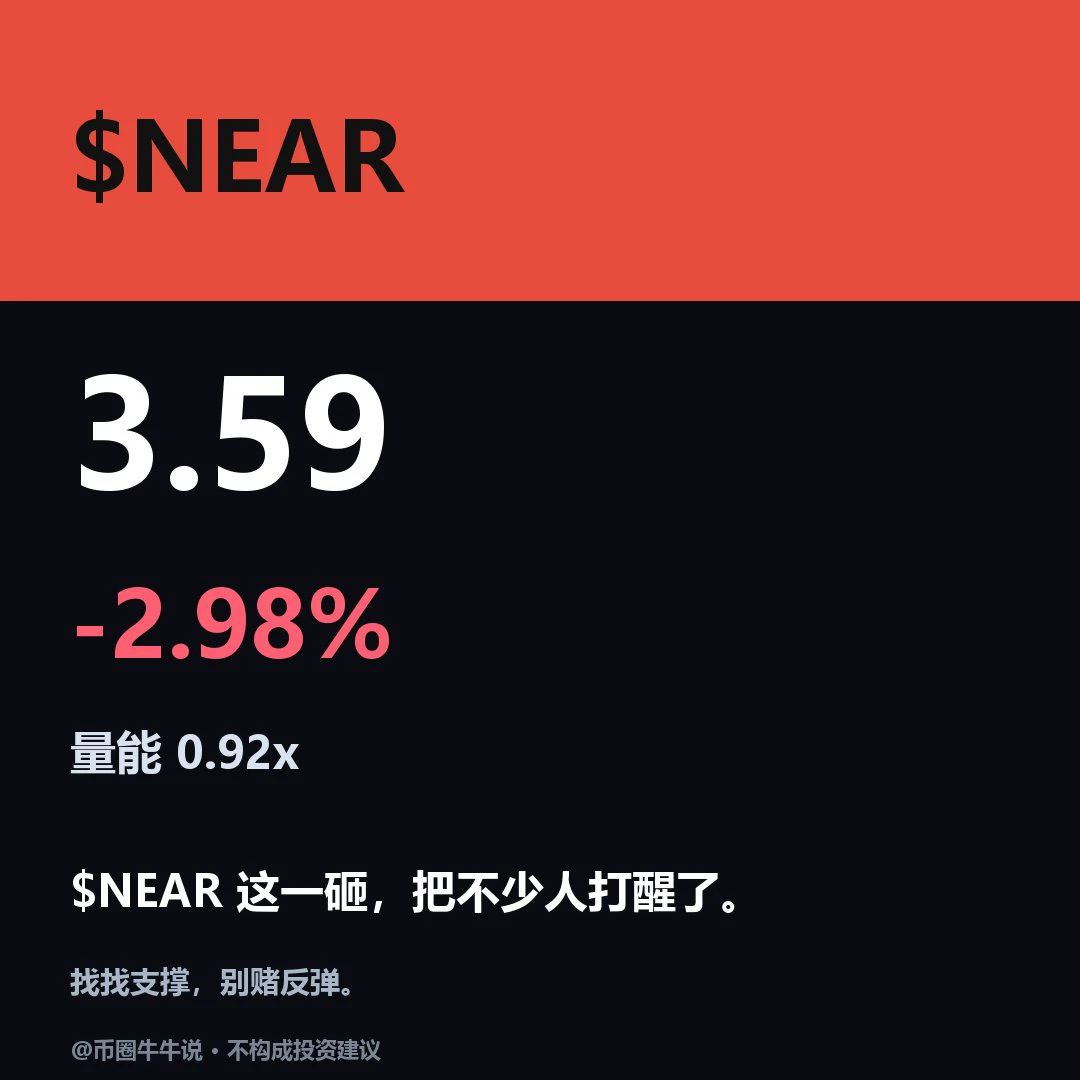
$NEAR Current price: 3.586, down 2.98% over 24H. 1H is weak: RSI 37.4/EMA20 3.635, support at 3.446/resistance at 3.746; 4H is weak: RSI 32.3/EMA20 3.716, support at 3.446/resistance at 4.063. For an upside move, price needs to establish itself above the 3.746 resistance; on the downside, watch for a break below the 3.446 support. Review whether price can hold above 3.746 and whether it can reclaim 3.446 after losing it; the setup is invalidated if price breaks below 3.446 and fails to reclaim it. The market is volatile; for observation only.
post-image
KORU long position has flipped to short; long position loss: -12.12
KORU short position [1-hour timeframe]

Entry price 6.641
Total value 240
Quantity 36.1
Closing price 5.65
Profit after closing: 35.77
KORU-1.22%
Trenches
ZIG
Z
bade
b
ZIG
0x8c...1145
Market Cap
$.
Change
.
24h Vol
$.
Holders
.
BTC
B
bade
b
BTC
C5xp...pump
Market Cap
$.
Change
.
24h Vol
$.
Holders
.
STONK
S
bade
b
STONK
6GmA...UNgx
Market Cap
$.
Change
.
24h Vol
$.
Holders
.
ANSEM
A
bade
b
ANSEM
9cRC...pump
Market Cap
$.
Change
.
24h Vol
$.
Holders
.
MAGGIE
M
bade
b
MAGGIE
8rHo...PmZV
Market Cap
$.
Change
.
24h Vol
$.
Holders
.
🔹Democrats Sweep Congress: Is a Major Shift Coming for Crypto? Tighter SEC Oversight and Prediction
live-cover
LIVE1,488
  • 1
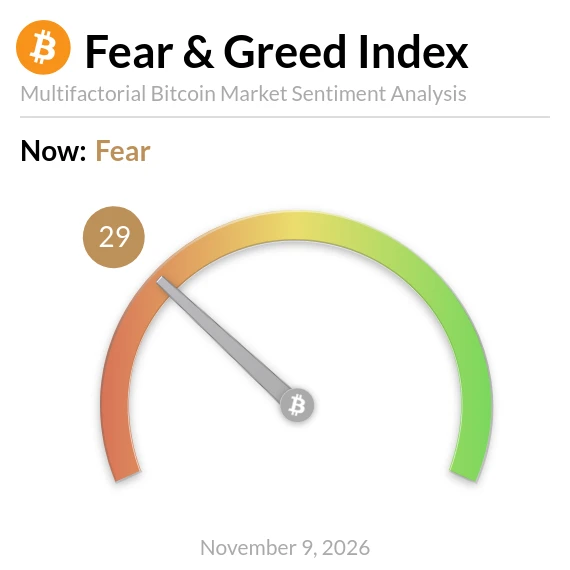
Bitcoin Fear and Greed Index is 29 — Fear
$BTC Current price: $75,140
post-image
BTC-0.67%
INDEX+0.00%
  • 1
#Ahr999EntersBottomBuyingZone #ShareWeekly

Bitcoin’s Ahr999 Indicator Falls to 0.43: Is the Market Entering a Historic Accumulation Zone?

Bitcoin is approaching an important valuation point, and one indicator is attracting increasing attention from long-term market participants. With BTC trading around the $74,000–$76,000 range, the Ahr999 indicator has dropped to approximately 0.43, moving below the historically watched 0.45 threshold.

This development raises an important question: are investors witnessing another long-term accumulation opportunity, or is the market preparing for another
BTC-0.67%
  • 3
The result made getting up early to watch BLG face legendary T1 in this BO5 worth it—and I even got to catch some tea about Dahuang along the way.

First of all, congrats to BLG for finally conquering this mountain! Looking forward to their showdown with GEN for the Bauhinia crown next week. They’re on a legendary run, taking the championship after going through four teams.

So, Jensen Huang has an affair and crypto takes a hit? Is the crypto market made of glass or what? So fragile?
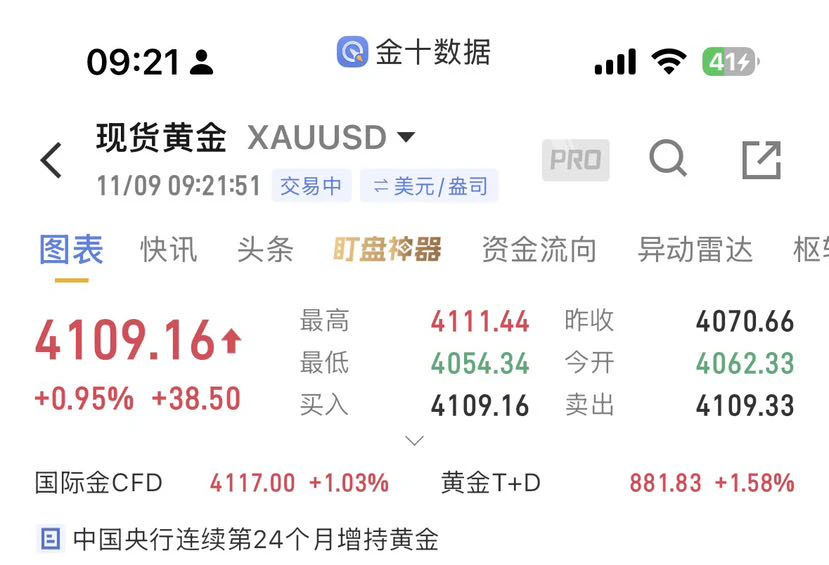
Multiple bullish catalysts converge, solidifying gold’s uptrend

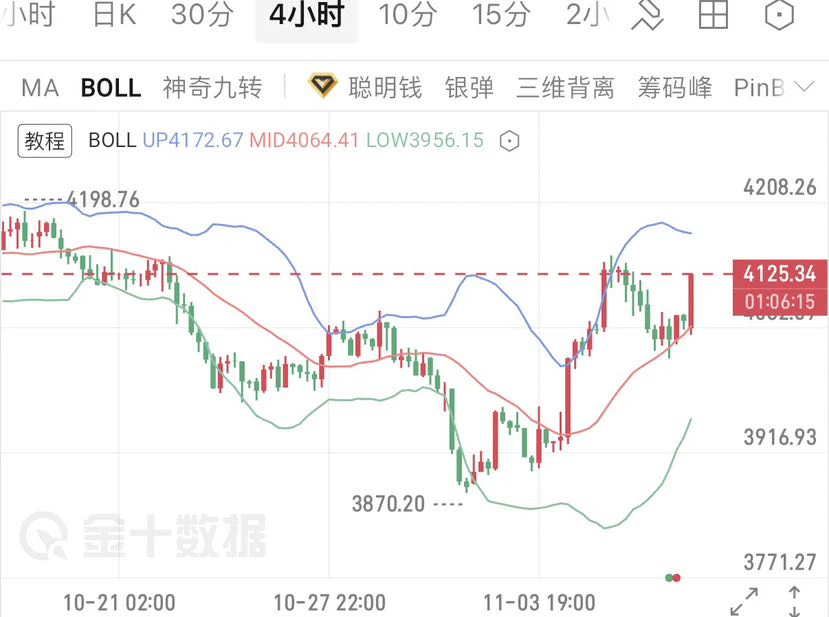
On the four-hour timeframe, the Bollinger Bands are opening upward, with prices continuing to rise along the middle band. RSI remains in the strong zone, and the solid bottom formation has opened an upward channel for this rebound.

On the news front, the outcome of the U.S. midterm elections has introduced uncertainty around policy expectations, stoking market risk aversion and driving sustained inflows into safe-haven assets. Meanwhile, expectations for the pace of the Federal Reserve’s future adjustments have shifted, further
post-image
XAU+0.38%
After ETH’s sharp drop, first assess the quality of today’s rebound.

Based on Gate ETHUSDT market data at 07:52 on November 9, the short-term bias is bearish. Watch resistance at 2143—2148 and 2160—2168 above; observe support at 2114—2115 and the 2080—2100 area below.

Until 2168 is reclaimed, treat the rebound as a corrective move; after it holds firmly above that level, look to 2177—2190 for recovery potential.

Volatility is high right now. Reduce chasing entries; with high leverage, wait for volatility to contract. Set a stop-loss before considering potential gains.
$ETH ‌
post-image
ETH-1.23%
Try buying $UNI . Entry range: 6.833 - 6.878 Target levels: 7.181, 7.441 Stop-loss: 6.628 UNI is setting up for a V-shaped rebound; bulls are reclaiming the moving averages, and it's time to catch this rebound. Caution: the 1-hour trend is still bearish; if 6.88 cannot hold, the long strategy is invalidated. Don't go all in, friends. Size your position according to your account.
post-image
UNI+3.05%
Gold spot trade

Short near the current price of 4110, add to the position at 4117, stop at 4122, with downside targets at 4000-4090-4070$XAU ‌
post-image
XAU+0.38%
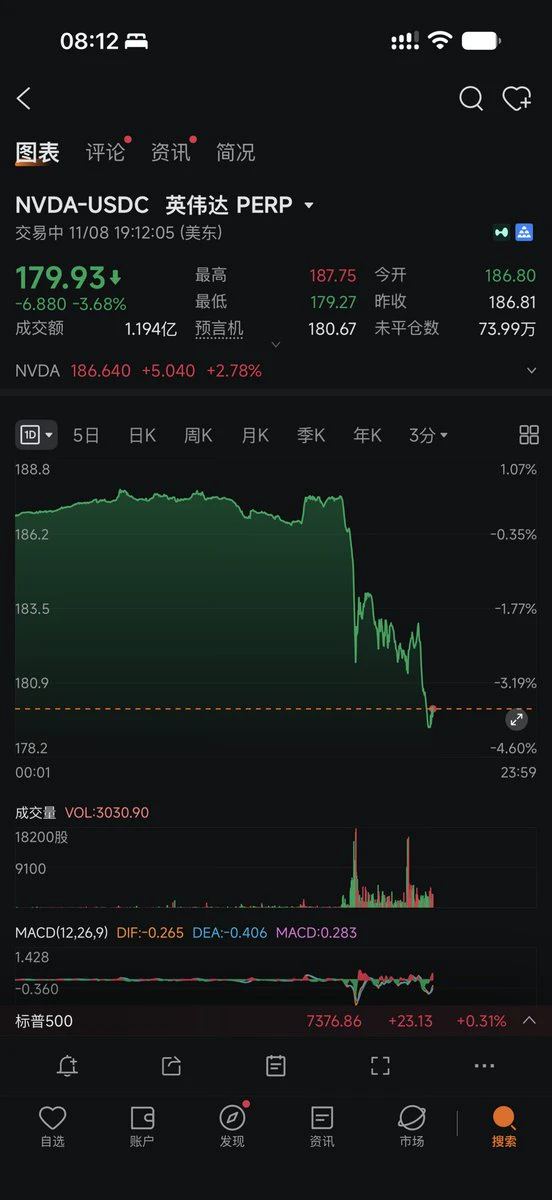
Repost: I didn’t expect Jensen to actually collapse. Roughly speaking, the worst-case scenario is that Jensen’s wife gets half the shares and sells them all for cash. She would hold $75.7 billion worth of NVDA, equivalent to about 3.5 days of trading volume, with an approximately 10% impact on the market.
But California divorces have a T+6-month timeline, and the money is held in a trust. So if they divorce next year, the company’s $235 billion in buybacks in 2028 would be enough to absorb the shares.
Tech stocks, already facing considerable uncertainty, will most likely price this in early. N
post-image
NVDA+2.80%
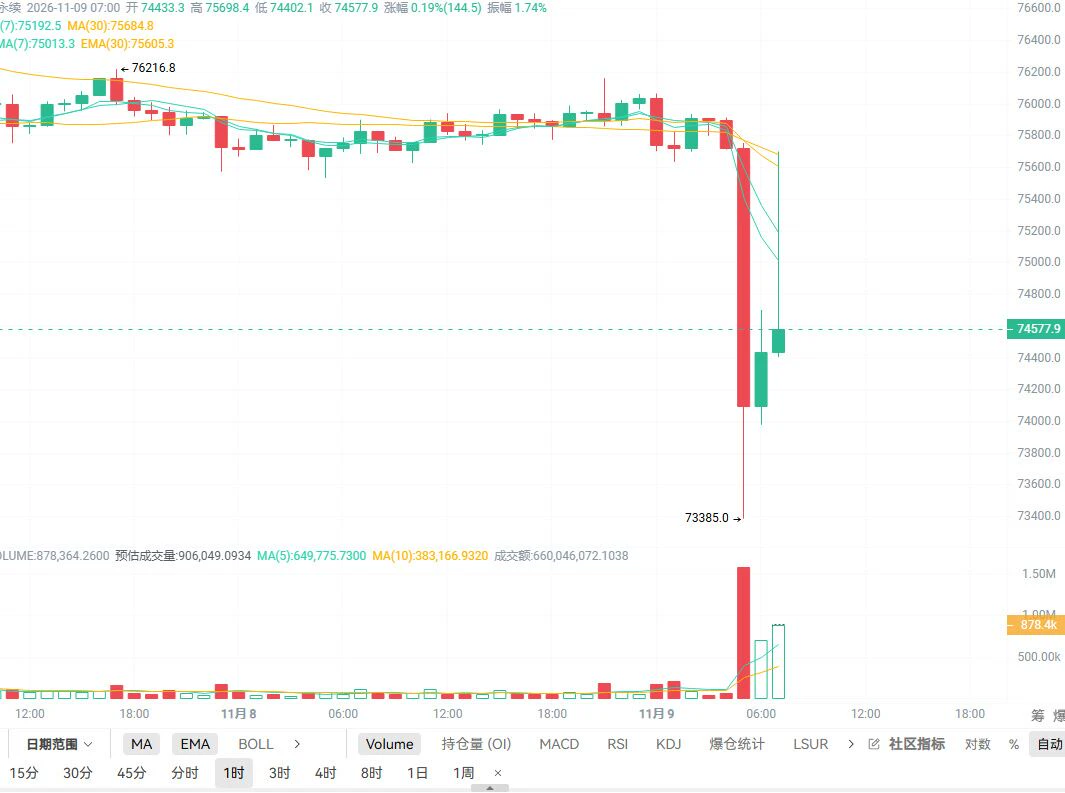
On November 9, BTC saw a weak recovery after a high-volume breakdown; short into the rebound
Entry timing: Price rebounds to the 75000–75600 zone
Stop-loss: 76300
Take-profit targets:
First target: 74000–73600
Second target: 73400–73000

【Key Takeaway】
On the 1-hour chart, price plunged on heavy volume this morning, forming a large bearish candle with a body exceeding 2,000 points. It broke decisively below all short- and medium-term moving averages—MA7, MA30, and EMA30—and completely invalidated the previous consolidation range of 75500–76200, with a low of 73385. The drop was accompanied by
post-image
BTC-0.67%
Jensen Huang hit by sudden controversy! Nvidia falls 2.2% after hours—is the AI chip leader in trouble this time?

Nvidia has recently been at the center of global tech news, but this time not because it launched a new chip. Instead, CEO Jensen Huang has become embroiled in controversy related to personal relationships and potential foreign intelligence activities, and the company's board has announced an independent investigation. After the news broke, Nvidia shares fell as much as about 2.2% after hours. Investors may be too preoccupied with this to even look at graphics cards.
Why is the ma
SPCX+8.74%
Needless to say, a bunch of people’s accounts have taken another major hit.
Dog Bro posted on Friday and said it again yesterday: set your stop-loss for Ether at 2200. That’s experience Dog Bro learned the hard way, time and time again.

In this market, surviving and earning consistent profits matter more, even if you only make $100 in a week. Believe me, even making just $100 a week already puts you ahead of 95% of people.

Don’t envy others when they’re making money, and don’t think they’re clueless when they’re losing.

Dog Bro just has a little more experience than you, spots opportunities
ETH-1.26%
  • 4
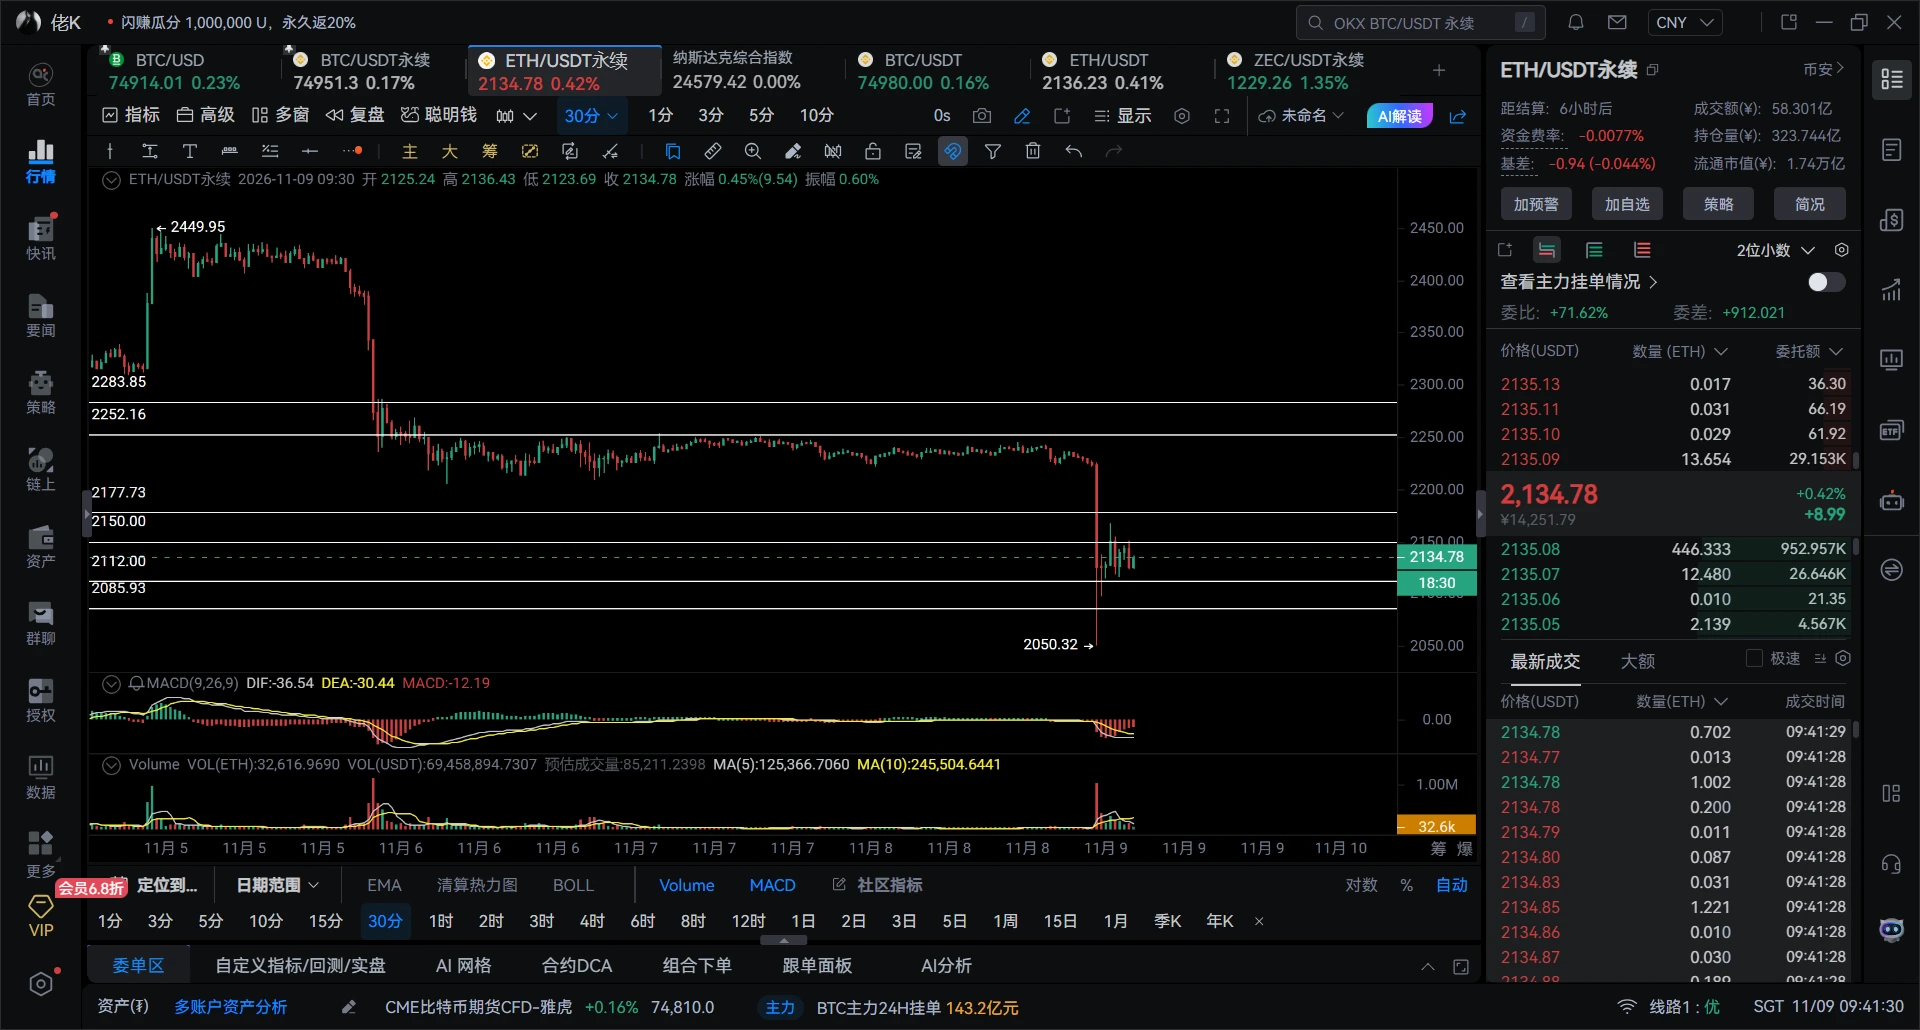
11.9 ETH Market Analysis
Ethereum has fallen sharply and has not recovered as quickly as Bitcoin
The monthly chart also shows hidden divergence; the weekly MACD has printed a death cross for 2 consecutive weeks
On the 3-day and 5-day timeframes, prices have continued to fall on low volume; the 2-day chart has broken lower
12/8-hour timeframe rebound + divergence (no pattern on the 2–6-hour timeframes; in the short term, wait for the 15/30-minute charts to bottom and form a pattern)
Intraday resistance: 2150 2177 2205
Intraday support: 2112 2085 2056
$ETH
post-image
ETH-1.23%
😅😅😅Old Huang cheating is nothing, but don't get fired for selling company secrets—that'd be unthinkable. I can't imagine how far the stock would fall.😅
The Democrats are really ruthless, with a real air of wanting to wipe him out… Let bygones be bygones. Huang has been pretty good to the Democrats too.😅
Buy the dip, hold long-term. Discord is in my profile.
post-image
Load More

Join 40 M users in our growing community

⚡️ Join 40 M users in the crypto craze discussion

💬 Engage with your favorite top creators

👍 See what interests you

Trending Topics

USCPIDataIncoming

20.29k Views1.71k Discussing

The U.S. October CPI report will be released on November 10 at 8:30 a.m. ET. September CPI came in at 3.7% year over year, and markets will be watching closely for signs that inflation is cooling, especially in core CPI. A softer-than-expected reading could strengthen rate-cut expectations, while hotter inflation may pressure risk assets through higher Treasury yields and a stronger dollar. How do you think this CPI print will move $BTC, U.S. stocks and gold?

USAIStocksHitHard

30.88k Views3.75k Discussing

StakeOnLaunchpoolToShare450KVLX

26.24k Views955 Discussing

View More