Square
Following
Hot
News
Profile
Share your thoughts
placeholder
Article
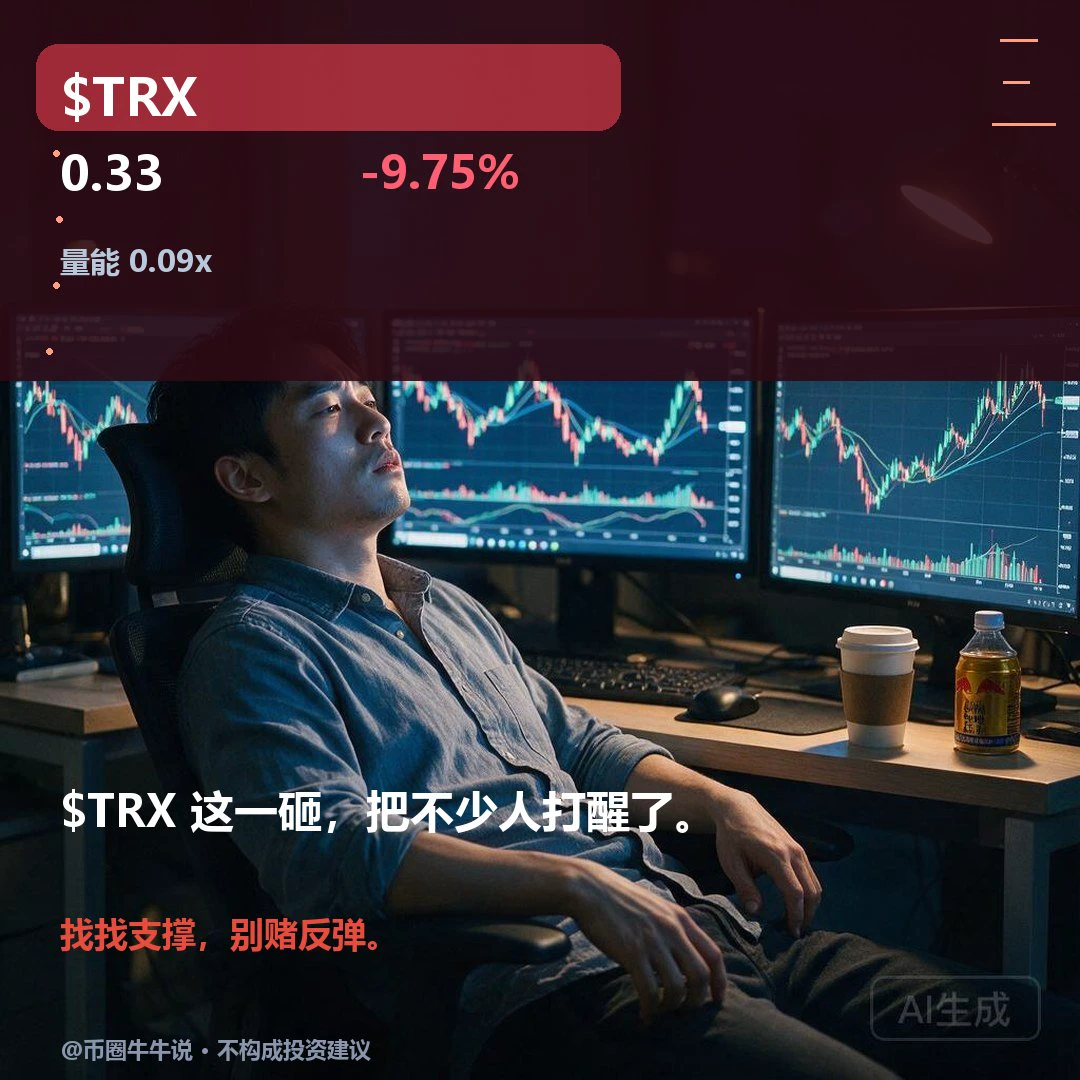
$TRX Currently at 0.325, down 9.75% over 24H. 1H is severely oversold, while 4H is neutral to weak. If price holds above the 0.3636 resistance, a rebound may be possible; if it breaks below the 0.3248 support, the decline could accelerate. Volume is insufficient, so participation needs to be confirmed. Watch whether price can hold above resistance. Market volatility is high; for observation only.
post-image
TRX+0.42%
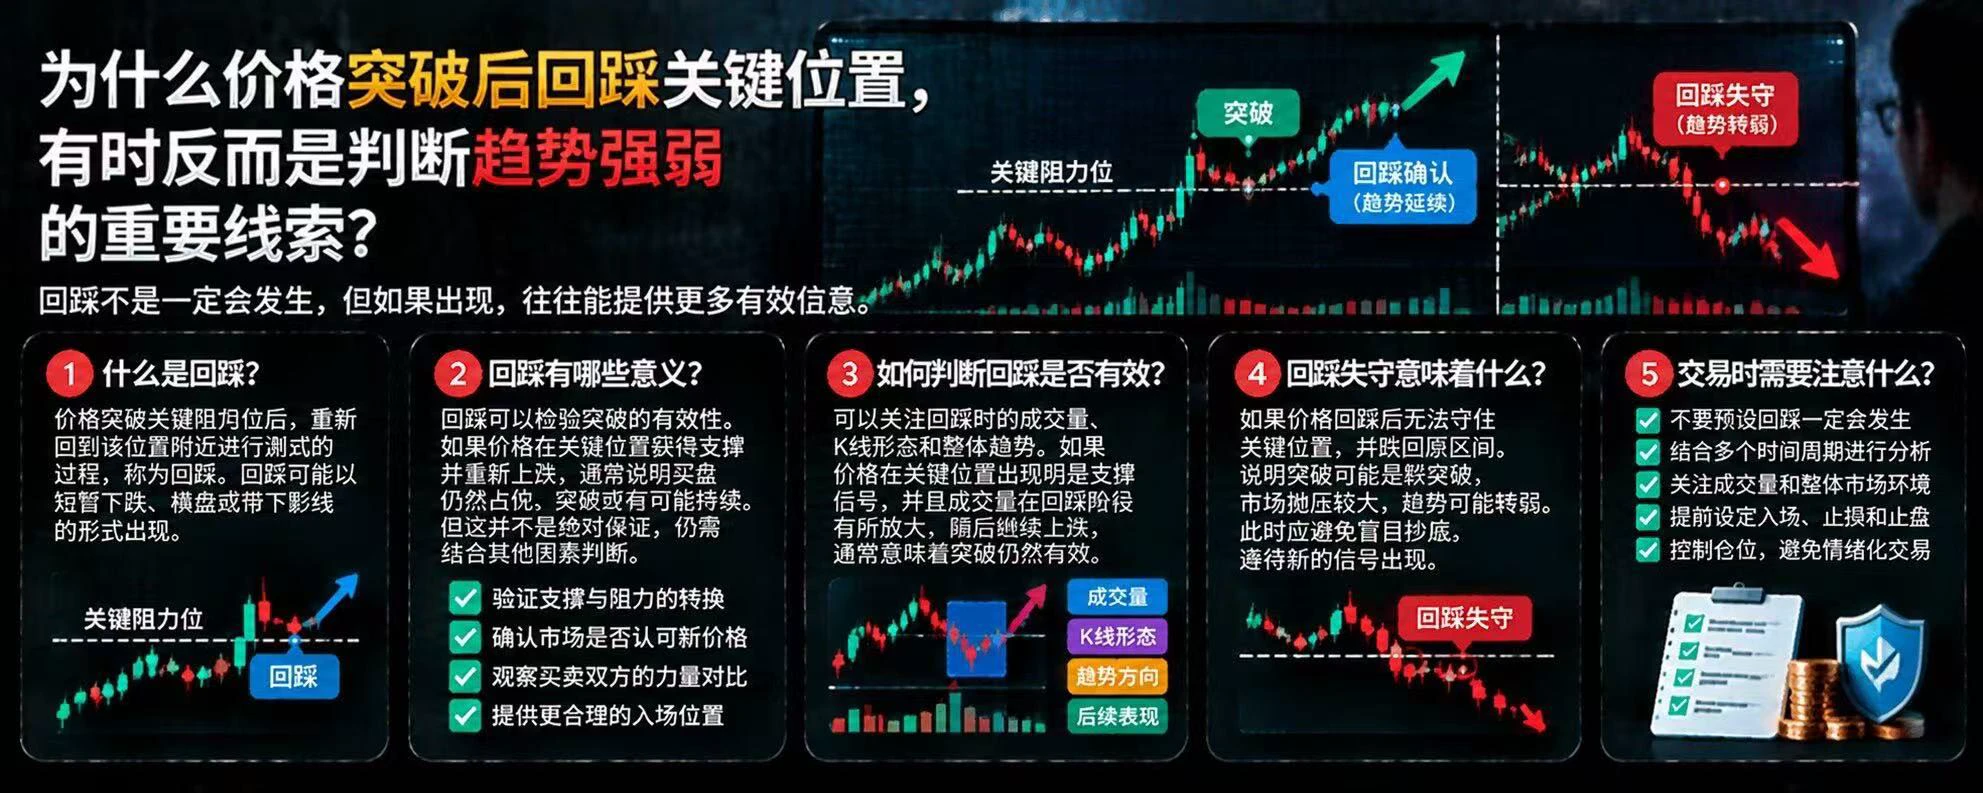
Why Can the Price Continue to Fall When MACD Shows Bullish Divergence?
In the crypto market, MACD bullish divergence is often viewed as a potential reversal signal, but many traders find that the price may continue to fall even after bullish divergence appears. That’s because weakening momentum does not mean the downtrend has ended.
First, what is MACD bullish divergence?
Bullish divergence may form when the price keeps making new lows while the lows on the MACD indicator gradually rise. This means downward momentum may be weakening, but it doesn’t prove that buyers have taken control.
Second,
post-image
Trenches
ZIG
Z
bade
b
ZIG
0x8c...1145
Market Cap
$.
Change
.
24h Vol
$.
Holders
.
IDOL
I
bade
b
IDOL
0x3b...ab07
Market Cap
$.
Change
.
24h Vol
$.
Holders
.
SAFU
S
bade
b
SAFU
0x7c...7777
Market Cap
$.
Change
.
24h Vol
$.
Holders
.
Q
Q
bade
b
Q
0xc0...0589
Market Cap
$.
Change
.
24h Vol
$.
Holders
.
STONK
S
bade
b
STONK
6GmA...UNgx
Market Cap
$.
Change
.
24h Vol
$.
Holders
.
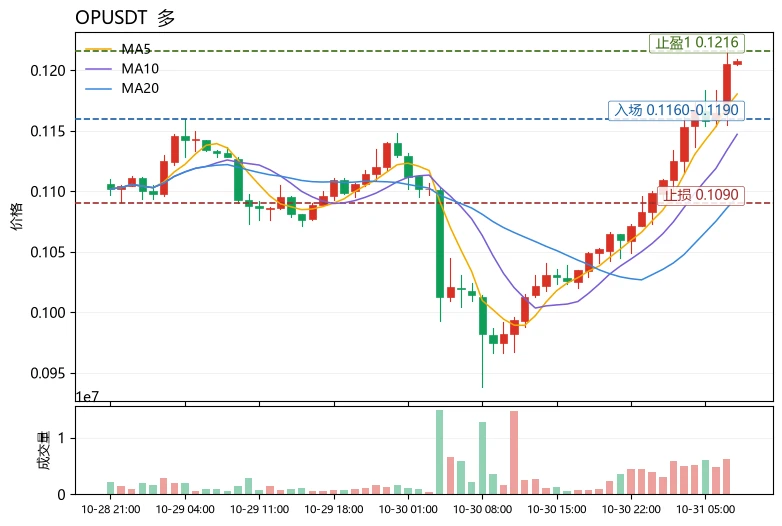
$OP Current price: 0.1208. The first resistance above is the Bollinger upper band at 0.1216; pullback support is at MA5 0.1180, with strong support at MA20 0.1096. These levels mark the current divide between bulls and bears. The conclusion first, then the rationale.
Trend health can be assessed using three checks: “moving average alignment + momentum + sentiment.” First, check whether MA5 is above MA20 and both are rising in tandem: OP’s MA5=0.1180>MA20=0.1096, so the medium-term structure remains bullish. Second, check whether momentum is keeping pace: the MACD histogram at +0.001537 remains
post-image
OP-1.31%
BEAMX+5.82%
$BTC Don’t call it a bull run until it breaks 95,000. A Wall Street analyst said on TV that $MSTR could hit 570 by year-end, provided Bitcoin first gets above 95,000. Sounds like they’re dangling a carrot, but they’ve actually laid out the condition. A rally on low volume is suspect—sooner or later, volume needs to catch up. Be especially cautious with calls like this. What do you think?
#Bitcoin
post-image
BTC-0.67%
MSTR-7.78%
  • 11
  • 1
Don't Want the Market to Catch You Off Guard This Weekend! BTC or ETH: Which Is Worth Holding?
What's Friday's biggest dilemma? Not what to eat tonight, but whether to hold Bitcoin over the weekend! After all, exchanges don't close, and the market might give you a free lesson in risk management while you're asleep.
My choice is to prioritize BTC, then keep an eye on ETH. BTC has relatively better liquidity and greater influence on market pricing, but that doesn't mean it can't suddenly plunge. For weekend positions, I prefer to keep part of my core holdings while appropriately reducing short-t
Crypto
What price will XRP hit in October?
↓ 1.20
16%6.25x
↑ 1.40
8.5%11.76x
$21.4K 24H+20 more
AMZN-1.55%
  • 28
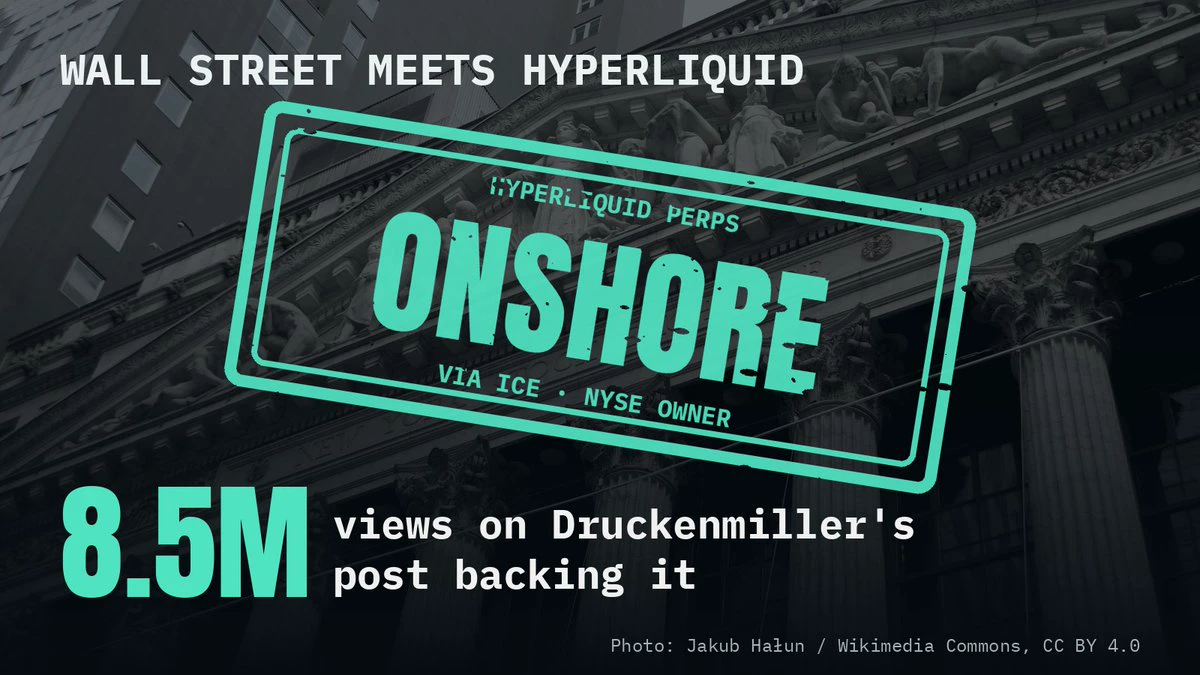
Stan Druckenmiller has 7 posts on X. One of them pulled 8.5M views just saying he backs trade(xyz) bringing Hyperliquid perps to the US.
The company that owns the NYSE is building the venue.
Offshore degens spent years on VPNs to trade this.
Now it comes with a KYC form.
post-image
HYPE+0.33%
$BIRB These numbers look off. The 24-hour low was 0.0660, and it's now at 0.0932, a 41% swing, with $133.8 million in trading volume—that turnover doesn't look like a normal rally; it looks like someone repeatedly sweeping up coins within a specific range.
Three possibilities: first, the project team is market-making around news, dumping into the order book to shake out weak hands before a sharp pump; second, an on-chain whale placed buy orders around 0.066, accumulated tokens, then pushed the price up bulldozer-style—retail traders chasing the rally would be catching a falling knife; third, s
BIRB-16.68%
  • 11
  • 1
Live trading publicly visible throughout! Today's account is nearing 4,000; deposited 2792 on 10.25
Continuing to push for 100,000; 20% return in a single day yesterday!#实盘
I had AI help me create a new Gmail account, and the only thing I did the whole time was scan a QR code with my phone.
The division of labor was:
· Claude acted as the coordinator: breaking down the steps and tracking progress
· Grok Bot used its own computer and browser: opening the signup page, filling out the form, and saving the password in an encrypted vault
Google required verification by scanning with a real device, so I handled that step; the AI didn’t bypass it.
At first, I had Claude run a script locally, but it couldn’t get anywhere. Switching to having Grok Bot use its own browser
post-image
morning update
live-cover
LIVE1,878
Young man, don’t look down on humble beginnings; shallow waters can’t hold back a dragon.
I had just closed my weary eyes when my phone rang.
They were debt collection calls and messages, the people I care about pushing me forward, and the part of me that refuses to give up.
So I must not let up. But a good night’s sleep and a clear mind are what give me the strength to press on. #Gate廣場萬聖節
#每周来晒
$BTC ‌$ETH ‌$ZEC ‌
BTC-0.65%
ETH-1.23%
ZEC+1.29%
  • 10
My daily struggle with myself! But pain doesn’t define me. Help...
#fibromialgia #luta #empathy
post-image
[New Streamer] Marker prediction
live-cover
LIVE749
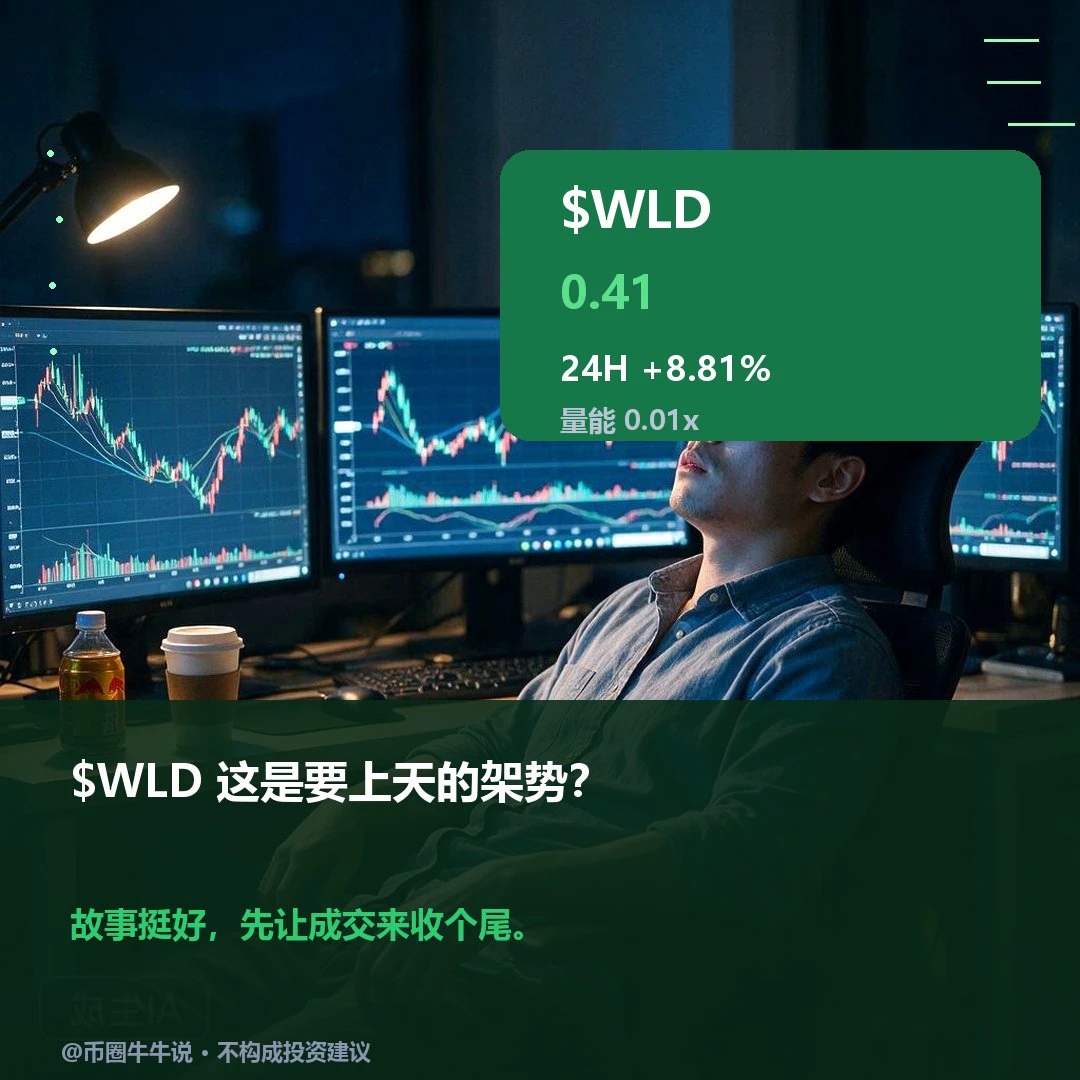
$WLD Currently at 0.4064, up 8.81% over 24H. The 1H trend is strong, while the 4H trend is weak, showing clear divergence between the two timeframes. If it holds above the 0.4217 resistance, the bullish trend could continue; if it breaks below the 0.3705 support, it could weaken. Watch whether it can hold above resistance and reclaim support after a breakdown. Market volatility is high; for observation only.
post-image
WLD-5.61%
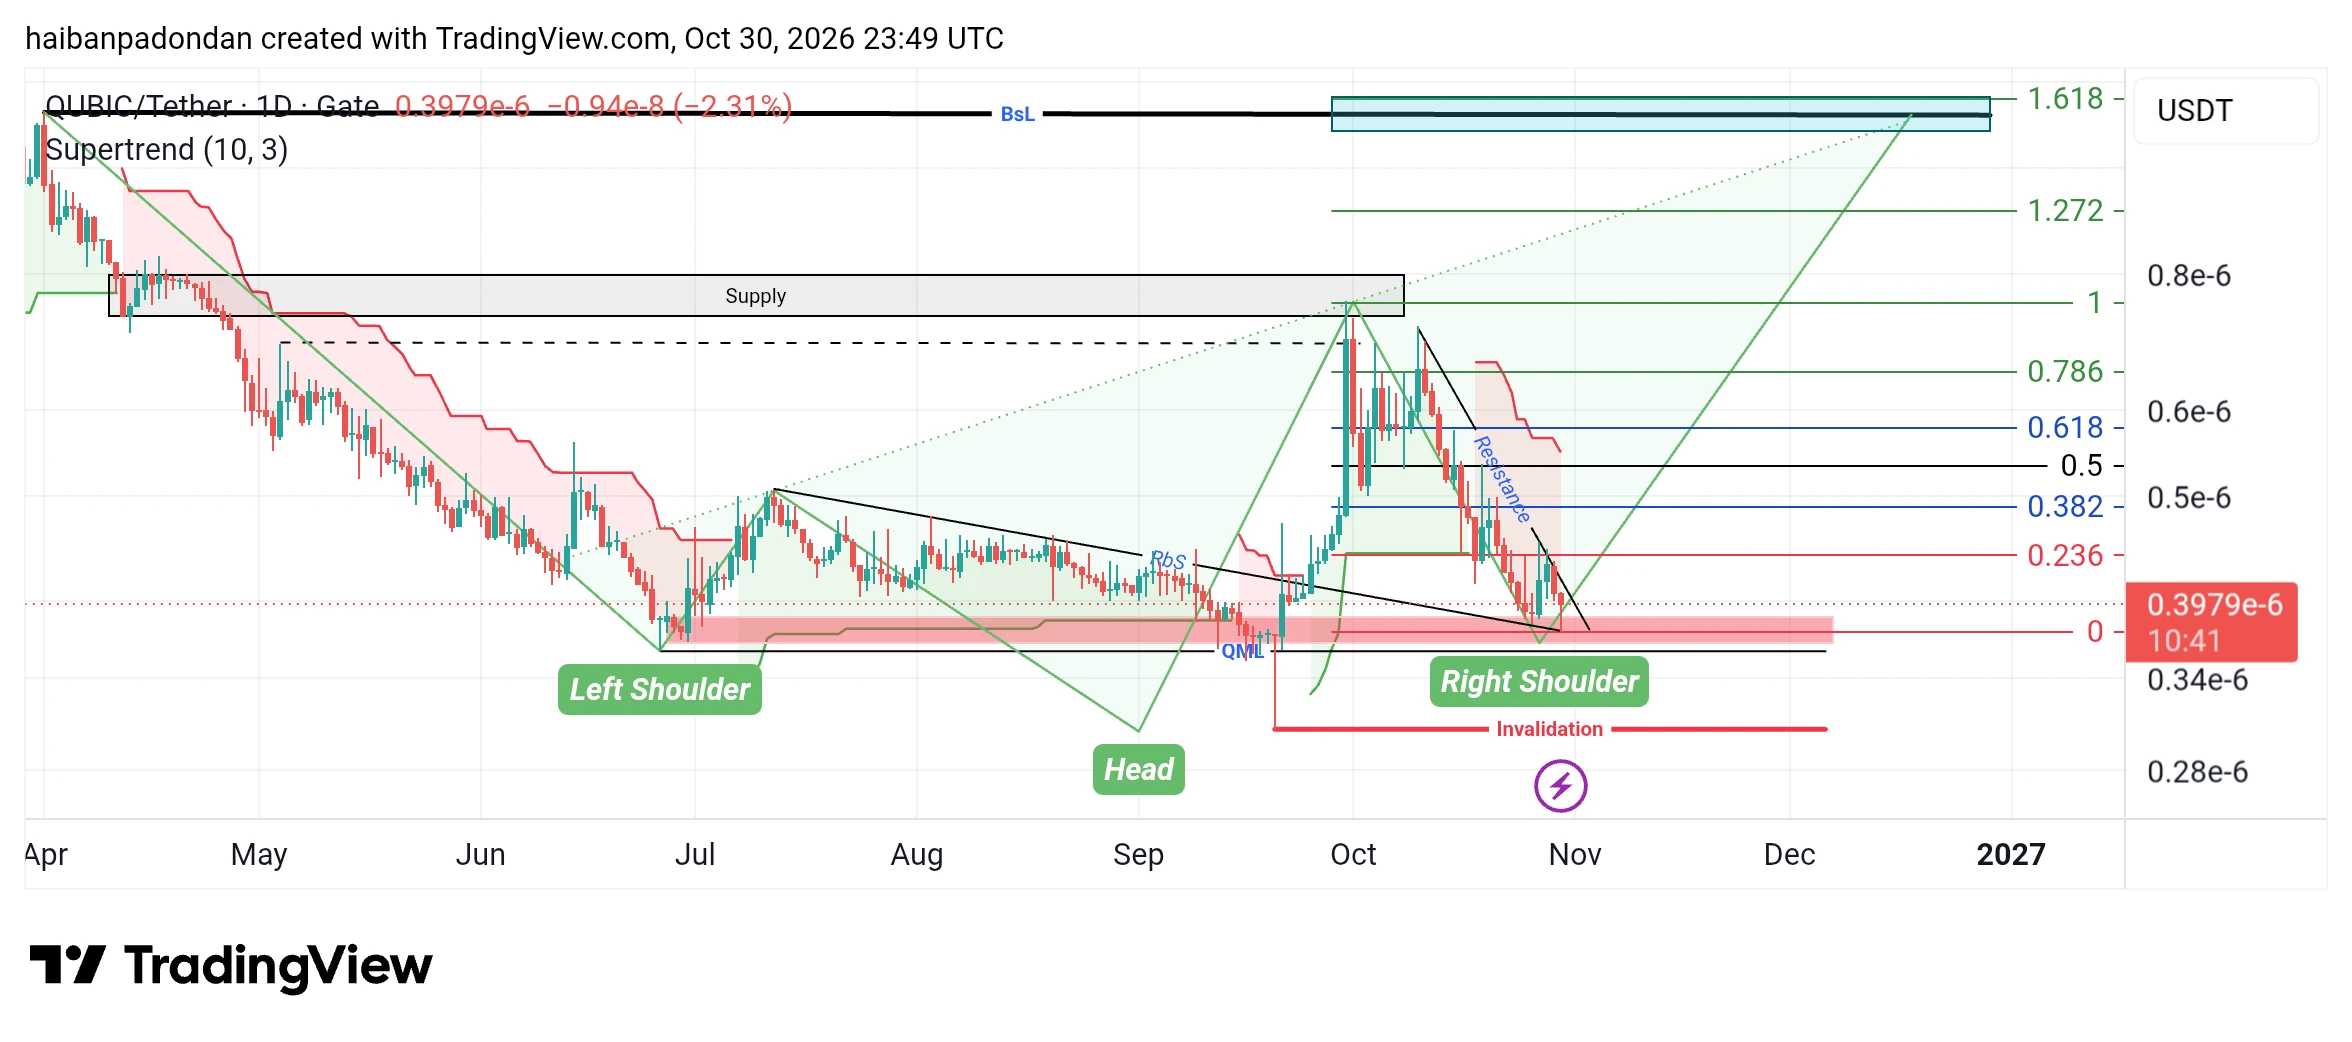
If $QUBIC begins a bullish run from now until the end of the year, the pattern that forms will definitively be a Head and Shoulders (HnS) pattern, which signifies a trend reversal.
post-image
QUBIC-3.39%
Why can prices sometimes rebound quickly even after falling below a long-term moving average?
In the crypto market, long-term moving averages are often used to assess medium- and long-term trends. When the price falls below an important moving average, many traders assume a downtrend is confirmed. In reality, however, the price may sometimes rebound quickly and climb back above the moving average. Understanding this phenomenon can help you avoid making trading decisions based on a single signal.
First, long-term moving averages reflect historical prices. For example, MA120 reflects the average
post-image
What I couldn't understand before has suddenly become tangible😂
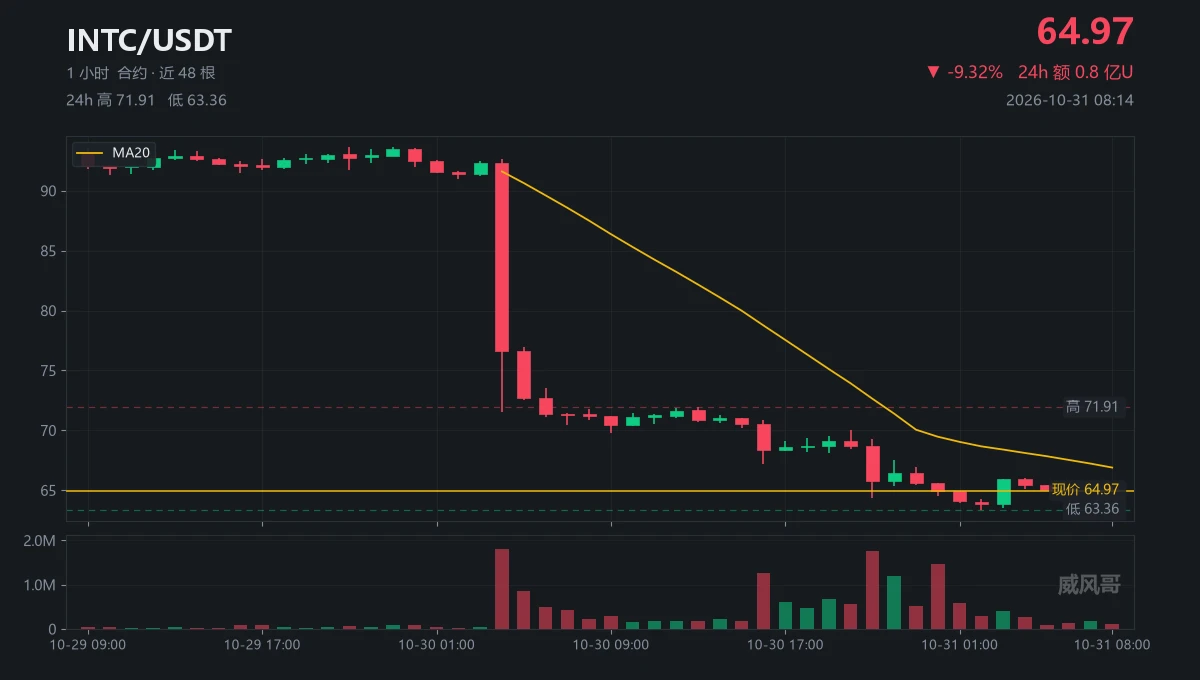
This morning, I sat down and counted all 48 hourly candles on $INTC , one by one.
When I finished, I had just one thought: this isn’t a drop—it’s a four-step staircase.
1. The candle at 92.65 crashed straight down to 71.49, with a volume of 1.79 million contracts.
2. Price moved sideways around 71 for fourteen hours, then broke below 70.90 to 67.19, with a volume of 1.26 million.
3. It broke below 69.31 again and slid all the way to 64.39, with a volume of 1.76 million.
4. One final move at 66.94 broke below 64.48 to 63.36, with a volume of 1.47 million.
Four candles, each with a lower low tha
post-image
INTC+0.05%
Load More

Join 40 M users in our growing community

⚡️ Join 40 M users in the crypto craze discussion

💬 Engage with your favorite top creators

👍 See what interests you

Trending Topics

BTC大跌

195.25k Views39.52k Discussing

$BTC briefly fell below $77,000 and remains under pressure around the $77K zone, with its 24-hour decline still above 4%. With risk appetite weakening and Fed uncertainty rising, where is the next key support after losing $80K?

IntelBeatsEarningsButStockPlunges

13.91k Views737 Discussing

StrategySTRCNears100ParValue

17.57k Views4.03k Discussing

View More