Share your thoughts
placeholder
Article
Gate New Listing: $STONKBROKER
🔹 Trading pair: $STONKBROKER / $USDT
🔹 Trading time: September 7, 19:00 (UTC+8)
🔹 0-fee swap start time: September 7, 20:00 (UTC+8)
Go to trading: https://gate.com/zh/trade/STONKBROKER_USDT
Go to swap: https://www.gate.com/zh/convert/USDT/STONKBROKER
Learn more: https://www.gate.com/zh/announcements/article/101592
post-image
🚨 ZEC BREAKS $1,200 — NEW ALL-TIME HIGH! 🚀
Zcash ($ZEC ) is making headlines after breaking above the $1,200 level and entering fresh price-discovery territory. 📈🔥
💥 What’s happening?
• 🚀 ZEC breaks above $1,200
• 🏆 New all-time high
• 💰 Market cap climbs above $20B
• 🔝 ZEC enters the crypto top 10
• ⚡ Strong momentum fueled by ETF interest and short liquidations
The rally has been incredible, but after such a sharp move, volatility can be extremely high. Traders are now watching whether ZEC can hold above $1,200 and continue the breakout.
Is ZEC heading toward $1,500 next? 👀🔥
#ZEC #
post-image
ZEC-4.83%
after and uptrend the market is showing the first sign of buyers weakness with the formation of a bearish
$BTC $GT $ETH $SOL $XAUT
#GateIdleEarnAutoYieldUpTo3% #GateLaunchesTrenchesWith0GasFee #gateio
BTC-0.74%
GT+2.41%
ETH+0.04%
SOL-1.42%
XAUT-0.21%
  • 5
+2,882%
$ZEC 's year-over-year growth (since September 2025)✔️
+530% since early 2026 and +4,000% since early 2025
Today, $ZEC surpassed $BTC in trading volume on Coinbase for the first time
post-image
ZEC-4.83%
BTC-0.77%
BlackRock ETF Activity and Ethereum Inflows Give Crypto Markets Two Fresh Demand Signals
live-cover
LIVE1,253
Gate launches first: $CNPY
🔹 Trading pair: $CNPY / $USDT
🔹 Trading time: September 7, 20:00 (UTC+8)
🔹 0-fee instant swap start time: September 7, 21:00 (UTC+8)
Trade now: https://gate.com/zh/trade/CNPY_USDT
Go to instant swap: https://www.gate.com/zh/convert/USDT/CNPY
Learn more: https://www.gate.com/zh/announcements/article/101583
post-image
CNPY+72.04%
This trend doesn’t even require me to think—the account is dancing on its own. During the repeated intraday swings, $BOB ’s every rebound looked starved, with volume shrinking further and further, only to retreat whenever it touched the upper boundary. I knew then that this wasn’t a shakeout; someone was slowly exiting at the highs.
Around the resistance zone at 0.008332, I entered the short as planned, and specifically reminded everyone to stop chasing longs for the time being. Today, the market dropped straight to 0.004672, delivering a +435.19% return. That was a satisfying bite.
The curren
post-image
BOB-1.76%
SOL-1.43%
XRP-1.00%
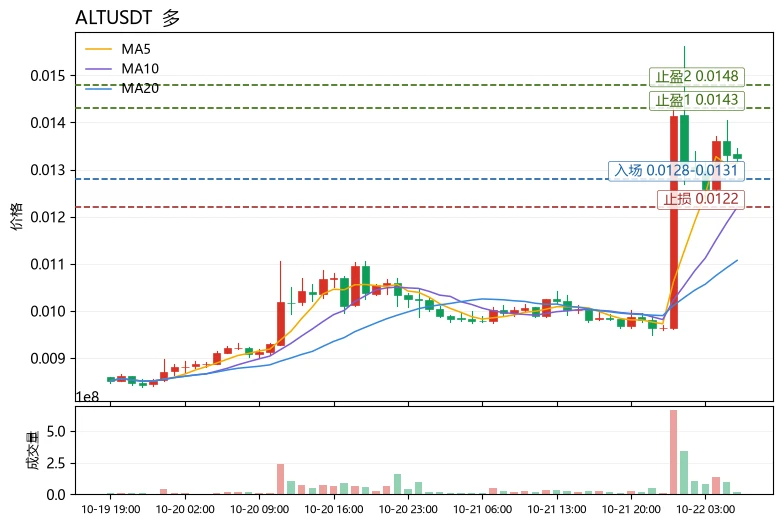
Nobody is talking about this hidden bearish setup in $ESPORTS /USDT right now.

$ESPORTS /USDT - SHORT

Trade Plan:
Entry: 0.01447 – 0.01455
SL: 0.01486
TP1: 0.01425
TP2: 0.01408
TP3: 0.01381

Why this setup?
Why now? The daily trend is bearish and the 4h bias confirms a short setup with 95% confidence, so the market is already tilted against buyers. The 1h price sits at 0.01451, which is the entry_ref and also the upper edge of the entry zone between 0.01447 and 0.01455, giving a precise trigger. The 15m RSI at 35.62 shows the asset is approaching oversold territory, meaning the next leg d
ESPORTS-0.21%
This $BNB trade took profits near the target, without getting greedy for the final acceleration. Volume has clearly contracted, lowering the probability of a continued surge; the biggest risk is watching unrealized gains go on another roller coaster ride.

Reviewing the entry logic: The price pulled back to the platform near 701.00, and the four-hour candle closed with a long lower wick, making the shift between bulls and bears fairly clear. I entered with 30% of the position as a test and held all the way after it stabilized above the level.

During the rise, I originally planned to sell 70
post-image
BNB-1.29%
XRP-1.00%
DOGE+0.75%
Insiders are quietly pressing short on SYMBOL while the range holds.

$BNB /USDT - SHORT

Trade Plan:
Entry: 739.58 – 741.72
SL: 750.90
TP1: 732.96
TP2: 727.84
TP3: 720.16

Why this setup?
Why now? The daily trend is range-bound, which favors short entries near the top of the range. The 1h price sits at 740.60, right inside the entry zone between 739.58 and 741.72, giving a precise trigger. The 15m RSI is 44.98, showing bearish momentum without being oversold yet. The 1h ATR is 4.269601, so a move to TP1 at 732.96 is roughly one ATR of downside, and TP2 at 727.84 extends that expectation fu
post-image
BNB-1.29%
#vkfyo should make a thunderous comeback in September.
post-image
I didn’t chase the first bullish candle after the breakout; my first reaction was to worry it was a false breakout. It wasn’t until the pullback held and the second volume surge started the next move that I confirmed the direction and added to my long position.
After the price surged near the target and momentum began to stall, I followed the plan and first reduced the position by 70%, keeping the remaining 30%. Later, the pullback hit my protection level, so I simply closed the rest of the position as well.
This long position made one thing clearer to me: entering a little later is nothing to
post-image
LAB-3.23%
ETH+0.02%
I originally wanted to cut losses and sacrifice the flesh to the heavens, but the sacrifice didn’t happen—the flesh roasted itself. 😏 A few days ago, when the screen was glowing green, $NIL staged a low-volume rebound. Selling pressure kept weighing on it, and the rebound couldn’t even touch the first key level. Faced with such a weak structure, not shorting would have been hard to justify.
Short entry at 0.06426; just now it hit 0.05308, with position gains of +837.85%. Time for a good meal, brothers. This time it wasn’t because I’m skilled—the market was in a good mood and casually tossed
post-image
NIL+0.83%
DOGE+0.75%
SNDK+0.48%
Why XLM is about to break range and surprise every long holder

$XLM /USDT - SHORT

Trade Plan:
Entry: 0.18871 – 0.19019
SL: 0.19653
TP1: 0.18414
TP2: 0.18061
TP3: 0.17530

Why this setup?
Why now? The 1h price is holding near 0.18945 inside a tight range, and the 15m RSI at 45.02 shows sellers are regaining control after a brief bounce. The 1h ATR of 0.002948 confirms volatility is compressing, which often precedes a sharp move, and the daily trend being range-bound means a directional breakout is overdue. The entry zone between 0.18871 and 0.19019 gives a precise trigger, with TP1 at 0.18
XLM+4.03%
This entry point was not perfect; I tried a long at the second-bottoming area on the $WLD hourly chart. The moving averages had not fully turned upward yet, so I could only use a tight stop-loss in exchange for room for later profits.

After entry, price action was very choppy. Several rallies were pushed back, making it look like the trend was weakening. But each pullback consistently held above the key reference level from the time of entry, so I chose to reduce my trading frequency and let the position run.

Only after the key level above was broken did the price action start to flow smoo
post-image
WLD+11.79%
SOL-1.43%
SNDK+0.48%
Why is everyone suddenly shorting SYMBOL right now?

$LAB /USDT - SHORT

Trade Plan:
Entry: 0.06944 – 0.06980
SL: 0.07133
TP1: 0.06834
TP2: 0.06748
TP3: 0.06620

Why this setup?
Why now? The daily trend is bearish and the 4h setup has 95% confidence, so the market structure is clearly rolling over. The 1h ATR of 0.000713 tells us volatility is tight enough to squeeze entries without getting chopped. The 15m RSI at 35.63 confirms short-term oversold momentum, which means sellers are still in control and dip buyers are exhausted. The entry zone between 0.06944 and 0.06980 sits right at the 1h
LAB-3.23%
No trades, no analysis, just sheer luck—this performance is embarrassing even to talk about. When I opened the chart early today, I stared at the line from $LIT 's 3.753 to 4.6 for several seconds: +1085.07%. I was about to curse the price action, but then I looked at my account and thought, forget it—the market is always right, Dad😂.

Actually, while everyone else was running, I noticed something: each pullback was shallower than the last, someone was always buying below, and the sell orders were hitting with less and less force. The bottom was clearly being supported. So I called for a long
post-image
LIT+3.06%
LAB-3.23%
DOGE+0.75%
BTC gives me the feeling that it doesn’t want to fall, but it also doesn’t dare to rise.
USDT’s market cap has been fluctuating within a range since August 27.
There have been no capital inflows, but for now there have also been no obvious outflows. (There has been a slight outflow, and USDT has shown a slight tendency toward a negative premium, but it is not significant.)
Friday’s CPI data may come in line with or even below expectations, but there may still be no clear downward trend, and it may not necessarily provide a definitive answer on whether rates will be raised.
Brother Feng does no
BTC-0.74%
MSTR-1.49%
Load More

Join 40 M users in our growing community

⚡️ Join 40 M users in the crypto craze discussion

💬 Engage with your favorite top creators

👍 See what interests you

View More