










#GateBTCAndETHFuturesVolumeRanksTop3
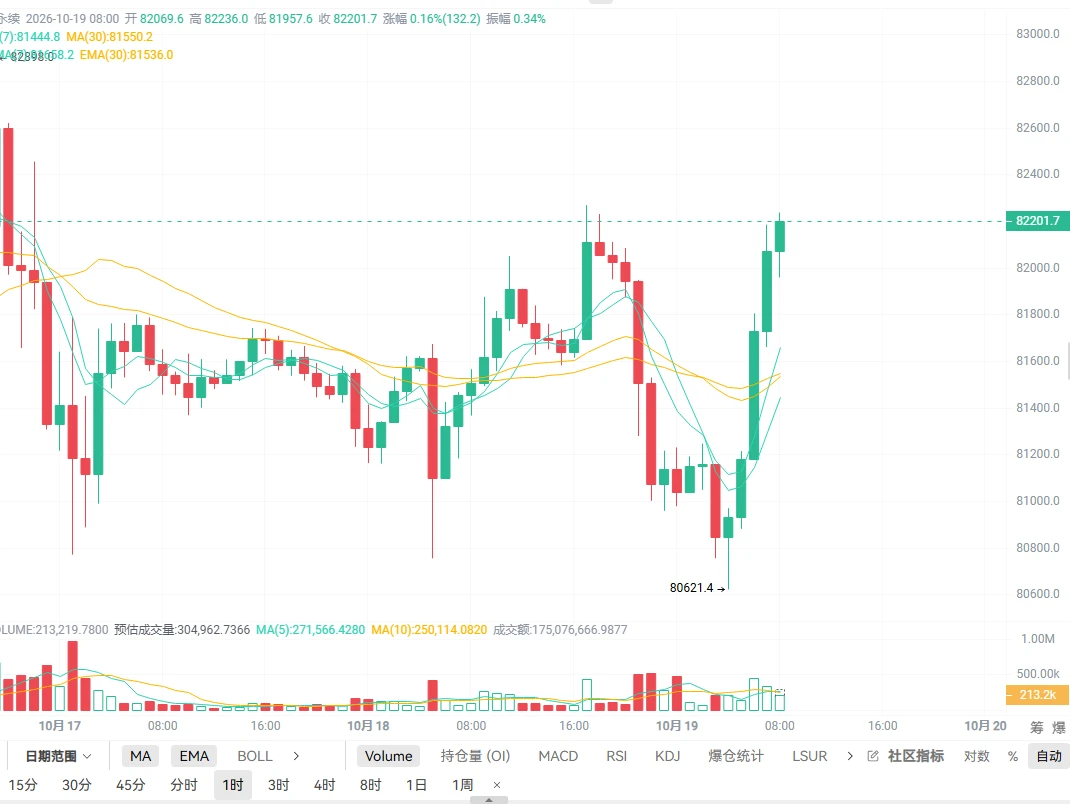
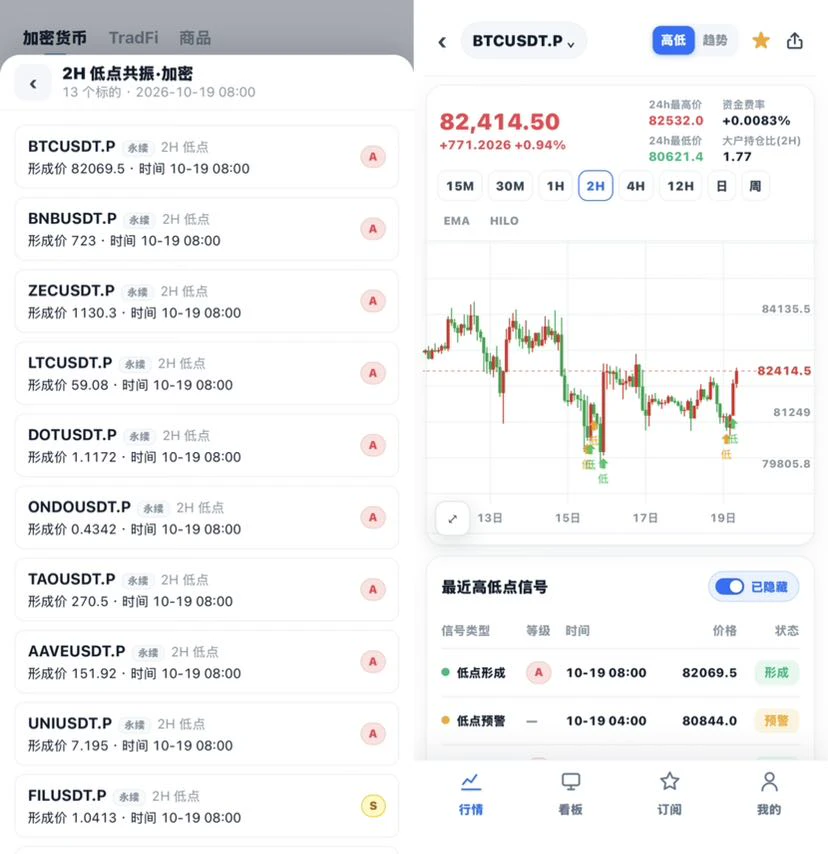
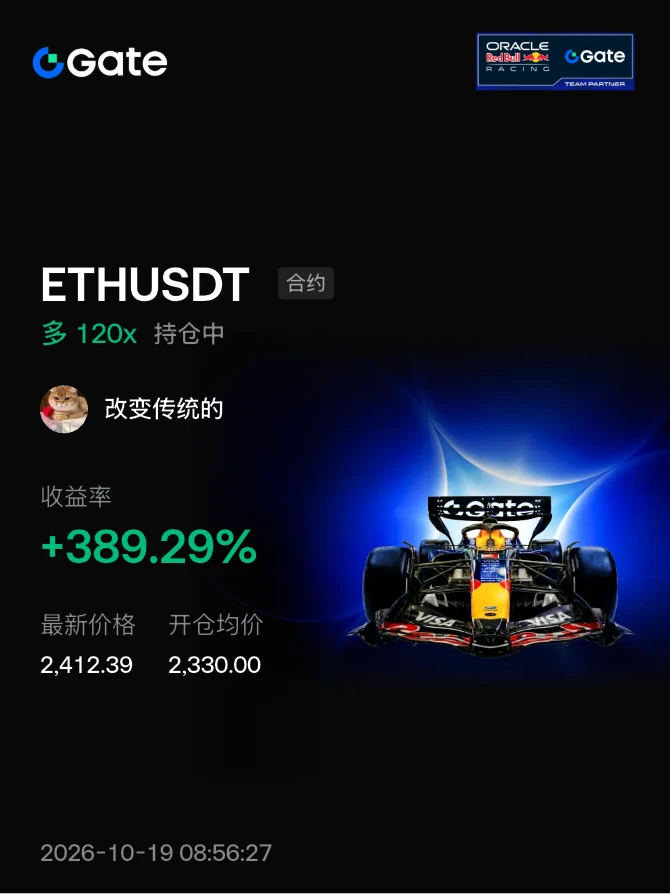
Gate BTC and ETH Futures Trading Volume: Can the Momentum Continue? In my view, the momentum Gate is seeing in the derivatives market could persist; however, sustainable growth depends on whether this increased trading activity is driven by lasting demand rather than mere short-term speculation. The reported figures are encouraging: with BTC and ETH in an uptrend, Gate ranks among the top three exchanges globally for futures trading volume in both assets, with BTC futures volume reaching approximately $7.18 billion over a 24-hour period. Nevertheless, high futures trading volume alone does not confirm a sustained upward trend. While it indicates active trading, investors must distinguish between genuine market expansion and activity driven primarily by leveraged positioning and rapid-fire trading. What will determine whether Gate’s momentum continues? 1. Sustained price appreciation for BTC and ETH If spot prices continue to rise alongside healthy futures activity, the rally may attract further investor interest. If volume increases while prices stagnate, the movement could be fueled by short-term speculation. 2. Open interest confirms participation Rising prices accompanied by an increase in open interest may suggest that new positions are entering the market. Conversely, a decline in open interest could signal the closing of positions or a reduction in leverage. 3. Sustainable funding rates Extremely positive funding rates may indicate an overcrowded long-biased market, increasing the risk of a "long squeeze" should prices reverse. Moderate funding rates, occurring alongside rising prices, would serve as a healthier signal. Three possible scenarios Scenario | Observations | Implications for Gate Continuation of the uptrend | BTC/ETH prices rise; open interest increases steadily | Futures activity may remain strong Consolidation | Prices move sideways; volume decreases | Trading activity may normalize Sharp reversal | Prices fall; leverage decreases | Liquidations and volatility may increase Key takeaway Gate’s position among the top three platforms for BTC and ETH futures is a meaningful indicator of trading activity and market participation. While a BTC volume of approximately $7.18 billion is significant, a 24-hour volume figure alone cannot determine whether this momentum is sustainable. A useful distinction: a recent report from October 16 noted that BTC futures volume on Gate stood at approximately $7.47 billion, with ETH futures volume at $6.58 billion—all while total futures volume across the broader market was in decline. This suggests that Gate has maintained a strong relative position even as overall market activity has slowed. My view: Cautiously positive, but not definitively bullish. The strongest confirmation would be sustained increases in BTC and ETH prices, stable or rising open interest, and funding rates that do not indicate excessive leverage. These indicators are useful for assessing market conditions; they are not a guarantee of future returns or trading volume. Yes, I would start by looking at BTC futures, then examine ETH to assess whether the momentum is spreading across the broader market. The most useful metrics to analyze are: * Open interest: Is new capital entering the market, or are investors closing out their positions? * Funding rates: Are long positions becoming overcrowded? * Long/short ratio: Is the positioning becoming one-sided? * Liquidations: Is the upward movement driven by short squeezes or by sustained buying? * Price and volume: Does the trading activity confirm the price trend? My priority is to determine whether the $7.18 billion in 24-hour BTC futures trading volume reported by Gate reflects sustainable participation or merely a temporary spike in leveraged trading. BTC and ETH Futures: October 18, 2026 The key question is whether both assets are attracting new positions, or if the recent rally is primarily driven by leveraged traders. While current market data offers a basis for initial comparison, it should be noted that data sources may have different update schedules and should not be considered perfectly synchronized. 1. Current derivatives market data Bitcoin (BTC) Gate USDT perpetual futures Price $81,403 Funding rate +0.006% Open interest: approx. $4.10 billion · 24-hour volume: approx. $1.01 billion Ethereum (ETH) Gate USDT perpetual futures Price $2,413 Funding rate +0.007% Open interest: approx. $1.96 billion · 24-hour volume: approx. $1.84 billion Gate Futures market data. These figures represent a snapshot in time and do not guarantee execution prices. Initial assessment: Both funding rates are positive, which—in the context of perpetual futures contracts—means that holders of long positions are making payments to holders of short positions. Notably, despite ETH having a lower market price, its trading volume exceeds that of BTC. While this situation points to an active trading environment, it does not reveal which asset carries a stronger expectation regarding its future direction. 2. Open Interest and Positioning Broader market data adds significant detail to the initial figures. Indicator BTC ETH Open Interest Trend Global BTC futures open interest decreased by 1.14% over 24 hours Funding Positive; the Gate BTC rate is approximately +0.0059% based on recent data Positive (per Gate data) Positioning Signal Potential deleveraging Potential reduction in positions Assessment Neutral to cautious Neutral to cautious Note: The open interest data for ETH covers only a specific exchange rather than the entire market; therefore, a direct comparison between the two datasets is not possible. A decline in open interest alongside rising prices may suggest that short-position holders are closing their positions, rather than new buyers entering the market aggressively. This distinction is crucial when evaluating the sustainability of a price rally. 3. Liquidations: Is leverage driving this movement? According to recent broad market data, approximately $25.91 million in liquidations occurred over a 24-hour period; of this, $17.87 million consisted of long-position liquidations, while $8.04 million involved short-position liquidations. This imbalance indicates that, during the observed period, leveraged long positions suffered greater losses than short positions. However, this does not prove that BTC or ETH has reached a market bottom. For confirmation of a stronger bullish trend, I would look for the following: * Prices stabilizing or rising following the liquidation of long positions. * Open interest beginning to recover in tandem with price. * Funding rates remaining moderate rather than experiencing a sudden spike. * Spot market buying supporting the price action, rather than futures market activity doing all the heavy lifting. 4. What should be monitored next? Bullish confirmation BTC and ETH prices rise, open interest expands gradually, and funding rates remain moderate. Sideways market Prices stabilize, while open interest and trading volume remain low. Bearish warning Prices fall and open interest rises as new short positions are opened, or crowded long positions trigger another wave of liquidations. BTC: Given the scale of the futures market, a recovery in open interest and sustained spot demand are particularly important. The recent decline in total open interest does not yet confirm a broad increase in leveraged participation. ETH: In the snapshot provided, ETH’s futures turnover on Gate is higher than that of BTC; however, higher turnover alone does not prove stronger bullish conviction. ETH requires the same confirmation across price, open interest, and funding rates. Gate (General): Current figures indicate active derivatives trading, yet evidence of sustainable bullish momentum remains insufficient. The next decisive signal will be whether BTC and ETH prices rise in conjunction with renewed growth in open interest, rather than merely experiencing a short-lived surge in volume
Gate BTC and ETH Futures Trading Volume: Can the Momentum Continue? In my view, the momentum Gate is seeing in the derivatives market could persist; however, sustainable growth depends on whether this increased trading activity is driven by lasting demand rather than mere short-term speculation. The reported figures are encouraging: with BTC and ETH in an uptrend, Gate ranks among the top three exchanges globally for futures trading volume in both assets, with BTC futures volume reaching approximately $7.18 billion over a 24-hour period. Nevertheless, high futures trading volume alone does not confirm a sustained upward trend. While it indicates active trading, investors must distinguish between genuine market expansion and activity driven primarily by leveraged positioning and rapid-fire trading. What will determine whether Gate’s momentum continues? 1. Sustained price appreciation for BTC and ETH If spot prices continue to rise alongside healthy futures activity, the rally may attract further investor interest. If volume increases while prices stagnate, the movement could be fueled by short-term speculation. 2. Open interest confirms participation Rising prices accompanied by an increase in open interest may suggest that new positions are entering the market. Conversely, a decline in open interest could signal the closing of positions or a reduction in leverage. 3. Sustainable funding rates Extremely positive funding rates may indicate an overcrowded long-biased market, increasing the risk of a "long squeeze" should prices reverse. Moderate funding rates, occurring alongside rising prices, would serve as a healthier signal. Three possible scenarios Scenario | Observations | Implications for Gate Continuation of the uptrend | BTC/ETH prices rise; open interest increases steadily | Futures activity may remain strong Consolidation | Prices move sideways; volume decreases | Trading activity may normalize Sharp reversal | Prices fall; leverage decreases | Liquidations and volatility may increase Key takeaway Gate’s position among the top three platforms for BTC and ETH futures is a meaningful indicator of trading activity and market participation. While a BTC volume of approximately $7.18 billion is significant, a 24-hour volume figure alone cannot determine whether this momentum is sustainable. A useful distinction: a recent report from October 16 noted that BTC futures volume on Gate stood at approximately $7.47 billion, with ETH futures volume at $6.58 billion—all while total futures volume across the broader market was in decline. This suggests that Gate has maintained a strong relative position even as overall market activity has slowed. My view: Cautiously positive, but not definitively bullish. The strongest confirmation would be sustained increases in BTC and ETH prices, stable or rising open interest, and funding rates that do not indicate excessive leverage. These indicators are useful for assessing market conditions; they are not a guarantee of future returns or trading volume. Yes, I would start by looking at BTC futures, then examine ETH to assess whether the momentum is spreading across the broader market. The most useful metrics to analyze are: * Open interest: Is new capital entering the market, or are investors closing out their positions? * Funding rates: Are long positions becoming overcrowded? * Long/short ratio: Is the positioning becoming one-sided? * Liquidations: Is the upward movement driven by short squeezes or by sustained buying? * Price and volume: Does the trading activity confirm the price trend? My priority is to determine whether the $7.18 billion in 24-hour BTC futures trading volume reported by Gate reflects sustainable participation or merely a temporary spike in leveraged trading. BTC and ETH Futures: October 18, 2026 The key question is whether both assets are attracting new positions, or if the recent rally is primarily driven by leveraged traders. While current market data offers a basis for initial comparison, it should be noted that data sources may have different update schedules and should not be considered perfectly synchronized. 1. Current derivatives market data Bitcoin (BTC) Gate USDT perpetual futures Price $81,403 Funding rate +0.006% Open interest: approx. $4.10 billion · 24-hour volume: approx. $1.01 billion Ethereum (ETH) Gate USDT perpetual futures Price $2,413 Funding rate +0.007% Open interest: approx. $1.96 billion · 24-hour volume: approx. $1.84 billion Gate Futures market data. These figures represent a snapshot in time and do not guarantee execution prices. Initial assessment: Both funding rates are positive, which—in the context of perpetual futures contracts—means that holders of long positions are making payments to holders of short positions. Notably, despite ETH having a lower market price, its trading volume exceeds that of BTC. While this situation points to an active trading environment, it does not reveal which asset carries a stronger expectation regarding its future direction. 2. Open Interest and Positioning Broader market data adds significant detail to the initial figures. Indicator BTC ETH Open Interest Trend Global BTC futures open interest decreased by 1.14% over 24 hours Funding Positive; the Gate BTC rate is approximately +0.0059% based on recent data Positive (per Gate data) Positioning Signal Potential deleveraging Potential reduction in positions Assessment Neutral to cautious Neutral to cautious Note: The open interest data for ETH covers only a specific exchange rather than the entire market; therefore, a direct comparison between the two datasets is not possible. A decline in open interest alongside rising prices may suggest that short-position holders are closing their positions, rather than new buyers entering the market aggressively. This distinction is crucial when evaluating the sustainability of a price rally. 3. Liquidations: Is leverage driving this movement? According to recent broad market data, approximately $25.91 million in liquidations occurred over a 24-hour period; of this, $17.87 million consisted of long-position liquidations, while $8.04 million involved short-position liquidations. This imbalance indicates that, during the observed period, leveraged long positions suffered greater losses than short positions. However, this does not prove that BTC or ETH has reached a market bottom. For confirmation of a stronger bullish trend, I would look for the following: * Prices stabilizing or rising following the liquidation of long positions. * Open interest beginning to recover in tandem with price. * Funding rates remaining moderate rather than experiencing a sudden spike. * Spot market buying supporting the price action, rather than futures market activity doing all the heavy lifting. 4. What should be monitored next? Bullish confirmation BTC and ETH prices rise, open interest expands gradually, and funding rates remain moderate. Sideways market Prices stabilize, while open interest and trading volume remain low. Bearish warning Prices fall and open interest rises as new short positions are opened, or crowded long positions trigger another wave of liquidations. BTC: Given the scale of the futures market, a recovery in open interest and sustained spot demand are particularly important. The recent decline in total open interest does not yet confirm a broad increase in leveraged participation. ETH: In the snapshot provided, ETH’s futures turnover on Gate is higher than that of BTC; however, higher turnover alone does not prove stronger bullish conviction. ETH requires the same confirmation across price, open interest, and funding rates. Gate (General): Current figures indicate active derivatives trading, yet evidence of sustainable bullish momentum remains insufficient. The next decisive signal will be whether BTC and ETH prices rise in conjunction with renewed growth in open interest, rather than merely experiencing a short-lived surge in volume