Square
Following
Hot
News
Profile
Share your thoughts
placeholder
Article
📊 Hot CPI Yesterday. Hot PPI Today. What’s Next for Markets?
US PPI in September surged 6.3% year-over-year and 1.3% month-over-month, beating expectations and fueling inflation concerns.
However, the market is not moving in sync.
📉 BTC is testing $BTC zona
📊 Tech stocks remain under pressure
🥇 Gold has rebounded amid changing interest rate expectations
Will the Fed still keep interest rates unchanged in October?
Reduce exposure, buy the dip, or wait for confirmation?
Share your market outlook, BTC analysis, or trading strategy on Gate Square with #USSeptemberPPIBeatsExpectations
The data
post-image
BTC+0.46%
Everyone, $ICNT ’s price movement was exactly as I predicted, breaking through my 0.1270 take-profit target…‼️…I hope everyone can secure their profits and earn handsome returns…‼️
post-image
ICNT+23.50%

Intraday, Ethereum pulled back toward around 2480, hitting a low of 2322 before recovering and rebounding, but the broader bearish trend remains unchanged. The rebound is only a brief bounce during the decline, with clear overhead selling pressure.
From the current chart, the main bearish structure on the daily timeframe remains intact. This rebound is merely a brief recovery after the rapid dip, while MACD remains bearish.
On the 4-hour timeframe, the price has risen close to the upper Bollinger Band, while bullish momentum is gradually fading and the rebound is weakening. On the 1-hour timef
post-image
ETH+1.29%

ZEC moved lower intraday from around 1116, falling all the way to a low of 1074.66 before staging an oversold rebound, surging to 1246.91. The larger-cycle downtrend structure remains intact, so a rebound into the resistance zone presents an opportunity to short.
From the chart perspective, the long-term downtrend structure on the daily timeframe remains intact. This recovery is merely a correction during the decline, while the dense overhead trapped positions will create strong resistance.
On the 4-hour timeframe, consecutive large bullish candles have driven prices sharply higher in a short
post-image
ZEC+8.92%
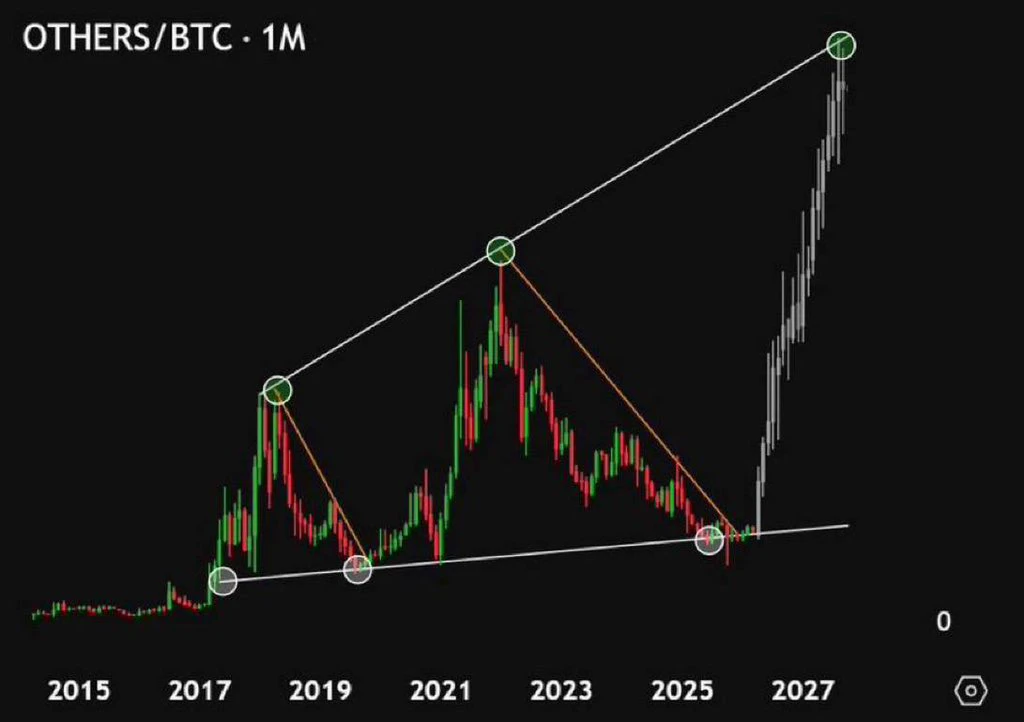
Biggest #Altseason starts any day now.
GET READY 🚀
post-image
$CORE Everyone, do you think it will reach 2u?
post-image
CORE+0.48%
Gm everyone ☀️
post-image
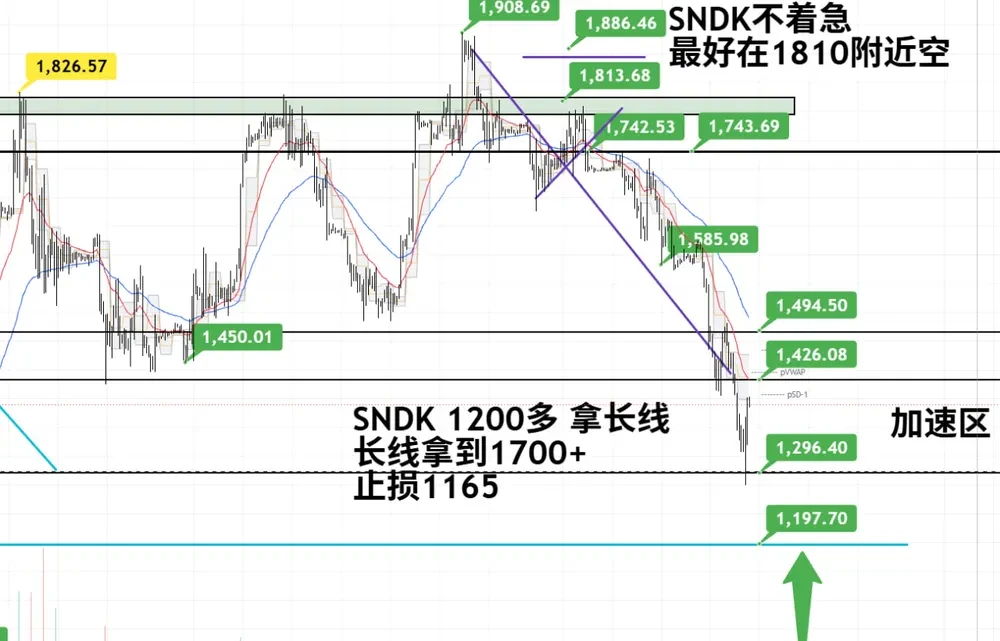
10.16 $SNDK The strategy has once again reached everyone’s favorite moment: the “three storage clowns.” First, SanDisk’s decline is not over yet; it’s just that the short positions exited early, while long positions still have to withstand further downward pressure. We previously discussed one logic,
namely, the three underlying elements for training small and large AI models: 1. Computing power: continuously allowing small and large AI models to iterate and upgrade step by step; 2. Electricity: demand for computing power continues to rise, and stable power supply is the foundation, with typic
post-image
SNDK-0.56%
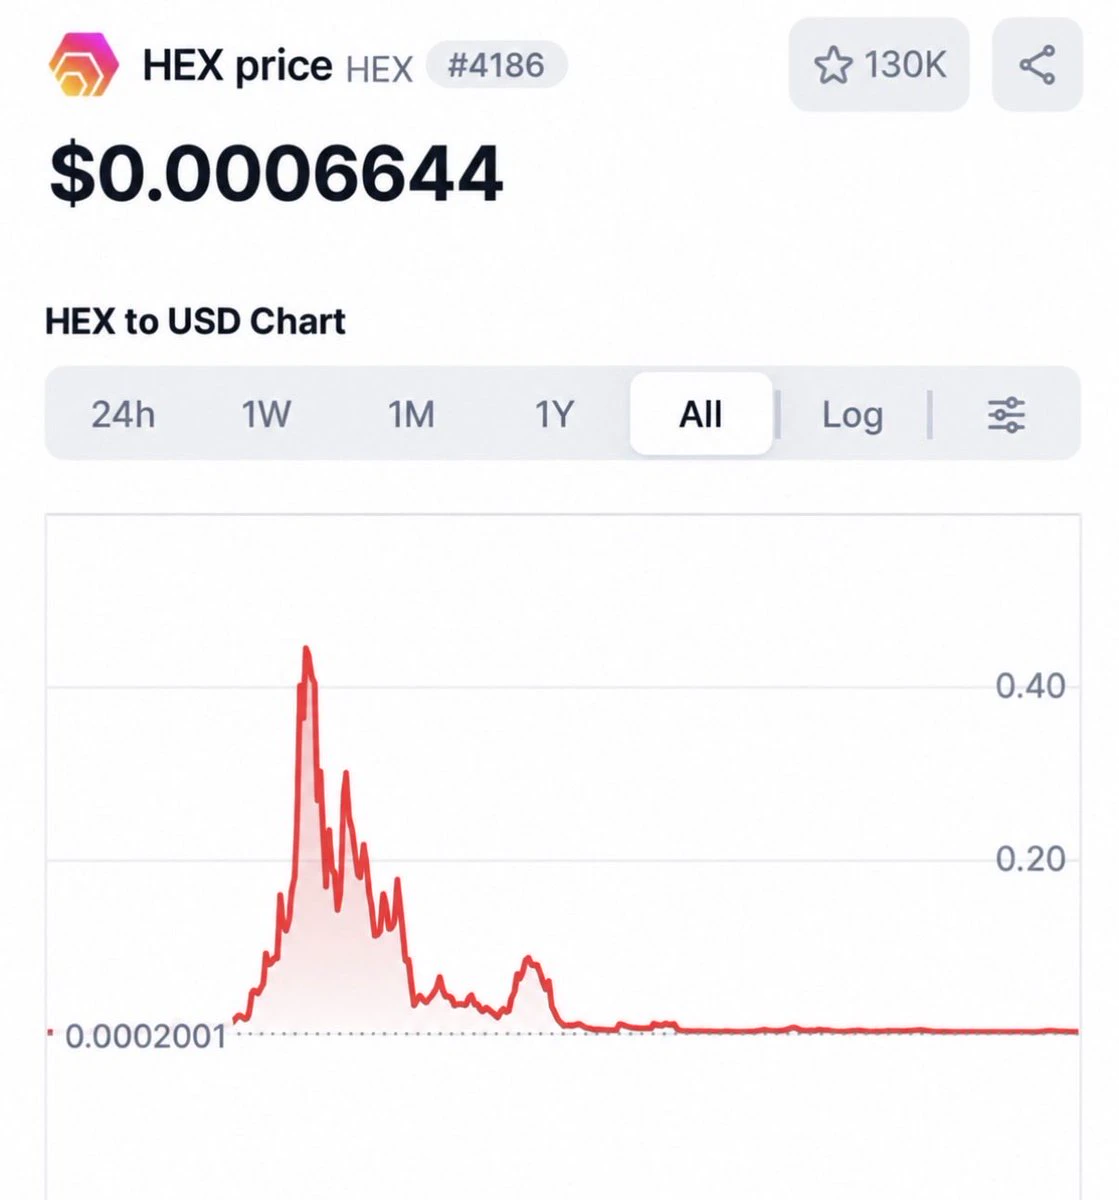
If you had put $10,000 into Richard Heart’s Hex token at the 2021 all time high you would only have $11 left and be down over -99.9%.
post-image
CPI Comes in Hotter Than Expected
live-cover
LIVE73
The anticipated script has played out in full; precision is never just empty talk.
With the skills to match, any market conditions can be handled with ease; no matter how complex the market fluctuations, every move can hit the mark.
Nine years of dedicated experience and accumulated expertise are the strongest foundation for establishing oneself in this market.
$BTC #Solana大升级定档
BTC+0.47%
BTC UPDATE
live-cover
LIVE47
$INJ ‌ has flipped the momentum, and buyers are back in control.
After dipping to $7.061, INJ has rallied to $8.56, reclaiming key levels with a strong hourly breakout. The Supertrend has turned bullish at $7.81, adding strength to the setup.
Key levels:
Support: $8.25–$8.30
Stronger support: $7.80–$7.95
Resistance: $8.56–$8.63
Targets: $8.80 → $9.00
A clean break above $8.56 could extend the move, while holding above $8.25 would keep the recovery structure healthy. After this sharp rally, a retest would be constructive.
INJ is looking stronger. Now it needs to turn this breakout into sustai
INJ+10.95%
NVDA-1.92%
  • 2
first day calling on @Pumpfun
bullish tek!
post-image
10.16 $BNB Strategy chart 1 is the BNB 4-hour candlestick chart, and chart 2 is the BNB hourly candlestick chart.
From the larger timeframe in chart 1, we can see that BNB has touched the lower major ascending trendline today, namely the positions at 10 a.m. and 10 p.m. on October 15, corresponding to 708 and 712, respectively. Given the very obvious signs of price control in BNB recently, when BTC falls and ETH falls, BNB can always recover its price after falling.
If the broader market continues to make new lows in the near term, BNB is very likely to break below this 4-hour ascending trend
BNB+0.16%
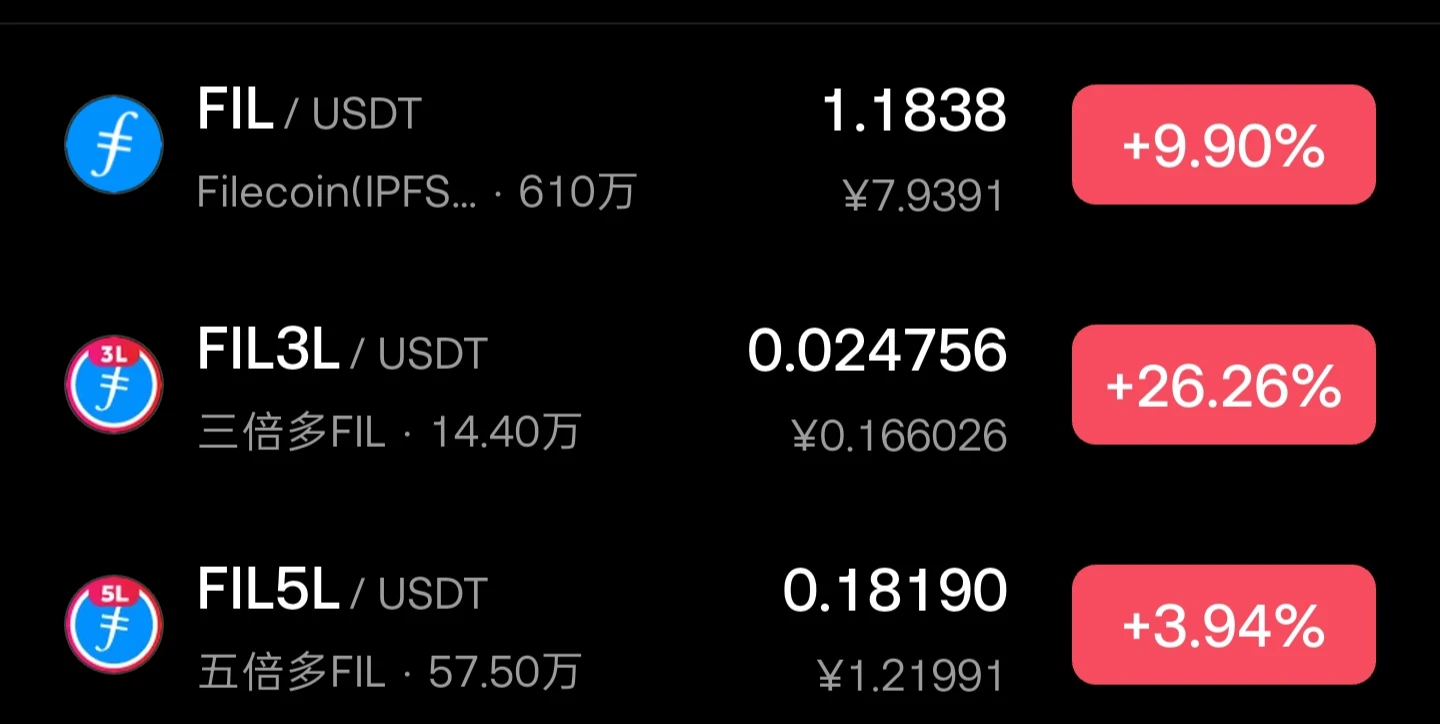
$FIL5L This is very unreasonable—is it fun to play like this? What a joke, right?👎
post-image
$BTW BTW, this rebound is like an old lady climbing stairs, panting every three steps😅 The downtrend is visible to the naked eye; don’t get carried away shorting, and keep leverage low to stay alive. It’s darkest before dawn—don’t throw your back out on a rebound; staying cautious makes you the winner🤙
post-image
BTW-15.53%

SOL oscillated downward from the earlier high of 124.99, with the intraday low dipping to 100.51 before a slight rebound, reaching a high of 106.49. This rebound is merely a minor corrective bounce during the decline; the overall broader downtrend channel remains intact, and a rebound to resistance presents an opportunity to enter short.

From the chart, the daily highs have been gradually moving lower, and the bearish trend structure remains intact. This rebound is only a brief pause amid the decline. MACD remains weak and trending downward, while heavy pressure from previously trapped posit
post-image
SOL+1.14%
Open a large long position on $WAL
! 🚀Entry range: 0.04995 - 0.05107Take-profit 1: 0.05335Take-profit 2: 0.05562Stop-loss: 0.04795The price is currently testing the 24-hour low of 0.05021, showing signs of stabilization on the 15-minute chart and potentially forming a double bottom. RSI(6) is 44.73, and with the funding rate negative, a short-term trade reverting upward toward the MA25 resistance at 0.05211 is currently the highest-probability strategy. Click here to trade 👇👇👇Other tokens: $SKHYNIX : Current price 981.58 - 24-hour change: -4.95%$AGT : Current price 0.032281 - 24-hour chan
post-image
AGT+113.65%
Recent update | On a steady winning streak every day
There is really no need to pursue a spectacular moment; not stagnating, not retreating, and steadily moving forward is the best answer to life.😁
#日韩股集体大跌
Load More

Join 40 M users in our growing community

⚡️ Join 40 M users in the crypto craze discussion

💬 Engage with your favorite top creators

👍 See what interests you

Trending Topics

USSeptemberPPIBeatsExpectations

91.35k Views1.88k Discussing

US September PPI came in at 6.3% YoY, well above the 5.3% market expectation, pointing to renewed producer-side inflation pressure. Weekly jobless claims were 199K, broadly in line with forecasts. Could hotter inflation further reduce room for rate cuts, and what does it mean for $BTC, US stocks, and gold?

DrLinHanSpeaksAtOxfordUnion

135.63k Views1.86k Discussing

JapanAndKoreaStocksPlunge

47.27k Views1.76k Discussing

View More